

Abstract

Aβ40 and Aβ42 are peptides that adopt similar random coil structures in solution. Aβ42, however, is significantly more neurotoxic than Aβ40 and forms amyloid fibrils much faster than Aβ40. Here, mass spectrometry and ion mobility spectrometry are used to investigate a mixture of Aβ40 and Aβ42. The mass spectrum for the mixed solution shows the presence of a hetero-oligomer, composed of equal parts of Aβ40 and Aβ42. Ion mobility results indicate that this mixed species comprises an oligomer distribution extending to tetramer. Aβ40 alone produces such a distribution, whereas Aβ42 alone produces oligomers of order up to dodecamer. This indicates that Aβ40 inhibits Aβ42 oligomerization.
The aggregation of the amyloid β-protein (Aβ) is an important event in the development of Alzheimer’s Disease (AD)1. Although Aβ40 is roughly ten times more abundant than Aβ42 in vivo, Aβ42 is the primary component of the amyloid deposits that are a hallmark of AD. Studies have also shown that Aβ42 is significantly more neurotoxic than Aβ402. Chemical cross-linking studies have shown that, while both Aβ40 and Aβ42 are capable of forming fibrils, they maintain distinct oligomer distributions3. For example, Aβ40 and Aβ42 monomers form dimers, trimers, and tetramers in solution. Aβ42, however, may also form pentamers and hexamers, called paranuclei, which self-associate to form dodecamers, protofibrils and fibrils3. In vivo studies in mice and humans suggest that dodecamers of Aβ42 may be the proximate neurotoxins in AD4,5.
Recently, new evidence has emerged in in vitro6,7 and in vivo8 studies that show that Aβ40, in addition to its unique assembly characteristics relative to Aβ42, may inhibit protofibril and fibril formation by the latter peptide. Here, we used mass spectrometry coupled with ion mobility spectrometry9–12 (IMS) to elucidate potential mechanisms for the Aβ40 effect. IMS has successfully been employed in the past to study the structure of Aβ13,14 and fragments of Aβ15,16. For this study, Aβ40 and Aβ42 were synthesized using FMOC chemistry17 and dissolved separately in a pH 7.4 20mM ammonium acetate buffer for a final concentration of 2mg/mL. The solutions were combined in a 1:1 Aβ40:Aβ42 ratio and filtered using Macro Spin Column gel filters (The Nest Group, Inc.). The samples were analyzed on a home-built nano-ESI ion mobility mass spectrometer18.
The mass spectrum of a 1:1 mixture is given in Fig. 1 (spectra and ATDs for other mixtures are given in Supporting Information). Peaks corresponding to the z/n= −4, −3, −5/2, and −2 charge states are present for both Aβ40 and Aβ42 (z = charge, n=oligomer size). A third peak is present between the z/n = −5/2 peaks for Aβ40 and Aβ42. This peak (m/z = 1770) represents the −5/2 peak for a mixed oligomer containing equal parts Aβ40 and Aβ42. For a 1:1 mixture near equal intensities are expected for the Aβ40 and Aβ42 monomer peaks (z/n = −4 and −3) but clearly the Aβ40 peaks are much larger than the Aβ42 peaks. This result is consistent with the fact that pure Aβ42 oligomerizes much faster than Aβ40 leading to depleted Aβ42 monomer, and that large aggregates of Aβ42 often clog the nano-ESI spray tip in our experiments. In addition a 1:2:1 distribution is expected for the z/n = −5/2 dimer peaks but again the Aβ42 dependent peaks are depleted, supporting the conclusion of rapid Aβ42 aggregation (See SI).
FIGURE 1.
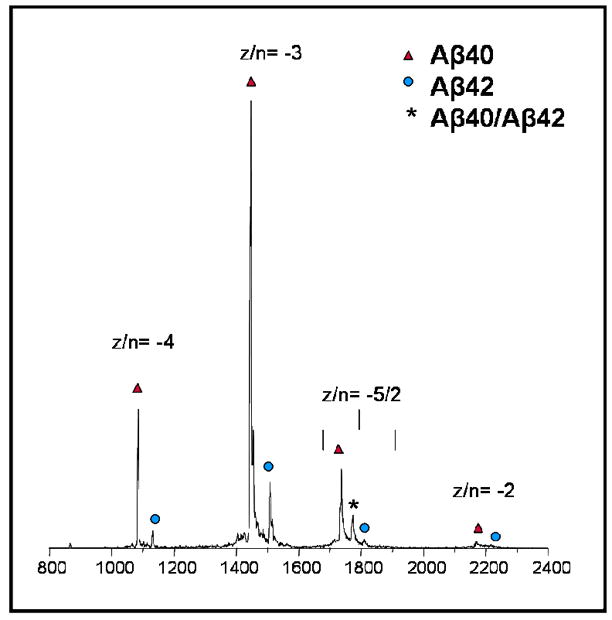
The negative ion mass spectrum of the 1:1 mixture of Aβ40 and Aβ42.
Using IMS, it is possible to separate species that have the same mass to charge ratio but differ in shape or size. For IMS separation, the ions pass through a drift cell filled with helium gas (~5 Torr) under the influence of a weak electric field, E. This allows species to be separated in time according to their cross sections. If the ions are pulsed into the drift cell then their arrival times at the detector can be measured. Measurements of the arrival time distributions (ATDs) are given in Figure 2 for the three z/n = −5/2 peaks in the mass spectrum.
FIGURE 2.

ATDs for the z/n = −5/2 charge state of a) Aβ40 b) Aβ42, and c) Aβ40/Aβ42
The Aβ40 peak is shown in Fig 2a and is composed of two partially resolved features. The smallest possible oligomer at z/n = −5/2 is the −5 dimer. Injection energy studies (data not shown: see reference 13 for a detailed discussion of injection energy methods) indicate that the feature at longer times (between 500–525 μs) is strongly favored at high injection energies. Since no new features appear at longer times, at highest injection energies this peak can be assigned as the −5 dimer. At the lowest possible injection energies the shorter time feature is favored (near 430 μs). Higher order oligomers with the same value of z/n as lower order oligomers always appear at shorter arrival times13, allowing the 430 μs feature to be assigned as the −10 tetramer. No other peaks appear in the Aβ40 −5/2 ATD so under the conditions of our experiment, oligomerization stops at the tetramer.
The ATD for the z/n = −5/2 peak of pure Aβ42 is given in Fig 2b. Clearly this ATD is more complex than that of Aβ40. Again, using injection energy studies, the various features have previously been assigned13. In addition, molecular modeling has been done to assign the qualitative structure of each of the peaks19, as noted in the figure. Of interest is the fact that Aβ42 forms a planar cyclic hexamer, a paranucleus, previously shown to exist in the Aβ42 oligomer distribution but be absent from the Aβ40 distribution. This structure is crucial for subsequent oligomerization of Aβ423. Also of interest is the terminal (Aβ42)12 species at ~350 μs, a dodecamer formed by stacking two planar hexamer rings19. The dodecamer has been implicated in memory impairment in transgenic mice4,20 and in human AD5.
The ATD for the mixed oligomer (one part Aβ40 and one part Aβ42) is given in Fig. 2c and shows two incompletely resolved features. Injection energy studies (not shown) indicate the longer time peak (~600 μs) is strongly favored at highest injection energies while the shorter time peak (~490 μs) becomes more prominent at lower injection energies. These two features are the only ones observed. We assign the ~600 μs peak as the −5 mixed dimer (Aβ40:Aβ42) and the ~490 μs peak as the −10 mixed tetramer [(Aβ40)2:(Aβ42)2].
Formation of mixed tetramers with 3:1 or 1:3 ratios of Aβ40: Aβ42 may be possible but they are not observed in the mass spectrum (Fig 1). This result supports the formation of the mixed tetramer via dimer condensation rather than sequential monomer addition:
| (2) |
The second and most important aspect of the mixed oligomer ATD in Fig. 2c is that no species larger than tetramer are observed. What this suggests is that Aβ40, present in ~10 times the concentration of Aβ42 in a healthy human brain, actually sequesters Aβ42 in stable mixed tetramers thus preventing further oligomerization of Aβ42 and formation of the putative dodecamer toxic agent, and consequently potentially deterring the development of Alzheimer’s disease.
Supplementary Material
Acknowledgments
The support of the National Institute of Health under grant IPOIAG027818 is gratefully acknowledged.
Footnotes
Supporting Information Available: Additional mass spectra of mixtures of different ratios as well as atds from the injection energy study of the z/n=−5/2 peak.
References
- 1.Roychaudhuri R, Mingfeng Y, Hoshi MM, Teplow DB. Journal of Biological Chemistry. 2008 [Google Scholar]
- 2.Dahlgren KN, Manelli AM, Stine WB, Baker LK, Krafft GA, LaDu MJ. Journal of Biological Chemistry. 2002;277(35):32046–32053. doi: 10.1074/jbc.M201750200. [DOI] [PubMed] [Google Scholar]
- 3.Bitan G, Kirkitadze MD, Lomakin A, Vollers SS, Benedek GB, Teplow DB. Proc Natl Acad Sci USA. 2003;100(1):330–335. doi: 10.1073/pnas.222681699. [DOI] [PMC free article] [PubMed] [Google Scholar]
- 4.Lesne S, Koh MT, Kotilinek L, Kayed R, Glabe CG, Yang A, Gallagher M, Ashe KH. Nature. 2006;440(7082):352–357. doi: 10.1038/nature04533. [DOI] [PubMed] [Google Scholar]
- 5.Klein WL, Stine WB, Teplow DB. Neurobiology of Aging. 2004;25(5):569–580. doi: 10.1016/j.neurobiolaging.2004.02.010. [DOI] [PubMed] [Google Scholar]
- 6.Jan A, Gokce o, Luthi-Carter R, Lashuel HA. The Journal of Biological Chemistry. 2008;283(42):28176–28180. doi: 10.1074/jbc.M803159200. [DOI] [PMC free article] [PubMed] [Google Scholar]
- 7.Yan YL, Wang CY. Journal of Molecular Biology. 2007;369(4):909–916. doi: 10.1016/j.jmb.2007.04.014. [DOI] [PubMed] [Google Scholar]
- 8.Kim J, Onstead L, Randle S, Price R, Smithson L, Zwizinski C, Dickson D, Golde T, McGowan E. The Journal of Neuroscience. 2007;27(3):627–633. doi: 10.1523/JNEUROSCI.4849-06.2007. [DOI] [PMC free article] [PubMed] [Google Scholar]
- 9.Bowers MT, Kemper PR, Vonhelden G, Vankoppen PAM. Science. 1993;260(5113):1446–1451. doi: 10.1126/science.260.5113.1446. [DOI] [PubMed] [Google Scholar]
- 10.Clemmer DE, Jarrold MF. Journal of Mass Spectrometry. 1997;32(6):577–592. [Google Scholar]
- 11.Wyttenbach T, Bowers MT. Modern Mass Spectrometry. 2003;225:207–232. [Google Scholar]
- 12.Vonhelden G, Hsu MT, Kemper PR, Bowers MT. Journal of Chemical Physics. 1991;95(5):3835–3837. [Google Scholar]
- 13.Bernstein SL, Wyttenbach T, Baumketner A, Shea JE, Bitan G, Teplow DB, Bowers MT. Journal of the American Chemical Society. 2005;127(7):2075–2084. doi: 10.1021/ja044531p. [DOI] [PubMed] [Google Scholar]
- 14.Baumketner A, Bernstein SL, Wyttenbach T, Bitan G, Teplow DB, Bowers MT, Shea JE. Protein Science. 2006;(15):420–428. doi: 10.1110/ps.051762406. [DOI] [PMC free article] [PubMed] [Google Scholar]
- 15.Murray M, Krone M, Bernstein S, Wyttenbach T, Condron M, Teplow DB, Shea J, Bowers MT. 2008 doi: 10.1016/j.jmb.2008.05.069. Submitted for publication. [DOI] [PMC free article] [PubMed] [Google Scholar]
- 16.Wu C, Murray M, Bernstein S, Condron M, Bitan G, Shea JE, Bowers MT. Journal of Molecular Biology. 2009;387(2):492–501. doi: 10.1016/j.jmb.2009.01.029. [DOI] [PMC free article] [PubMed] [Google Scholar]
- 17.Lomakin A, Chung DS, Benedek GB, Kirschner DA, Teplow DB. Proceedings of the National Academy of Sciences of the United States of America. 1996;93(3):1125–1129. doi: 10.1073/pnas.93.3.1125. [DOI] [PMC free article] [PubMed] [Google Scholar]
- 18.Wyttenbach T, Kemper PR, Bowers MT. International Journal of Mass Spectrometry. 2001;212(1–3):13–23. [Google Scholar]
- 19.Bernstein SL, Dupius NF, Lazo ND, Wyttenbach T, Condron M, Bitan G, Teplow DB, Shea JE, Ruotolo BT, Robinson CV, Bowers MT. doi: 10.1038/nchem.247. Submitted for publication. [DOI] [PMC free article] [PubMed] [Google Scholar]
- 20.Cheng IH, Scearce-Levie K, Legleiter J, Palop JJ, Gerstein H, Bien-Ly N, Puolivali J, Lesne S, Ashe KH, Muchowski PJ, Mucke L. Journal of Biological Chemistry. 2007;282(33):23818–23828. doi: 10.1074/jbc.M701078200. [DOI] [PubMed] [Google Scholar]
Associated Data
This section collects any data citations, data availability statements, or supplementary materials included in this article.