Abstract
Heterogeneity of cardiac electrical properties can lead to heart rhythm disorders. Numerical studies have shown that stimuli chosen to maximize dynamic heterogeneity terminate wave propagation. However, experimental investigations suggest that similar sequences induce fragmentation of the wavefronts, rather than complete wave block. In this article we show that an insulating boundary in an otherwise homogeneous medium can disrupt dynamically-induced wave block by breaking a symmetry in the spatial pattern of action potential duration, leading to unidirectional block and reentrant activation.
Ventricular fibrillation, a life threatening heart rhythm disorder, is likely caused by reentrant excitation of cardiac ventricular tissue [1, 2, 3]. Induction of reentrant arrhythmias requires spatial heterogeneity of electrical properties. Heterogeneity allows for the potential block of electrical wavefronts in one region of the tissue, with continued propagation in other regions, providing an opportunity for the initiation of self-sustaining reentrant excitation.
Numerous sources of spatial heterogeneity in cardiac tissue have been identified. Heterogeneities may be caused by intrinsic electrophysiological differences in the properties of the tissue, such as differences in the electrical properties of the cells [4, 5, 6] or anisotropies of cell coupling [7, 8, 9]. Alternatively, heterogeneities may be dynamically induced [10, 11]. In particular, dynamic heterogeneity and conduction block can be induced in 1D models of cardiac tissue by launching a series of rapid, irregular excitations, similar to those often observed clinically prior to onset of ventricular fibrillation [12, 13].
Dynamically-induced heterogeneities of this kind lead to a complete wave block that annihilates wave propagation [12, 13, 14]. However, experimental investigations of similar stimulus patterns in the intact canine ventricular muscle indicate that stimuli chosen to maximize dynamic heterogeneity induce ventricular fibrillation, rather than complete wave block [15, 16]. Interestingly, recent theoretical studies have suggested that insulating walls shorten the action potential duration (APD) of waves that approach the boundary [17]. It is therefore natural to ask whether the shortening of APD near boundaries can disrupt dynamically-induced wave block to the extent of causing unidirectional block and reentry.
In this article, we use computer simulations of cardiac tissue to show that changes in APD caused by a boundary are sufficient to create an asymmetry in the pattern of conduction block, leading to unidirectional propagation in an otherwise homogeneous tissue. To induce block in such homogeneous tissue we apply a series of rapid, irregular stimuli in 1D and 2D and compare the patterns of wave block in the presence and absence of a boundary.
Our results were obtained by solving the homogeneous isotropic cable equation,
| (1) |
which describes the dynamics of the transmembrane potential V (mV). Here κ is the diffusion constant (1 cm2/s), Cm is the membrane capacitance (μF cm−2), ∇ is the gradient operator and Iion is the membrane ionic current in μA cm−2. Time is measured in ms and space in cm. The insulated boundaries are characterized by the no-flux boundary condition, n̂ · ∇V = 0, where n̂ is the unit normal vector to the boundary. We consider two ionic models to calculate Iion in Eq. (1). One is a simplified action potential model (3V-SIM) by Fenton et al. [18], set 3. This model has been used to study the effects of “electrotonic” current that results from the diffusion term on the spatio-temporal dynamics of waves in excitable tissue [19]. The other model that we investigate is the canine ventricular myocyte model (CVM) by Fox et al.[20] which incorporates a more detailed description of the major cardiac ion currents. Qualitatively similar results were obtained from both models. Wave block was induced by first applying a series of 3 stimuli at a relatively long cycle length (550 ms for the 3V-SIM and 500 ms for the CVM). We refer to stimuli at this cycle length as “S1”. Next, several rapid stimuli were applied at variable intervals to mimic the interruption of the normal cardiac rhythm by “premature” stimuli that have been observed to precede ventricular fibrillation. These stimuli are referred to as S2, S3, and so forth. Block is induced by the premature sequence and our aim is to assess whether the influence of a boundary is sufficient to disrupt the patterns of conduction block.
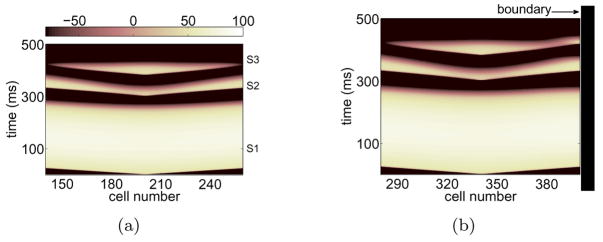
An example of complete wave block induced by launching two premature excitations is shown in Figure 1(a). In this figure, the pattern of action potential propagation is unaffected by the remotely-situated boundaries. In contrast, the application of exactly the same block-inducing sequence leads to unidirectional propagation where a boundary is present at the right end, as shown in Figure 1(b). In both cases, S2, the first premature stimulus, sets up positive gradients of APD along both directions away from the stimulus site [12, 13]. Wave block is induced when the succeeding wave S3 encounters regions of increasing APD. Near the wall, however, the effect of the boundary is to shorten APD of S2, allowing S3 to propagate.
Figure 1.
(Color online) Space-time voltage plots of complete block (a) and unidirectional block (b) on the second premature wave S3. Horizontal axis is cell number and vertical is time in ms. The 1D fiber is 10 cm long (400 cells 0.025 cm apart). Symmetric block in (a) was induced by launching waves in the mid-span of the fiber (cell 200) so that the propagation is undisturbed by the far boundaries while unidirectional block in (b) was induced by stimulating at cell 340 so that the right boundary at cell 400 (1.5 cm to the right of the stimulus) was in the vicinity. The ionic model was the 3V-SIM and the range of normalized voltage values, (0,1.3), was rescaled to (−100, 100). The interstimulus intervals were determined from the effective refractory period (ERP) of the previous wave: (ERPS1+1 ms, ERPS2+6 ms) for (S2, S3).
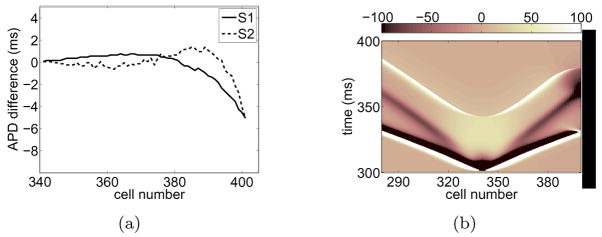
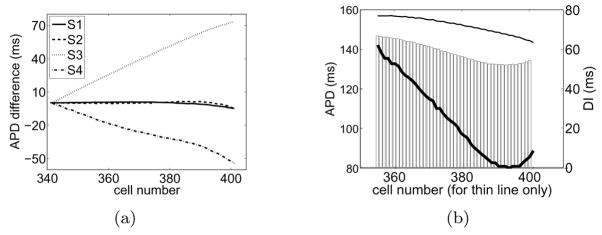
In Figure 2(a) we quantify the differences between APD near the boundary and in the bulk. (The term “bulk” will hereafter refer to tissue that is relatively far from any boundary. For example, tissue to the left of the stimulus site in Figure 1(b) is referred to as bulk tissue). We computed the difference in APD between cells located at the indicated cell number to the right of the stimulus (representing APD values for cells near a boundary) and the “mirror” cells on the other side of the stimulus (representing APD values for cells in the bulk of the tissue). For S1 and S2, the APDs are slightly shorter (about 6 ms) near the wall than in the bulk. It is likely that during normal pacing the effect of the wall is inconsequential. However, if a wave approaches tissue that is partially refractory, small variations in APD can cause qualitative changes in wave dynamics.
Figure 2.
(a) APD differences between cells near the wall and in the bulk extracted from Figure 1(b) for S1 and S2. (b) (Color online) Space-time plot of deposited diffusion current during S2. The plot shows the contribution to ∂tV from the first term on the right hand side of Eq. (1), ∇2V. The results were obtained from the simulation shown in Figure 1(b) and the values were rescaled to (−100, 100).
As described by Cain & Schaeffer [17], the shortening of APD near the wall is a diffusion effect. Consider the trailing edge of a wave moving towards a wall as illustrated in Figure 3(b) where diffusive currents flow right to left because cells are more depolarized on the right. Cells near the wall lose current to neighbors away from the wall but draw little current from neighbors closer to the wall since the wall is insulated. This imbalance of currents repolarizes cells near the wall at a faster rate than that in the bulk, leading to a shortening of APDs near the wall [Figure 2(a)]. Figure 2(b) shows a space-time plot of ∇2V, the net amount of diffusion current deposited in the cell per unit distance along the fiber, during S2. One can see that near the boundary and during repolarization (t ~ 370 ms) the deposited currents are more negative, contributing to a more rapid repolarization. The opposite argument holds for wave-backs that move away from the wall [see Figure 3(d)]—the APD of cells in the vicinity of a boundary are lengthened because cells receive more currents than what they lose to cells at the wall.
Figure 3.
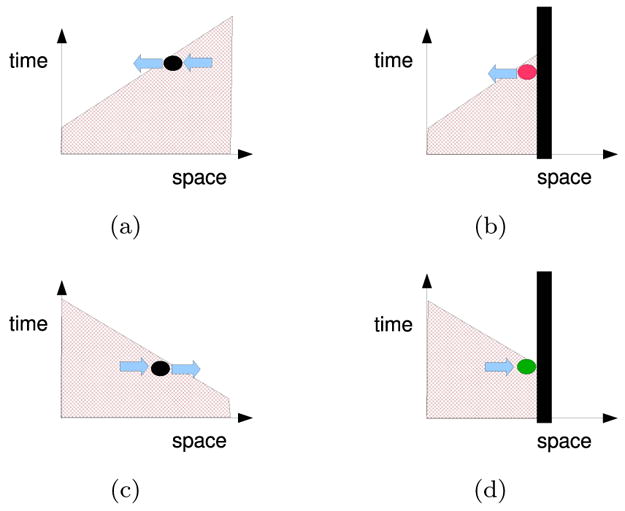
(Color online) Influence of a boundary on diffusive currents. Schematics of the wave-back in a space-time voltage plot when a wall is present (right column) and absent (left). The wave-back moves towards the right in the top panels and towards the left in the bottom. Blue arrows represent diffusion currents (proportional to −∇V). The wall reduces the amount of current that is drawn into tissue near a wall when the wave back moves towards the wall, (b), and reduces the current lost from tissue near a wall when the wave back moves away from the wall, (d).
The previous description explains boundary effects on isolated waves. However, to understand the effect of the wall during the propagation of a train of waves it is necessary to consider the dynamic coupling between waves. For example, the APD of a wave Sn near a boundary is influenced by the effect of the wall acting on this wave as well as by the local disturbances on its preceding diastolic interval (DI) due the influence of the boundary on the previous wave Sn−1.
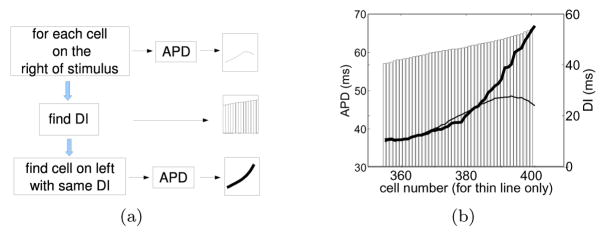
In an attempt to separate the direct influence of the boundary during a particular action potential from the disturbances on its preceding DI, we now focus on the restitution properties (i.e., the dependence of APD on the preceding DI [21]) measured at various distances from the boundary. Differences on the restitution properties between cells near and away from the wall in Figure 1(b) can be examined as a function of space with the aid of Figure 4(b). The thin line in the figure shows APD as a function of cell number (left and horizontal axes respectively) focusing on cells near the boundary. Each of the APDs have a certain prior DI which is plotted as a bar (right axis). The thin line and the bars define APD-DI pairs as a function of space. In addition, for each DI, we seek cells to the left of the stimulus (cells in the bulk that are undisturbed by the wall) that share the same DI, and plot their APD with the thick line (same left axis). Note that the specific locations of these cells to the left of the stimulus are not shown. The thin line represents a non-sorted restitution curve at various locations in the vicinity of the wall while the thick line represents a restitution with the same DIs but for cells at unspecified locations in the bulk. The separation between the thin and the thick line gives an indication of differences in restitution properties for cells near and away from the wall. As expected, this difference is most pronounced at the wall where the imbalance of diffusive currents modify the restitution properties. In addition, we draw attention to the fact that the effect of the wall is cumulative by virtue of the dynamic coupling between waves. For example, the direct influence of the boundary on S2 is to shorten its APD. In addition, the DI prior to S2 is longer near the wall because, similarly, the direct influence of the boundary on S1 was to shorten its APD, which tended to lengthen the APD during S2.
Figure 4.
Comparison of the APD-DI relation between cells near the wall and cells to the left of the stimulus site. (a) Procedure to construct the spatial restitution plot shown in (b). (b) Relation between APD and DI for S2 obtained from Figure 1(b). APD for cells near the wall (thin line, left and horizontal axes) are plotted together with the corresponding APD for cells on the other side of the site of stimulation that share the same DI (thick line, left axis, unspecified cell number). The common DI for each pair of APDs is shown as a bar (right axis).
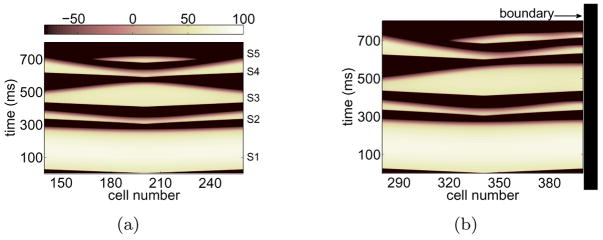
This cumulative effect of the wall is perhaps more dramatic when examining a longer sequence of premature stimuli. In particular, we focus on a short-long-short-short (S2-S3-S4-S5) sequence that is well known to amplify heterogeneities of repolarization [12, 13] and examine the influence of the wall on wave propagation and block. Waves were launched in the absence [Figure 5(a)] and presence [Figure 5(b)] of a nearby wall. An analysis of the resulting APDs is shown in Figure 6(a), illustrating the prominent alteration of APD during S3 and S4 in the presence of the boundary.
Figure 5.
(Color online) Simulation similar to that in Figure 1(a) except that 4 premature stimuli were delivered. The sequence was short-long-short-short: (ERPS1+1, ERPS2+31, ERPS3+1, ERPS4+6) in ms for (S2, S3, S4, S5).
Figure 6.
(a) Same analysis as that shown in Figure 2(a) for premature waves up to S4 extracted from Figure 5(b). (b) Same analysis as that in Figure 4(b) for S3 obtained from Figure 5(b).
Differences in the restitution properties during S3 [Figure 6(b)] indicate that cells near the wall have longer APDs than cells in the bulk with the same DI. We note that S3 is subject to two additive effects that lead to a substantial prolongation of APD near the wall. First, the imbalance of diffusive currents near a wall during S3 itself leads to a lengthening of the APD since the wave back travels away from the wall; see Figure 3(d). Secondly, the DI prior to S3 is longer near the wall than in the bulk thus eliciting longer APDs. These two accumulative effects resulting from the effect of the wall on S3 as well as from the dynamic coupling between S2 and S3, lead to long APDs near the boundary. The long-range alterations of APD during S3 are then relayed onto S4 which, in turn, is affected by the boundary, leading to severe asymmetry on the spatial dispersion of repolarization in S4 about the stimulus site. The accumulated disturbances that produce a shortening of APD on S4 all the way from the stimulus site to the boundary ultimately allow S5 to propagate towards the wall.
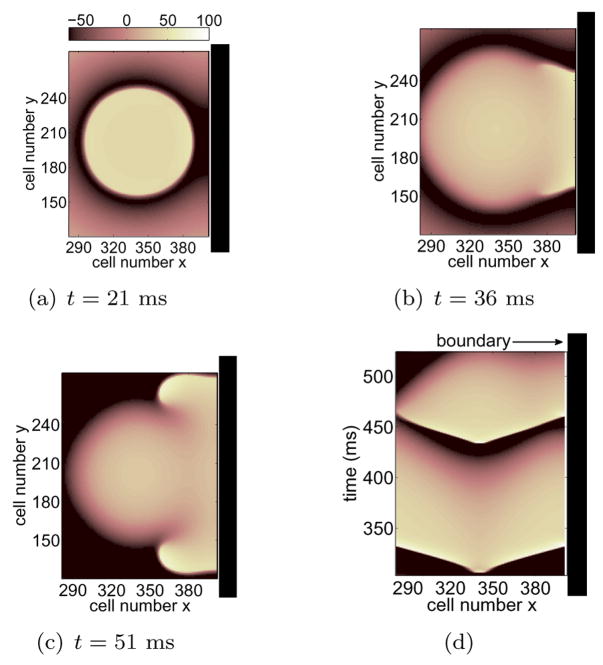
Alterations of APD due to the influence of the boundary that lead to unidirectional block in 1D as described here can induce wave break and reentry in higher dimensions. Figure 7 shows the results of a 2D simulation using the detailed ionic description by Fox et al. [20]. Four premature stimuli were applied and block occurs during the fourth beat, S5. In this example the effect of the wall does not greatly disrupt the evolution of the sequence that leads to block. However, as was the case in Figure 1(b), relatively small perturbations on APD during the wave that precedes block are suffcient to result in unidirectional propagation towards the boundary. Figures 7(a)–(c) show the evolution of S5 before and during wave break. The waves were launched in such a way that all boundaries were far from the stimulus site except for the right boundary at cells x = 400. Figure 7(a) illustrates the early stages of S5 propagation. This figure shows anisotropies on the rate of repolarization of S4 as illustrated by areas of darker blue on the right. Cells in this region allow for propagation of S5 while depolarized cells elsewhere block propagation. This results in asymmetric propagation, Figure 7(b), followed by reentry as shown in Figure 7(c). A space-time plot from these results recorded at cells y = 200 is illustrated in Figure 7(d), highlighting the shorter APD near the wall (right side of plot) during S4 and the subsequent unidirectional propagation of S5.
Figure 7.
(Color online) (a)–(c) Anisotropic block during S5 in 2D. The domain was 400×400 cells (cell spacing = 0.025 cm) and waves were launched at cells (x, y) = (340, 200) in such a way that the boundary at x = 400 is near the stimulus site. The variable t denotes time lapsed since stimulation of S5 and the voltage range (−100 mV, 20 mV) was rescaled to (−100, 100). Only the portion of the domain near the right wall is being shown. The sequence was short-long-short-short: (ERPS1+1, ERPS2+31, ERPS3+1, ERPS4+9) in ms for (S2, S3, S4, S5). (d) Time space plot for S4 and S5 recorded from the 2D simulation through the line y = 200.
We have shown that boundary-induced modifications of APD are suffcient to disrupt conduction block and induce unidirectional propagation in 1D [Figures 1(b) and 5(b)] and reentry in 2D [Figure 7(c)]. We note that other sources of intrinsic heterogeneity, including regional differences in ionic properties or anisotropies in cell coupling, could also lead to wave break and reentry. Stimulus intervals that maximize dynamically induced heterogeneity might be particularly dangerous because these intervals may drive regions of ventricular tissue close to refractoriness. Under these conditions, relatively small changes in APD (< 10 ms), and therefore in refractoriness, can cause qualitative changes in wave dynamics. Boundaries inherent in the ventricle, including the endocardial and epicardial surfaces or the interfaces between infarcted and healthy tissue, could shatter these fragile wave fronts, leading to the initiation of a reentrant arrhythmia.
Acknowledgments
The authors would like to thank Robert Miller and Greg Buzzard for developing the numerical simulation code used in this study, and Elizabeth Cherry, Flavio Fenton, Qinlian Zhou and Greg Buzzard for helpful discussions. These studies were supported by NIH Grants R44HL077938 (FSN, RFG, JJF) and R01HL75515 (FSN, RFG, JJF).
References
- 1.Gray RA, Pertsov AM, Jalife J. Nature. 1998;392:75. doi: 10.1038/32164. [DOI] [PubMed] [Google Scholar]
- 2.Weiss JN, Chen PS, Qu Z, Karagueuzian HS, Lin SF, Garfinkel A. J Cardiovasc Electrophysiol. 2002;13:292. doi: 10.1046/j.1540-8167.2002.00292.x. [DOI] [PubMed] [Google Scholar]
- 3.Witkowski FX, Leon LJ, Penkoske PA, Giles WR, Spano ML, Ditto WL, Winfree AT. Nature. 1998;392:78. doi: 10.1038/32170. [DOI] [PubMed] [Google Scholar]
- 4.Antzelevitch C. Circ Res. 2000;87:964. doi: 10.1161/01.res.87.11.964. [DOI] [PubMed] [Google Scholar]
- 5.Yan GX, Shimizu W, Antzelevitch C. Circulation. 1998;98:1921. doi: 10.1161/01.cir.98.18.1921. [DOI] [PubMed] [Google Scholar]
- 6.Sampson KJ, Henriquez CS. Am J Physiol. 2001;281:H2597. doi: 10.1152/ajpheart.2001.281.6.H2597. [DOI] [PubMed] [Google Scholar]
- 7.Panfilov AV, Keener JP. Physica D. 1995;84:545. [Google Scholar]
- 8.Fenton F, Karma A. Chaos. 1998;8:20. doi: 10.1063/1.166374. [DOI] [PubMed] [Google Scholar]
- 9.Rappel WJ. Chaos. 2001;11:71. doi: 10.1063/1.1338128. [DOI] [PubMed] [Google Scholar]
- 10.Pastore JM, Girouard SD, Laurita KR, Akar FG, Rosenbaum DS. Circulation. 1999;99:1385. doi: 10.1161/01.cir.99.10.1385. [DOI] [PubMed] [Google Scholar]
- 11.Watanabe MA, Fenton FH, Evans SJ, Hastings HM, Karma A. J Cardiovasc Electrophysiol. 2001;12:196. doi: 10.1046/j.1540-8167.2001.00196.x. [DOI] [PubMed] [Google Scholar]
- 12.Fox JJ, Riccio ML, Drury P, Werthman A, Gilmour RF., Jr New J Phys. 2003;5:101. [Google Scholar]
- 13.Otani NF. Phys Rev E. 2007;75:021910. doi: 10.1103/PhysRevE.75.021910. [DOI] [PubMed] [Google Scholar]
- 14.Fox JJ, Riccio ML, Hua F, Bodenschatz E, Gilmour RF., Jr Circ Res. 2002;90:289. doi: 10.1161/hh0302.104723. [DOI] [PubMed] [Google Scholar]
- 15.Gilmour RF, Jr, Gelzer ARM, Otani NF. J Electrocardiol. 2007;40:S51. doi: 10.1016/j.jelectrocard.2007.06.025. [DOI] [PMC free article] [PubMed] [Google Scholar]
- 16.Gelzer ARM, Koller ML, Otani NF, Fox JJ, Enyeart MW, Hooker GJ, Riccio ML, Bartoli CR, Gilmour RF., Jr . Circulation. (Published online before print August 25, 2008) [DOI] [Google Scholar]
- 17.Cain JW, Schaeffer DG. Math Med Biol. 2008;25:21. doi: 10.1093/imammb/dqn002. [DOI] [PMC free article] [PubMed] [Google Scholar]
- 18.Fenton FH, Cherry EM, Hastings HM, Evans SJ. Chaos. 2002;12:852. doi: 10.1063/1.1504242. [DOI] [PubMed] [Google Scholar]
- 19.Cherry EM, Fenton FH. Am J Physiol. 2004;286:H2332. doi: 10.1152/ajpheart.00747.2003. [DOI] [PubMed] [Google Scholar]
- 20.Fox JJ, McHarg JL, Gilmour RF., Jr Am J Physiol. 2002;282:H516. doi: 10.1152/ajpheart.00612.2001. [DOI] [PubMed] [Google Scholar]
- 21.Nolasco JB, Dahlen RW. J Appl Physiol. 1968;25:191. doi: 10.1152/jappl.1968.25.2.191. [DOI] [PubMed] [Google Scholar]


