

Abstract
Hypochlorous acid (HOCl) is potentially an important source of cellular oxidative stress. Human HOCl exposure can occur from chlorine gas inhalation or from endogenous sources of HOCl, such as respiratory burst by phagocytes. Transcription factor Nrf2 is a key regulator of cellular redox status and serves as a primary source of defense against oxidative stress. We recently demonstrated that HOCl activates Nrf2-mediated antioxidant response in cultured mouse macrophages in a biphasic manner. In an effort to determine whether Nrf2 pathways overlap with other stress pathways, gene expression profiling was performed in RAW 264.7 macrophages exposed to HOCl using whole genome mouse microarrays. Benchmark dose (BMD) analysis on gene expression data revealed that Nrf2-mediated antioxidant response and protein ubiquitination were the most sensitive biological pathways that were activated in response to low concentrations of HOCl (< 0.35 mM). Genes involved in chromatin architecture maintenance and DNA-dependent transcription were also sensitive to very low doses. Moderate concentrations of HOCl (0.35 to 1.4 mM) caused maximal activation of the Nrf2-pathway and innate immune response genes, such as IL-1β, IL-6, IL-10 and chemokines. At even higher concentrations of HOCl (2.8 to 3.5 mM) there was a loss of Nrf2-target gene expression with increased expression of numerous heat shock and histone cluster genes, AP-1-family genes, cFos and Fra1 and DNA damage-inducible Gadd45 genes. These findings confirm an Nrf2-centric mechanism of action of HOCl in mouse macrophages and provide evidence of interactions between Nrf2, inflammatory, and other stress pathways.
Keywords: Nrf2, AP-1, NF-κB, hypochlorous acid, antioxidant response element, oxidative stress, genomic profiling
INTRODUCTION
Exposure to hypochlorous acid (HOCl) represents a significant means for cellular oxidative stress. Chlorine gas is an important commercial chemical and because of its widespread use, potential for human exposure is high. Chlorine, when inhaled, can react with water in the respiratory airways to form HOCl and hydrochloric acid (HCl) (Winder, 2001). HOCl, a potent oxidant, is orders of magnitude more reactive than HCl in biological systems (Barrow et al., 1977) and as a result, respiratory injury caused by chlorine inhalation is largely due to oxidative effects of HOCl (Martin et al., 2003). Endogenous sources of HOCl include phagocytic cells such as neutrophils, which release strong oxidizing agents in an effort to kill bacteria and other pathogens. HOCl production in these cells is facilitated by a myeloperoxidase-catalyzed reaction between H2O2 and Cl- (Furtmuller et al., 2000). A number of studies demonstrated that myeloperoxidase-mediated formation of HOCl can serve as a major source of macromolecular oxidative damage (Winterbourn et al., 1992; Hawkins et al., 2003; Kawai et al., 2004). As a consequence of the respiratory burst of phagocytes, oxidative damage has been implicated in a number of diseases (Babior, 2000), and myeloperoxidase has been highlighted as a potential mediator of atherosclerotic plaque formation through oxidation of lipids in foam cells which ultimately become atherogenic (Daugherty et al., 1994). Clearly, cellular exposure to HOCl can cause many deleterious effects by disrupting cellular redox status.
Transcription factor NF-E2-related factor 2 (Nrf2), also known as Nfe2l2, represents a major component of the cell’s redox homeostasis control program (Itoh et al., 1999; Pi et al., 2007). In response to electrophiles or reactive oxygen species (ROS), Nrf2 binds to the antioxidant response element (ARE) in the promoter region of various antioxidant and detoxification genes, thereby regulating their expression (Ishii et al., 2000). Nrf2 is the central mediator of antioxidant capacity in various organs (Kobayashi and Yamamoto, 2005; Lee et al., 2005) and confers protection against oxidative damage by various environmental stressors (Kensler et al., 2007). We recently demonstrated that HOCl activates Nrf2 in cultured mouse macrophages, a potential target cell of chlorine exposure in vivo. Mouse macrophages treated with HOCl exhibit a dose-dependent increase in nuclear Nrf2 accumulation and target gene expression as early as 2 hr following treatment and exhibit maximal Nrf2 activation (i.e. Nrf2-DNA binding, mRNA expression of Nrf2-target genes, and cellular levels of glutathione (GSH)) between 6 and 12 hours post-treatment (Pi et al., 2008). Furthermore, HOCl increases mRNA levels of Nrf2-target genes to levels that are comparable to that caused by 5 μM tert-butylhydroquinone, a classic activator of Nrf2 (Lee et al., 2001). Higher, though still sub-cytotoxic levels of HOCl cause a subsequent decrease in expression of Nrf2-target genes and GSH levels (Zhang et al., 2008). As evidence continues to grow showing that Nrf2 plays an important protective role against organ and cellular injury by various toxicants, it will be necessary to characterize Nrf2-mediated antioxidant response and how it interacts with other stress pathways. Early induction of Nrf2-regulated antioxidant defense has been proposed as the first line of a multi-level defense program (Li and Nel, 2006).
To determine whether Nrf2 activation overlaps with other stress pathways, gene expression profiling was performed in mouse macrophages exposed to HOCl, using whole genome mouse microarrays. Here we reported that low to moderate concentrations of HOCl cause a robust activation of Nrf2 that operates to restore redox balance. Much higher concentrations incite second and third tier stress responses which can potentially terminate Nrf2-target gene expression. Our study demonstrates that cellular response to HOCl is centered on Nrf2, but interactions between Nrf2 and other biological pathways may play an important role in the overall cellular outcome.
It should be noted that myeleoperoxidase-catalyzed production of HOCl in neutrophils is typically in the micromolar range to low millimolar range (Kang and Neidigh, 2008), while Cl2 inhalation may result in cellular levels of HOCl comparable to or higher than were used in this study. Thus, this study has some limits on how well it can model either form of HOCl-induced cellular stress.
MATERIALS AND METHODS
Cell culture and HOCl Treatment
RAW 264.7 macrophages (RAW cells) were cultured in Dulbecco’s modified Eagle’s medium (DMEM) supplemented with 10% fetal bovine serum (FBS), 10 mM HEPES, 100 U penicillin/ml, and 100 μg streptomycin/ml. Cultures were maintained at 37°C in a humidified 5% CO2 atmosphere. DMEM, FBS, penicillin and streptomycin were obtained from Invitrogen (Carlsbad, CA).
Sodium hypochlorite solution (NaOCl) was obtained from Sigma (St. Louis, MO). HOCl exists in equilibrium with its conjugate base hypochlorite (OCl-) in NaOCl solution. The concentrations of HOCl solutions used in the current study were standardized based upon the total amount of HOCl and OCl- determined at 37°C using their molar extinction coefficients (Morris, 1966).
Lentiviral-based shRNA Transduction
MISSION shRNA lentiviral particles were obtained from Sigma. Lentiviral transduction of RAW cells with particles for shRNAs targeting Nrf2 (SHVRS-NM_010902) or Scrambled (Scr) non-target negative control (SHC002V) was performed based on manufacturer’s protocol. Briefly, 24 hr prior to transduction, RAW cells were plated in 6-well plates at ~ 40-50% confluency in complete medium described above. The following day, hexadimethrine bromide (Sigma), a transduction enhancer, was added to each well at a concentration of 8 μg/ml and viral particles were added to each well at a concentration of 2 × 10⁵ transducing units (TU) per ml. Following overnight incubation, medium containing viral particles was removed and replaced with fresh medium containing 5 μg/ml of puromycin. Cells were grown to ~90% confluency and sub-cultured in medium containing puromycin. Prior to lentiviral transduction, a puromycin titration was performed to identify the minimum concentration of puromycin that caused complete cell death of RAW cells after 3-5 days.
Cell Viability Assay
Ten thousand cells per well were plated into a 96-well plate and allowed to adhere to the plate for 24 hrs, after which medium was removed and replaced with fresh medium containing HOCl at the appropriate concentration. Cells were treated for 2, 6, 12 or 24 hours with HOCl and cell viability was determined using the non-radioactive cell proliferation assay kit (Promega, Madison, WI). The colorimetric assay detects, at 490 nm, the amount of formazan produced from MTS tetrazolium salt, a reaction that is NADH dependent. A cell viability curve, expressed as the percentage of untreated control cells is generated and the LC50 was determined from analysis of the log-linear phase of the curves.
Preparation of RNA
Total RNA was isolated with TRIzol (GIBCO/BRL Life Technologies) according to manufacturer’s instructions and then subjected to cleanup using RNase-Free DNase Set and Rneasy Mini kit (Qiagen, Valencia, CA). The resultant DNA-free RNA was diluted in RNase-free H2O and quantified by Nanodrop (Thermo, Wilmington, DE) at 260 nm. The quality of RNA samples was confirmed using RNA Nano Chips with Agilent 2100 Bioanalyzer (Agilent Technologies, Waldbron, Germany). RNA samples were stored at −70 °C until use.
Microarray Experiments and Data Analysis
From 5 μg of total RNA, cDNA was synthesized using a one-cycle cDNA synthesis kit (Affymetrix Corp., Santa Clara, CA). cDNA was transcribed to cRNA which was then biotin-labeled using GeneChip IVT labeling kit (Affymetrix). Fifteen micrograms of labeled cRNA were then hybridized to an Affymetrix Mouse Genome 430 2.0 Array at 45°C for 16 hr. Biological cRNA replicates (n = 3) were each hybridized to an individual array. After being washed using the GeneChip Fluidics Station 450, arrays were scanned using a GeneChip 3000 scanner and intensity values were extracted from the CEL file using Array Assist software (Stratagene, La Jolla, CA).
Prior to performing data analysis, intensities was normalized using robust multi-array average (RMA) method (Irizarry et al., 2003) then log2 transformed. RMA is a method of adjusting gene expression across several arrays. The method uses a linear model to fit probe-level data, analyzing each microarray in the context of other arrays from the experiment. The procedure applies a background correction, a quantile normalization which brings expression values to a common scale and concludes with an iterative median centering. The gene expression data (CEL files and RMA processed) can be accessed on the NCBI Gene Expression Omnibus (http://www.ncbi.nlm.nih.gov/geo/) using accession No. GSE15457).
Genes with differential expression compared to control were determined by performing a t-test at each dose using ArrayAssist software. A corrected p-value, with adjustments for multiple comparisons was also calculated (Benjamini and Hochberg, 1995). Benchmark dose (BMD) analysis was performed using BMDExpress software (Yang et al., 2007). Using this software, one-way ANOVA was performed to identify probe sets with differential expression at any HOCl concentration (i.e. corrected p-value < 0.05). Using this abridged list of significant probe sets, the dose-response behavior of each probe set was characterized by fitting expression data with a linear, 2° polynomial, 3° polynomial, and power models. The least complex model that best described the data was selected as previously described and used to estimate the BMD (Yang et al., 2007).
Average linkage, hierarchical clustering was performed using Cluster software on median centered (by genes) data, and visualization was facilitated by Treeview (Eisen et al., 1998). Functional and pathway analysis of differentially expressed probe sets was performed using the Database for Annotation, Visualization and Integrated Discovery (DAVID) (Dennis et al., 2003) and Ingenuity Pathway Analysis (IPA, Ingenuity Systems, www.ingenuity.com). Pathway enrichment was determined by a Fisher exact p-value ≤ 0.05 and a minimum of 5 genes in the pathway. A corrected p-value based on Benjamini-Hochberg method is also reported.
Quantitative real-time RT–PCR
Total RNA was reverse transcribed with MuLV reverse transcriptase and Oligo d(T) primers (Applied Biosystems, Foster City, CA). The SYBR Green PCR Kit (Applied Biosystems) was used for quantitative real-time RT-PCR analysis. The primers were designed using Primer Express (Applied Biosystems) and synthesized by MWG-BIOTECH Inc. (High Point, NC). Mouse primers sequences are listed in Supplementary Table 1. Relative differences in gene expression between groups were determined from cycle time (Ct) values. These values were first normalized to 18S in the same sample (ΔCt) and expressed as fold over control (2-ΔΔCt). Real-time fluorescence detection was carried out using an ABI PRISM 7700 Sequence Detector (Applied Biosystems).
Preparation of protein extracts for Western blot
Cells were washed three times with ice-cold PBS and whole cell extracts were obtained by using Cell Lysis Buffer (Cell Signaling, Technology, Inc. Beverly, MA) with 0.5% of Protease Inhibitor Cocktail (Sigma) and 1% of Phosphatase Inhibitor Cocktail I (Sigma). Cells were further lysed by sonication three times for 5 seconds each.
Western blot analysis
Proteins were separated by Novex Tris-Glycine Gel (Invitrogen) and transferred onto nitrocellulose membranes (Invitrogen). The membranes were then incubated at room temperature for 1 hr in blocking buffer comprised of 5% non-fat dry milk in Tris-buffered saline (TBS, Pierce, Rockford, IL), followed by incubation with the indicated antibodies in the blocking buffer at 4 °C overnight. After being washed three times for 10 min each with TBS with 0.1% Tween (TBST), the membranes were incubated with alkaline phosphatase-conjugated anti-goat or anti-rabbit IgG (Sigma) antibodies followed by washing with TBST. Immunoreactive bands were visualized with ECF substrate (GE Healthcare). Quantification of the results was performed on a Typhoon scanner using Bio-Rad Gel Doc 2000™ Systems and Bio-Rad TDS Quantity One software. Antibodies for v-fos FBJ murine osteosarcoma oncogene (CFOS) (Cat No. sc-52), heme oxygenase (HMOX1) (Cat No. sc-1797) and glyceraldehyde 3-phosphate dehydrogenase (GAPDH) (Cat No. sc-20357) were from Santa Cruz Biotechnology, Inc. (Santa Cruz, CA). Antibody for glutamate-cysteine ligase (GCL) (Cat No. RB-1697) was obtained from Lab Vision (Fremont, CA). Caspase 3 (Cat No. 9662) antibody was obtained from Cell Signaling (Boston, MA). Antibody for β-actin (Cat No. A1978) was obtained from Sigma Aldridch. Antibody for superoxide dismutase 1 (SOD1) was a gift from Dr. Yoshito Kumagai of University of Tsukuba in Japan.
Statistical analysis
Data are expressed as mean ± SD. For comparisons between two groups, Students’ t-test was performed. One-way ANOVA followed by Tukey’s or Dunnett’s test was used to compare all groups or selected groups to controls. A p value of ≤ 0.05 was considered significant. Statistical analysis to evaluate the time-and dose-dependent effect of HOCl exposure on intracellular GSH was performed using two-way ANOVA with Bonferroni post hoc testing.
RESULTS
Cell Viability
Viability of RAW cells following treatment with HOCl in DMEM with 10% FBS and 10 mM HEPES was determined by measuring NADH-dependent conversion of MTS into formazan at λ = 490 nm (Supplementary Figure 1A). By this method concentrations well above 6 mM were required to kill 50% of cells following 6 hrs of treatment with HOCl. By 24 hrs, the LC50 determined using this assay is ~ 2.5 mM (data not shown). Cytotoxicity as measured by LDH release in medium (Supplementary Figure 1B) and ATP production by cells (data not shown) also revealed that HOCl concentrations below 3.5 mM by 6 hr treatment did not cause significant cytotoxicity. HOCl also does not trigger apoptosis, as determined by protein expression of caspase 3 following 6 hr treatment with up to 2.8 mM HOCl (Supplementary Figure 1C). Based on these data, 0.14 – 3.5 mM of HOCl was used in the current study to investigate the dose-dependent transition in the cellular response.
Benchmark Dose Analysis using BMDExpress
Peak expression of HOCl-induced oxidative stress responsive genes occurred 6-12 hrs following treatment (Pi et al., 2008). Thus, RAW cells were treated with HOCl (up to 3.5 mM) for 6 hrs, and RNA was applied to Affymetrix microarrays which contain 45,000 probe sets representing over 34,000 mouse genes. One-way ANOVA produced a list of ~8500 probe sets representing genes that were differentially expressed compared to control for at least one HOCl concentration. This list was further analyzed using BMDExpress software to identify probe sets with the lowest benchmark dose (BMD), which is defined as the dose at which a statistically significant departure from control can be detected (Yang et al., 2007). Each probe set was fit to a linear, second-order polynomial, third-order polynomial, and power model. The least complex model that best describes the data was selected and used to estimate the benchmark dose (BMD).
HOCl treatment in RAW cells led to various transcriptional changes. BMDExpress identified a subset of highly HOCl-sensitive probe sets (total of 467) that were responsive to low concentrations of HOCl with a BMD less than 0.35 mM. Interestingly, these all exhibited non-linear dose-response behavior with the best fit line having a second-or third-order polynomial or power function. Dose response curves for four representative HOCl-sensitive and/or Nrf2-target genes Hmox1, catalase (Cat) and cell cycle related genes, cyclin D3 (Ccnd3) and cyclin-dependent kinase 6 (Cdk6) are shown (Figure 1). The general non-monotonical behavior is still apparent in each representative plot.
Figure 1. Various dose response behaviors are observed among HOCl-sensitive genes.

BMDExpress software was used to fit expression data with a linear, second-order polynomial, third-order polynomial, and power model. The least complex model that best described the data was selected and used to estimate a BMD. Log2 expression data (mean ± SD) for heme oxygenase, catalase, cyclin D3 and cyclin dependent kinase 6 were plotted as a function of HOCl dose together with the best model.
Genes were further characterized as having up-regulated or down-regulated expression at their BMD. Some of the sensitive genes which were up-regulated at their BMD (complete list available in Supplementary Table 2) include iron transporter, Slc40a1 (BMD = 0.12 mM), prostaglandin receptor IR, Ptgir (BMD = 0.12 mM), Hmox1 (BMD = 0.15 mM), Cat (BMD = 0.15 mM), sulfiredoxin, Srxn1 (BMD = 0.17 mM), glutamate transporter, Slc7a11 (BMD = 0.18 mM), peroxiredoxin, Prdx1 (BMD = 0.18 mM), glutamate-cysteine ligase modifier subunit, Gclm (BMD = 0.19 mM), alpha fetoprotein Afp (BMD = 0.21 mM) and thioredoxin reductase 1, Txnrd1 (BMD = 0.23 mM). A heatmap of expression ratios for these up-regulated transcripts is shown (Figure 2), with the probe sets in order by the expression ratio at 0.14 mM HOCl (from highest to lowest). The majority of them exhibit peak expression between 1.4 and 2.8 mM HOCl. A small suite of Nrf2-related genes in Group A (Figure 2) were not only the most sensitive, but also the most responsive, exhibiting gene expression changes as high as 36-fold over control. Furthermore, based on microarray measurements these genes also peaked in expression at much lower HOCl concentrations (0.7 -1.4 mM) compared to all other HOCl-sensitive genes, suggesting that they may represent a first line of oxidative stress response. Interestingly, Nqo1, a prototypic target gene of Nrf2, was not among this group of genes because it had a slightly higher BMD (0.4 mM). RT-PCR measurements of Nqo1, however demonstrate it to be a sensitive and responsive gene in response to HOCl treatment (see below).
Figure 2. Heat map of HOCl-sensitive genes.

Differentially expressed genes were identified by ANOVA and BMD analysis was performed to identify genes with BMD < 0.35 mM. Using only genes which were up-regulated at their BMD, gene expression ratios (with respect to control) were calculated and genes were ordered (from highest to lowest) by expression ratio at 0.14 mM HOCl. Black represents no change from control and red represents an increase.
Among the sensitive genes with down-regulated expression at the BMD (complete list in Supplementary Table 3) were beta-amyloid cleavage enzyme, Bace1 (BMD = 0.19 mM), Cd47 (BMD = 0.20 mM), Ccnd3 (BMD = 0.22 mM) and Cdk6 (BMD = 0.23 mM). Interestingly, glutathione peroxidase 4, Gpx4 (BMD = 0.29 mM) and Gpx1 (BMD = 0.30 mM) were also down-regulated in response to HOCl.
Of the 8500 probe sets that were differentially expressed based on ANOVA, about ~1800 were characterized by BMDExpress as having linear dose response behavior. However, when expression profiles for these genes were closely examined, many of them exhibited non-linear but monotonic behavior and were fairly non-responsive until HOCl concentrations reached 0.7 mM HOCl or higher. The heatmap shows hierarchical clustering of probe sets representing the most robust genes (altered only at the highest HOCl concentration) whose dose response was best fit by either a linear function or a first order power function (Figure 3). Included among these are heat shock protein a1b (Hspa1b), all isoforms of growth arrest DNA damage inducible-gene 45 (Gadd45), DNA damage inducible transcript 3 (Ddit3), FBJ osteosarcoma oncogene (cFos) and numerous histone clusters.
Figure 3. Heatmap of genes which exhibit robust expression profiles in response to HOCl.

Differentially expressed genes (compared to control) were identified by t-test using ArrayAssist. Hierarchical clustering of genes which were significantly different from control only at 3.5 mM HOCl and exhibited a FC of 2.0 or greater was performed using Cluster and Treeview software.
Pathway Analysis of HOCl-sensitive Genes
For functional categorization, up-regulated and down-regulated probe sets were submitted separately to Ingenuity Pathway Analysis (IPA) software and the Database for Annotation, Visualization and Integrated Discovery (DAVID). From the list of probe sets with up-regulated expression at the BMD, core analysis using IPA revealed a significant enrichment of protein ubiquitination, Nrf2-mediated oxidative stress, xenobiotic metabolism, glucocorticoid receptor signaling, acute phase response and leukocyte extravasation signaling (Table 1). A list of the relevant probe sets associated with these pathways is available in Supplementary Table 4. Additionally, Gene Ontology (GO) biological processes involved in protein catabolism and transport were enriched in this list of up-regulated genes (Table 2). Down-regulated canonical pathways included cell cycle checkpoint regulation at G1/S and Huntingdon’s disease signaling. GO biological processes that were significantly suppressed were those related to establishment and maintenance of chromatin architecture, negative regulation of DNA-dependent transcription and regulation of small GTPase mediated signaling.
Table 1.
Functional analysis of HOCl-sensitive genes using Ingenuity Pathway Analysis
| IPA Canonical Pathways | P-Value | Corr. P-Value | % of Genes in Pathway | Total in Pathway |
|---|---|---|---|---|
| Up-regulated | ||||
| Protein ubiquitination pathway | 1.26E-11 | 1.32E-09 | 7.3 | 205 |
| Nrf2-mediated oxidative stress response | 9.55E-10 | 4.90E-08 | 7.1 | 183 |
| Xenobiotic metabolism signaling | 6.31E-05 | 0.002 | 3.6 | 253 |
| Glucocorticoid receptor signaling | 0.003 | 0.05 | 2.5 | 279 |
| Acute phase response | 0.01 | 0.09 | 2.8 | 178 |
| Leukocyte extravasation Signaling | 0.01 | 0.1 | 2.6 | 196 |
| Down-regulated | ||||
| Cell cycle: G1/S checkpoint regulation | 2.9E-04 | 0.03 | 8.3 | 60 |
| Huntington’s disease signaling | 0.02 | 0.48 | 2.6 | 233 |
Table 2.
Functional analysis of HOCl-sensitive genes based on Gene Ontology
| GO Biological Processes | P-Value | Corr. P-Value | % of Genes Submitted | Total Genes Submitted |
|---|---|---|---|---|
| Up-regulated | ||||
| Protein catabolic process | 2.00E-04 | 0.46 | 5.6 | 227 |
| Intracellular transport | 2.50E-04 | 0.28 | 10.7 | 227 |
| Modification-dependent macromolecule catabolic process | 7.60E-04 | 0.48 | 4.5 | 227 |
| Cellular protein catabolic process | 9.10E-04 | 0.45 | 4.5 | 227 |
| Protein transport | 0.002 | 0.56 | 9.6 | 227 |
| Protein modification process | 0.009 | 1.0 | 15.3 | 227 |
| Endosome transport | 0.03 | 1.0 | 1.7 | 227 |
| Microtubule-based movement | 0.03 | 1.0 | 2.8 | 227 |
| Intracellular protein transport | 0.04 | 1.0 | 5.6 | 227 |
| Cytoskeleton-dependent intracellular transport | 0.04 | 1.0 | 2.8 | 227 |
| Down-regulated | ||||
| Establishment and/or maintenance of chromatin architecture | 4.75E-05 | 1.20E-01 | 5.6 | 240 |
| DNA packaging | 6.00E-05 | 0.1 | 5.6 | 240 |
| Endocytosis | 8.80E-04 | 0.5 | 3.9 | 240 |
| Negative regulation of transcription, DNA-dependent | 0.009 | 1.0 | 3.4 | 240 |
| Meoisis I | 0.05 | 1.0 | 1.3 | 240 |
| Regulation of small GTPase mediated signal transduction | 0.05 | 1.0 | 2.6 | 240 |
Dose Response Analysis of Cellular Pathways
Probe sets with differential expression, compared to control, were identified by t-test using ArrayAssist software. Supplementary Table 5 shows the percentage of probe sets with differential expression at each HOCl concentration. Comparison analysis using IPA was conducted to determine the relative significance of various canonical pathways over all HOCl concentrations and potentially identify pathways that are activated in concert. Hierarchical clustering of canonical pathways that were enriched by genes exhibiting a 2-fold or greater increase in expression is shown (Figure 4), with shading representative of pathway enrichment at each HOCl concentration. The enrichment of the Nrf2 pathway increases up to 0.7 mM HOCl and declines at higher concentrations. Other pathways in group B that are up-regulated in a similar fashion include glutathione metabolism, ERK/MAPK signaling, PI3K/AKT signaling and several adaptive immune responses. Within group A, several pathways associated with innate immunity, including NF-kB signaling, IL-6, IL-10, chemokine and interferon signaling are all up-regulated in a bi-modal fashion, with peak significance of these pathways occurring at 0.35 mM and 2.1 mM. Pathways which show similar enrichment profiles such as LXR/RXR activation, glucocorticoid receptor signaling and p38/MAPK signaling are potentially related to the innate immune response signaling. In group C, activation of protein ubiquitination and glutamate receptor signaling occurs at 2.8 mM HOCl and p53 and Huntington’s disease signaling pathways are significantly enriched at 3.5 mM HOCl concentration.
Figure 4. Hierarchical clustering of Ingenuity Pathway Analysis (IPA) canonical pathways.

Comparison analysis was performed using IPA as described in “Materials and Methods.” Pathways which were enriched (corrected p-value < 0.05) for at least one HOCl concentration are included in the heat map. Shading is based on the corrected p-value for a given pathway at each HOCl concentration.
Real-time RT-PCR and Western Blot Analysis of Nrf2-mediated and other signaling networks
To confirm the patterns of gene expression observed in microarray experiments, real-time RT-PCR and western blot analysis were performed for several Nrf2-related genes. mRNA expression of Nrf2 and target genes, Nqo1, Gclm, Cat, Hmox1, and Txnrd1 peaks with 1.4 mM HOCl (Figure 5A). At higher concentrations of HOCl, transcriptional activation of target genes decreased to basal levels, or lower. Western blot analysis also confirmed that HMOX1 and GCL protein expression was elevated at moderate HOCl concentrations and suppressed at higher concentrations (Figure 5B). Unlike other Nrf2 target genes, SOD1 shows little change in mRNA expression by RT-PCR and exhibits a monotonic increase in protein levels. Consistent with the HOCl-induced gene expression of GSH metabolism-related genes, such as Gclc and Gclm, the levels of total GSH were significantly increased by lower concentrations of HOCl (Pi et al., 2008), whereas high concentrations of 2.8 mM caused a significant decrease (Figure 5C).
Figure 5. Activation of Nrf2-mediated protein expression at moderate HOCl concentrations validates microarray data.

A) RT-PCR measurements were performed using cells treated for 6 hrs. B) Western blot analysis (representative blot for n = 3) using whole cell lysates were performed with cells treated for up to 24 hrs. C) Cellular levels of glutathione (GSH) were performed using cells treated for up to 24 hrs. * p < 0.05 compared to control ; # p < 0.05 compared to respective time point at 2.8 mM.
Induction of antioxidant genes presumed to be regulated by Nrf2 is quite dependent on the experimental system and oxidative stressor (Chan and Kan, 1999; Cho et al., 2002). Using lentiviral-based shRNAs targeting Nrf2 in RAW cells, we investigated the extent to which HOCl-induced gene expression of various antioxidant genes was Nrf2-dependent. A non-target (scrambled) shRNA was used as a negative control. Cells transduced with Nrf2 shRNA exhibited a greater than 90% knockdown of Nrf2 expression compared to the negative control (Figure 6A). Following 6 hr treatment, the cells remained viable across the selected dose range of HOCl (Figure 6B). Concentrations of HOCl up to 1.4 mM caused an upregulation of mRNA levels of Nqo1, Gclm, Cat, Hmox1 in cells with Scrambled shRNA (Figure 6C), but this increase was significantly hampered or not observed in cells transduced with Nrf2 shRNA. Similar to untransduced cells (in Figure 5), higher concentrations of HOCl caused a decrease in Nrf2-target gene expression.
Figure 6. HOCl-induced antioxidant gene expression is largely Nrf2-dependent.
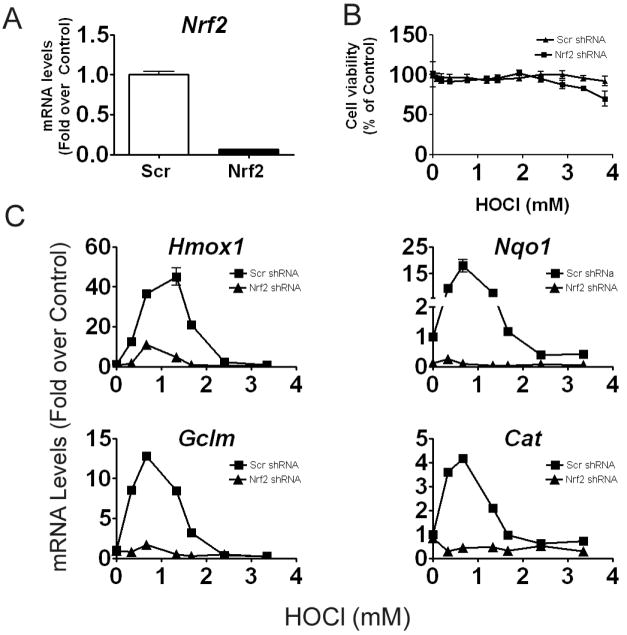
A) RT-PCR measurements of Nrf2 expression were performed using untreated cells which were transduced with Scramble (Scr) or Nrf2 shRNA. B) Cell viability of transduced cells in response to 6hr HOCl treatment was measured by MTS based assay. C) RT-PCR measurements of antioxidant genes were performed using transduced cells, which were treated for 6 hr with HOCl
Inflammatory and AP-1-mediated pathways that were modulated by HOCl based on microarray data were also further evaluated. Inflammatory cytokines Il1b, Il6 and Infγ were all maximally up-regulated at 0.7 mM HOCl (Figure 7). Also gel-shift analysis shows that NF-κB-DNA binding is maximally activated at this HOCl concentration (Supplementary Figure 2). Expression of cFos (mRNA and protein) was elevated at or above 2.8 mM HOCl (Figure 8).
Figure 7. Maximal activation of inflammatory mediators at concentrations that are lower than that for maximal Nrf2 activation.
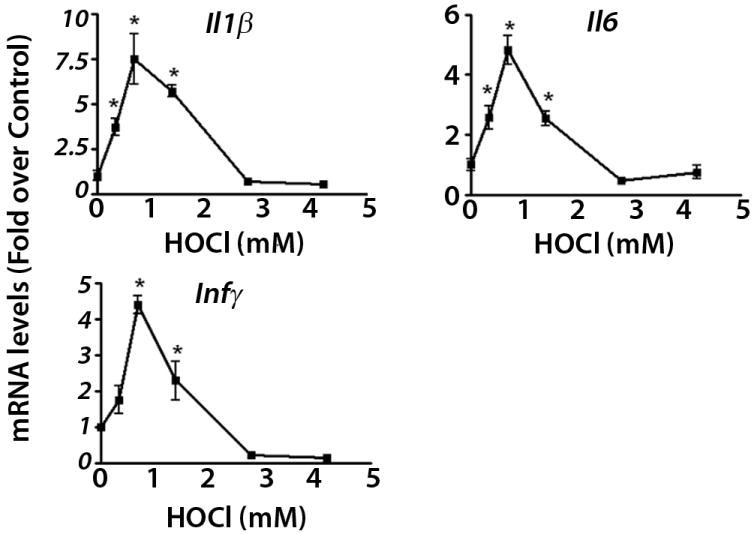
RT-PCR measurements were performed using cells treated for 6 hrs. * p < 0.05 compared to control.
Figure 8. Elevated expression of AP-1 protein cFOS by high concentrations of HOCl.
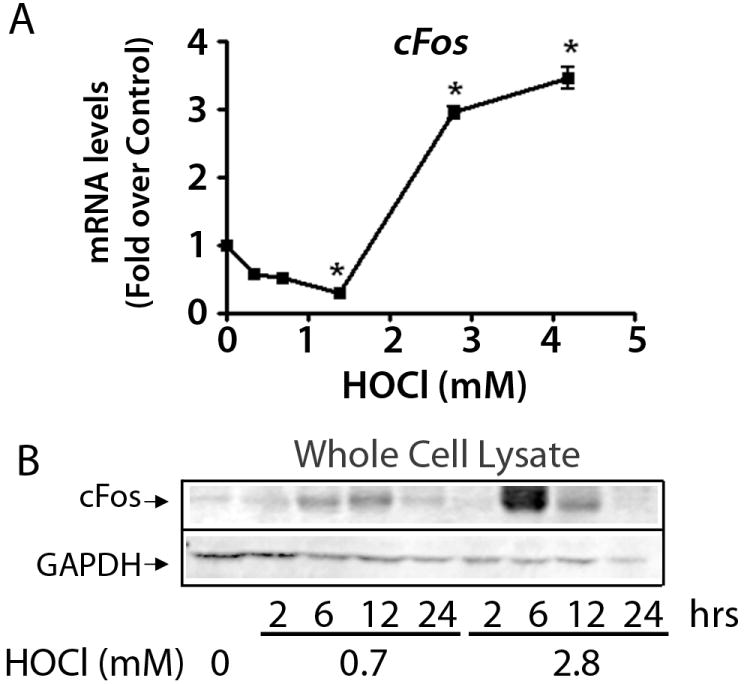
A) RT-PCR analysis and B) western blot analysis (representative blot for n = 3) in whole cell lysates were performed using cells treated for 6 hrs. * p < 0.05 compared to control.
DISCUSSION
We have previously demonstrated that HOCl activates Nrf2 (Pi et al., 2008), and these microarray data support the observation. Based on pathway analysis of the array data, transcriptional changes caused by low to moderate HOCl treatment (up to 1.4 mM) are largely associated with Nrf2-mediated antioxidant response. A suite of antioxidant and detoxifying enzymes such as Hmox1, Cat, Gclm, Prdx1, Trxn1, and Sxn are all up-regulated at concentrations well below those that are required to activate many secondary responses to HOCl. Furthermore, reduced expression of Hmox1, Nqo1, Gclm and Cat in cells with significantly lower Nrf2 expression (via shRNA), demonstrates that in this cell system, induction of these antioxidant enzymes by HOCl is largely Nrf2-dependent. Because Nrf2-mediated antioxidant defense is regarded as an adaptive mechanism for returning the intracellular environment to a homeostatic redox status, it is not surprising that genes in this pathway were extremely sensitive and responded to such low HOCl concentrations. Protein ubiquitination was also a sensitive pathway responding to low concentrations of HOCl. The proteasomal system, comprised of 20S and 26S proteasome is responsible for degradation of mildly oxidized proteins and thus represents another important cleanup mechanism against oxidative damage (Grune et al., 2003). Excessive oxidative stress can cause protein aggregation and cross-linking, making oxidized proteins more resistant to proteasomal proteolysis. Studies have suggested that 26S dependent proteolysis is very sensitive to and decreases in response to oxidative stress (Shringarpure et al., 2003; Breusing and Grune, 2008). Furthermore, 20S proteasome, which is ubiquitin-and ATP-independent, is likely responsible for degradation of oxidized proteins (Reinheckel et al., 2000; Davies, 2001). Contrary to these previous reports, our microarray data show numerous genes for 26S proteasome and ubiquitin peptidases were up-regulated at doses below 0.35 mM HOCl. These findings are supported by previous studies which showed that numerous subunits of 26s proteasome are induced by Nrf2-activators in an Nrf2-dependent manner (Kwak et al., 2003a; Kwak et al., 2003b). While this pathway was significantly enriched in our study, the magnitude of expression of proteasome-related genes was not sufficiently above 2-fold.
Activation of inflammatory cells is a common defense mechanism in response to exogenously derived oxidative stress. However, activation of the inflammatory response can itself serve as a source of oxidative stress. Signaling events that lead to activation of inflammation-related transcription factor NF-κB are known to be sensitive to redox status, as NF-κB is activated by H2O2 and other oxidants (Baeuerle and Henkel, 1994). In response to low concentrations of HOCl, microarray data revealed that inflammatory responses mediated by NF-κB, IL-10 and glucocorticoid pathways were induced and RT-PCR measurements showed that mRNA levels of several NF-kB-target cytokines, Il1b, 1l6, Infγ were elevated. Based on these data, maximal mRNA expression of these cytokines and enrichment of inflammatory pathways was observed at slightly lower concentrations than was observed for Nrf2-mediated antioxidant response. These results suggest that the attenuation of inflammatory mediators and inflammation-related pathways as HOCl concentrations increase may be related to the fact that ROS-scavenging antioxidants are maximally induced within this range of HOCl concentrations, resulting in more highly controlled intracellular ROS levels (Li et al., 2008). Proteomics studies investigating oxidative effects of diesel exhaust particles have also demonstrated that Nrf2-and NF-κB-related proteins and pro-inflammatory pathways are among few oxidant-dependent proteins that are responsive to low concentrations of diesel exhaust particles (Xiao et al., 2003).
A number of genes associated with cell cycle regulation and gene transcription were suppressed at concentrations as low as 0.35 mM HOCl. Many of these genes were histone deacetylases, which repress transcriptional activity by allowing DNA to maintain a tightly condensed structure that prevents binding of coactivators and transcription factors. Reduced expression of histone deacetylases was also confirmed by Gene Ontology, which revealed that maintenance of chromatin architecture, DNA packaging and negative regulation of DNA-dependent transcription were significantly down-regulated. Histone acetylation is an important mechanism for activation of NF-κB mediated pro-inflammatory response and reduced expression of histone deacetylases at low HOCl concentrations, which would facilitate NF-κB and other transcriptional factor-promoter binding, has been previously reported in studies investigating cellular response to oxidative stressors or pro-inflammatory agents (Rajendrasozhan et al., 2008).
Elevated concentrations of HOCl, which were not cytotoxic to cells resulted in a decline in Nrf2-mediated responses and a sharp increase in other secondary stress responses, including those associated with damage–inducible genes. Gene expression for some AP-1 family members showed opposing patterns of expression compared to Nrf2. cFos mRNA and protein expression exhibited a J-shaped dose-response which decreased in response to low or moderate levels of HOCl and increased in a switch-like manner at high concentrations of HOCl. The gene expression of Fra1 exhibited a similar pattern as cFos, peaking at 2.8 mM HOCl (data not shown). Both cFos and Fra1 have been previously identified as negative regulators of ARE-mediated Nqo1 expression (Venugopal and Jaiswal, 1996). Furthermore, protein levels of cJun in nuclear fractions followed a pattern of expression similar to cFos, with increased expression at 2.8 mM HOCl (data not shown). The role of AP-1 in oxidative stress response and its effect on Nrf2 activation is still unclear. The ARE consensus sequence contains a portion of the consensus AP-1 site followed by a GC box (Xie et al., 1995). There are many conflicting studies that report that cFos, cJun, small Mafs and other AP-1 proteins interact with Nrf2 at the ARE to promote transcriptional activation of Nrf2 target genes (Friling et al., 1992; Venugopal and Jaiswal, 1998; He et al., 2001), while other studies show that AP-1 family proteins negatively affect Nrf2’s transcriptional action at the ARE (Venugopal and Jaiswal, 1996; Dhakshinamoorthy and Jaiswal, 2000; Brown et al., 2008).
Our results also demonstrate that HOCl concentrations of 2.8-3.5 mM elicit a sharp increase in genes that potentially mark the presence of protein and DNA damage. Of the genes which were marked up-regulated in response to high HOCl concentrations, heat shock proteins, particularly Hspa1b, exhibited the most significant increase in expression. In addition to temperature sensitivity, heat shock proteins are often up-regulated in response to many different kinds of environmental stresses (Santoro, 2000). Elevated expression of various histone clusters was also observed following treatment with high concentrations of HOCl. A recent study investigating the extent to which HOCl causes protein damage, showed that even at low concentrations and short treatment times HOCl can damage histones in particular, through chlorination of up to 25% of tyrosine groups in histones (Kang and Neidigh, 2008).
Expression of Gadd45α, Gadd45β, Gadd45γ, and Ddit3, which are all DNA-damage inducible, p53 target genes was markedly up-regulated, but only at the highest HOCl concentration. In previous studies, induction of p53-target genes was a common response to various endogenous and exogenous stressors in Sod1 -/- or Gpx1 -/- mice (Han et al., 2008). Additionally, it has been shown that p53 suppresses Nrf2-mediated expression of antioxidant genes, an effect which may involve direct interaction of p53 at the ARE (Faraonio et al., 2006). Their findings offer another potential explanation for our experimental observations at high HOCl concentrations, where abrogation of Nrf2-related gene expression occurs. Consistent with previous studies (Shen et al., 2005; Faraonio et al., 2006), our study suggests that the mechanism by which Nrf2-mediated antioxidant defense does not continuously increase in response to increasing oxidative stress may be due to cross-talk with other inhibitory stress pathways like AP-1 and p53. Further investigation of promoter binding and nuclear accumulation is needed to determine if in fact these transcription factors play a role in abrogating Nrf2-mediated response to HOCl.
Our group recently published a multi-phase dose response model which describes the dose response behavior of an Nrf2-dependent gene regulatory network and intracellular electrophile levels as a function of extracellular electrophilic/oxidative stress (Zhang and Andersen, 2007). While the model may not accurately predict the dose-response behavior of Nrf2 and many target genes, the model’s characterization of intracellular electrophile dose-response—initially increasing almost linearly due to scavenging, followed by catastrophic rise at high concentrations of the stressor due to lack of adequate defense—offers a logical explanation for the dose-dependent pathway activation that is observed in this microarray study.
In summary, our findings reveal a dose-dependent transition in cellular response to HOCl starting with inflammation, proteasomal protein degradation and Nrf2-mediated adaptive response at low concentrations of HOCl, sustained induction of Nrf2-regulated antioxidant defense at moderate concentrations and induction of AP-1 mediated responses and protein-and DNA-damage inducible genes at higher concentrations. Induction of the latter two stress pathways may potentially be responsible for the termination of Nrf2-mediated pathways in response to high HOCl concentrations. Given what appears to be a coordinated dose-response behavior among various cellular pathways, it is likely that these pathways are interacting at multiple levels.
Supplementary Material
Acknowledgments
This research was supported in part by the American Chemistry Council’s Long Range Research Initiative and NIEHS-ONES-R01ES016005.
Footnotes
The content is solely the responsibility of the authors, and they have no conflicts of interest to disclose.
Publisher's Disclaimer: This is a PDF file of an unedited manuscript that has been accepted for publication. As a service to our customers we are providing this early version of the manuscript. The manuscript will undergo copyediting, typesetting, and review of the resulting proof before it is published in its final citable form. Please note that during the production process errors may be discovered which could affect the content, and all legal disclaimers that apply to the journal pertain.
References
- Babior BM. Phagocytes and oxidative stress. Am J Med. 2000;109:33–44. doi: 10.1016/s0002-9343(00)00481-2. [DOI] [PubMed] [Google Scholar]
- Baeuerle PA, Henkel T. Function and activation of NF-kappa B in the immune system. Annu Rev Immunol. 1994;12:141–179. doi: 10.1146/annurev.iy.12.040194.001041. [DOI] [PubMed] [Google Scholar]
- Barrow CS, Alarie Y, Warrick JC, Stock MF. Comparison of the sensory irritation response in mice to chlorine and hydrogen chloride. Arch Environ Health. 1977;32:68–76. doi: 10.1080/00039896.1977.10667258. [DOI] [PubMed] [Google Scholar]
- Benjamini Y, Hochberg Y. Controlling the False Discovery Rate - a Practical and Powerful Approach to Multiple Testing. Journal of the Royal Statistical Society Series B-Methodological. 1995;57:289–300. [Google Scholar]
- Breusing N, Grune T. Regulation of proteasome-mediated protein degradation during oxidative stress and aging. Biol Chem. 2008;389:203–209. doi: 10.1515/BC.2008.029. [DOI] [PubMed] [Google Scholar]
- Brown SL, Sekhar KR, Rachakonda G, Sasi S, Freeman ML. Activating transcription factor 3 is a novel repressor of the nuclear factor erythroid-derived 2-related factor 2 (Nrf2)-regulated stress pathway. Cancer Res. 2008;68:364–368. doi: 10.1158/0008-5472.CAN-07-2170. [DOI] [PubMed] [Google Scholar]
- Chan K, Kan YW. Nrf2 is essential for protection against acute pulmonary injury in mice. Proc Natl Acad Sci U S A. 1999;96:12731–12736. doi: 10.1073/pnas.96.22.12731. [DOI] [PMC free article] [PubMed] [Google Scholar]
- Cho HY, Jedlicka AE, Reddy SP, Kensler TW, Yamamoto M, Zhang LY, Kleeberger SR. Role of NRF2 in protection against hyperoxic lung injury in mice. Am J Respir Cell Mol Biol. 2002;26:175–182. doi: 10.1165/ajrcmb.26.2.4501. [DOI] [PubMed] [Google Scholar]
- Daugherty A, Dunn JL, Rateri DL, Heinecke JW. Myeloperoxidase, a catalyst for lipoprotein oxidation, is expressed in human atherosclerotic lesions. J Clin Invest. 1994;94:437–444. doi: 10.1172/JCI117342. [DOI] [PMC free article] [PubMed] [Google Scholar]
- Davies KJ. Degradation of oxidized proteins by the 20S proteasome. Biochimie. 2001;83:301–310. doi: 10.1016/s0300-9084(01)01250-0. [DOI] [PubMed] [Google Scholar]
- Dennis G, Jr, Sherman BT, Hosack DA, Yang J, Gao W, Lane HC, Lempicki RA. DAVID: Database for Annotation, Visualization, and Integrated Discovery. Genome Biol. 2003;4:P3. [PubMed] [Google Scholar]
- Dhakshinamoorthy S, Jaiswal AK. Small maf (MafG and MafK) proteins negatively regulate antioxidant response element-mediated expression and antioxidant induction of the NAD(P)H:Quinone oxidoreductase1 gene. J Biol Chem. 2000;275:40134–40141. doi: 10.1074/jbc.M003531200. [DOI] [PubMed] [Google Scholar]
- Eisen MB, Spellman PT, Brown PO, Botstein D. Cluster analysis and display of genome-wide expression patterns. Proc Natl Acad Sci U S A. 1998;95:14863–14868. doi: 10.1073/pnas.95.25.14863. [DOI] [PMC free article] [PubMed] [Google Scholar]
- Faraonio R, Vergara P, Di Marzo D, Pierantoni MG, Napolitano M, Russo T, Cimino F. p53 suppresses the Nrf2-dependent transcription of antioxidant response genes. J Biol Chem. 2006;281:39776–39784. doi: 10.1074/jbc.M605707200. [DOI] [PubMed] [Google Scholar]
- Friling RS, Bergelson S, Daniel V. Two adjacent AP-1-like binding sites form the electrophile-responsive element of the murine glutathione S-transferase Ya subunit gene. Proc Natl Acad Sci U S A. 1992;89:668–672. doi: 10.1073/pnas.89.2.668. [DOI] [PMC free article] [PubMed] [Google Scholar]
- Furtmuller PG, Obinger C, Hsuanyu Y, Dunford HB. Mechanism of reaction of myeloperoxidase with hydrogen peroxide and chloride ion. Eur J Biochem. 2000;267:5858–5864. doi: 10.1046/j.1432-1327.2000.01491.x. [DOI] [PubMed] [Google Scholar]
- Grune T, Merker K, Sandig G, Davies KJ. Selective degradation of oxidatively modified protein substrates by the proteasome. Biochem Biophys Res Commun. 2003;305:709–718. doi: 10.1016/s0006-291x(03)00809-x. [DOI] [PubMed] [Google Scholar]
- Han ES, Muller FL, Perez VI, Qi W, Liang H, Xi L, Fu C, Doyle E, Hickey M, Cornell J, Epstein CJ, Roberts LJ, Van Remmen H, Richardson A. The in vivo gene expression signature of oxidative stress. Physiol Genomics. 2008;34:112–126. doi: 10.1152/physiolgenomics.00239.2007. [DOI] [PMC free article] [PubMed] [Google Scholar]
- Hawkins CL, Pattison DI, Davies MJ. Hypochlorite-induced oxidation of amino acids, peptides and proteins. Amino Acids. 2003;25:259–274. doi: 10.1007/s00726-003-0016-x. [DOI] [PubMed] [Google Scholar]
- He CH, Gong P, Hu B, Stewart D, Choi ME, Choi AM, Alam J. Identification of activating transcription factor 4 (ATF4) as an Nrf2-interacting protein. Implication for heme oxygenase-1 gene regulation. J Biol Chem. 2001;276:20858–20865. doi: 10.1074/jbc.M101198200. [DOI] [PubMed] [Google Scholar]
- Irizarry RA, Hobbs B, Collin F, Beazer-Barclay YD, Antonellis KJ, Scherf U, Speed TP. Exploration, normalization, and summaries of high density oligonucleotide array probe level data. Biostatistics. 2003;4:249–264. doi: 10.1093/biostatistics/4.2.249. [DOI] [PubMed] [Google Scholar]
- Ishii T, Itoh K, Takahashi S, Sato H, Yanagawa T, Katoh Y, Bannai S, Yamamoto M. Transcription factor Nrf2 coordinately regulates a group of oxidative stress-inducible genes in macrophages. J Biol Chem. 2000;275:16023–16029. doi: 10.1074/jbc.275.21.16023. [DOI] [PubMed] [Google Scholar]
- Itoh K, Ishii T, Wakabayashi N, Yamamoto M. Regulatory mechanisms of cellular response to oxidative stress. Free Radic Res. 1999;31:319–324. doi: 10.1080/10715769900300881. [DOI] [PubMed] [Google Scholar]
- Kang JI, Jr, Neidigh JW. Hypochlorous acid damages histone proteins forming 3-chlorotyrosine and 3,5-dichlorotyrosine. Chem Res Toxicol. 2008;21:1028–1038. doi: 10.1021/tx7003486. [DOI] [PubMed] [Google Scholar]
- Kawai Y, Morinaga H, Kondo H, Miyoshi N, Nakamura Y, Uchida K, Osawa T. Endogenous formation of novel halogenated 2’-deoxycytidine. Hypohalous acid-mediated DNA modification at the site of inflammation. J Biol Chem. 2004;279:51241–51249. doi: 10.1074/jbc.M408210200. [DOI] [PubMed] [Google Scholar]
- Kensler TW, Wakabayashi N, Biswal S. Cell survival responses to environmental stresses via the Keap1-Nrf2-ARE pathway. Annu Rev Pharmacol Toxicol. 2007;47:89–116. doi: 10.1146/annurev.pharmtox.46.120604.141046. [DOI] [PubMed] [Google Scholar]
- Kobayashi M, Yamamoto M. Molecular mechanisms activating the Nrf2-Keap1 pathway of antioxidant gene regulation. Antioxid Redox Signal. 2005;7:385–394. doi: 10.1089/ars.2005.7.385. [DOI] [PubMed] [Google Scholar]
- Kwak MK, Wakabayashi N, Greenlaw JL, Yamamoto M, Kensler TW. Antioxidants enhance mammalian proteasome expression through the Keap1-Nrf2 signaling pathway. Mol Cell Biol. 2003a;23:8786–8794. doi: 10.1128/MCB.23.23.8786-8794.2003. [DOI] [PMC free article] [PubMed] [Google Scholar]
- Kwak MK, Wakabayashi N, Itoh K, Motohashi H, Yamamoto M, Kensler TW. Modulation of gene expression by cancer chemopreventive dithiolethiones through the Keap1-Nrf2 pathway. Identification of novel gene clusters for cell survival. J Biol Chem. 2003b;278:8135–8145. doi: 10.1074/jbc.M211898200. [DOI] [PubMed] [Google Scholar]
- Lee JM, Li J, Johnson DA, Stein TD, Kraft AD, Calkins MJ, Jakel RJ, Johnson JA. Nrf2, a multi-organ protector? FASEB J. 2005;19:1061–1066. doi: 10.1096/fj.04-2591hyp. [DOI] [PubMed] [Google Scholar]
- Lee JM, Moehlenkamp JD, Hanson JM, Johnson JA. Nrf2-dependent activation of the antioxidant responsive element by tert-butylhydroquinone is independent of oxidative stress in IMR-32 human neuroblastoma cells. Biochem Biophys Res Commun. 2001;280:286–292. doi: 10.1006/bbrc.2000.4106. [DOI] [PubMed] [Google Scholar]
- Li N, Nel AE. Role of the Nrf2-mediated signaling pathway as a negative regulator of inflammation: implications for the impact of particulate pollutants on asthma. Antioxid Redox Signal. 2006;8:88–98. doi: 10.1089/ars.2006.8.88. [DOI] [PubMed] [Google Scholar]
- Li W, Khor TO, Xu C, Shen G, Jeong WS, Yu S, Kong AN. Activation of Nrf2-antioxidant signaling attenuates NFkappaB-inflammatory response and elicits apoptosis. Biochem Pharmacol. 2008 doi: 10.1016/j.bcp.2008.07.017. [DOI] [PMC free article] [PubMed] [Google Scholar]
- Martin JG, Campbell HR, Iijima H, Gautrin D, Malo JL, Eidelman DH, Hamid Q, Maghni K. Chlorine-induced injury to the airways in mice. Am J Respir Crit Care Med. 2003;168:568–574. doi: 10.1164/rccm.200201-021OC. [DOI] [PubMed] [Google Scholar]
- Morris JC. Acid Ionization Constant of Hocl from 5 to 35 Degrees. J Phys Chem-Us. 1966;70:3798–&. [Google Scholar]
- Pi J, Bai Y, Reece JM, Williams J, Liu D, Freeman ML, Fahl WE, Shugar D, Liu J, Qu W, Collins S, Waalkes MP. Molecular mechanism of human Nrf2 activation and degradation: role of sequential phosphorylation by protein kinase CK2. Free Radic Biol Med. 2007;42:1797–1806. doi: 10.1016/j.freeradbiomed.2007.03.001. [DOI] [PMC free article] [PubMed] [Google Scholar]
- Pi J, Zhang Q, Woods CG, Wong V, Collins S, Andersen ME. Activation of Nrf2-mediated oxidative stress response in macrophages by hypochlorous acid. Toxicol Appl Pharmacol. 2008;226:236–243. doi: 10.1016/j.taap.2007.09.016. [DOI] [PubMed] [Google Scholar]
- Rajendrasozhan S, Yang SR, Edirisinghe I, Yao H, Adenuga D, Rahman I. Deacetylases and NF-kappaB in redox regulation of cigarette smoke-induced lung inflammation: epigenetics in pathogenesis of COPD. Antioxid Redox Signal. 2008;10:799–811. doi: 10.1089/ars.2007.1938. [DOI] [PMC free article] [PubMed] [Google Scholar]
- Reinheckel T, Ullrich O, Sitte N, Grune T. Differential impairment of 20S and 26S proteasome activities in human hematopoietic K562 cells during oxidative stress. Arch Biochem Biophys. 2000;377:65–68. doi: 10.1006/abbi.2000.1717. [DOI] [PubMed] [Google Scholar]
- Santoro MG. Heat shock factors and the control of the stress response. Biochem Pharmacol. 2000;59:55–63. doi: 10.1016/s0006-2952(99)00299-3. [DOI] [PubMed] [Google Scholar]
- Shen G, Jeong WS, Hu R, Kong AN. Regulation of Nrf2, NF-kappaB, and AP-1 signaling pathways by chemopreventive agents. Antioxid Redox Signal. 2005;7:1648–1663. doi: 10.1089/ars.2005.7.1648. [DOI] [PubMed] [Google Scholar]
- Shringarpure R, Grune T, Mehlhase J, Davies KJ. Ubiquitin conjugation is not required for the degradation of oxidized proteins by proteasome. J Biol Chem. 2003;278:311–318. doi: 10.1074/jbc.M206279200. [DOI] [PubMed] [Google Scholar]
- Venugopal R, Jaiswal AK. Nrf1 and Nrf2 positively and c-Fos and Fra1 negatively regulate the human antioxidant response element-mediated expression of NAD(P)H:quinone oxidoreductase1 gene. Proc Natl Acad Sci U S A. 1996;93:14960–14965. doi: 10.1073/pnas.93.25.14960. [DOI] [PMC free article] [PubMed] [Google Scholar]
- Venugopal R, Jaiswal AK. Nrf2 and Nrf1 in association with Jun proteins regulate antioxidant response element-mediated expression and coordinated induction of genes encoding detoxifying enzymes. Oncogene. 1998;17:3145–3156. doi: 10.1038/sj.onc.1202237. [DOI] [PubMed] [Google Scholar]
- Winder C. The toxicology of chlorine. Environ Res. 2001;85:105–114. doi: 10.1006/enrs.2000.4110. [DOI] [PubMed] [Google Scholar]
- Winterbourn CC, van den Berg JJ, Roitman E, Kuypers FA. Chlorohydrin formation from unsaturated fatty acids reacted with hypochlorous acid. Arch Biochem Biophys. 1992;296:547–555. doi: 10.1016/0003-9861(92)90609-z. [DOI] [PubMed] [Google Scholar]
- Xiao GG, Wang M, Li N, Loo JA, Nel AE. Use of proteomics to demonstrate a hierarchical oxidative stress response to diesel exhaust particle chemicals in a macrophage cell line. J Biol Chem. 2003;278:50781–50790. doi: 10.1074/jbc.M306423200. [DOI] [PubMed] [Google Scholar]
- Xie T, Belinsky M, Xu Y, Jaiswal AK. ARE-and TRE-mediated regulation of gene expression. Response to xenobiotics and antioxidants. J Biol Chem. 1995;270:6894–6900. doi: 10.1074/jbc.270.12.6894. [DOI] [PubMed] [Google Scholar]
- Yang L, Allen BC, Thomas RS. BMDExpress: a software tool for the benchmark dose analyses of genomic data. BMC Genomics. 2007;8:387. doi: 10.1186/1471-2164-8-387. [DOI] [PMC free article] [PubMed] [Google Scholar]
- Zhang Q, Andersen ME. Dose response relationship in anti-stress gene regulatory networks. PLoS Comput Biol. 2007;3:e24. doi: 10.1371/journal.pcbi.0030024. [DOI] [PMC free article] [PubMed] [Google Scholar]
- Zhang Q, Pi J, Woods CG, Jarabek AM, Clewell HJ, Andersen ME. Hormesis and adaptive cellular control systems. Dose Response. 2008;6:196–208. doi: 10.2203/dose-response.07-028.Zhang. [DOI] [PMC free article] [PubMed] [Google Scholar]
Associated Data
This section collects any data citations, data availability statements, or supplementary materials included in this article.