Abstract
The relationship between mean arterial blood pressure (MAP) and hematocrit (Hct) was studied in pre- and postmenopause women in the city of Durango, Mexico. Premenopause women show a negative trend between parameters that is not statistically significant. MAP and Hct are directly related in postmenopause women (p < 0.01). It is proposed that that this MAP/Hct relationship is in part due to differences in endothelial function where menopause decreases the capacity of the endothelium to respond to increased blood viscosity and shears stress, leading to the increased production of vasodilator mediators to compensate for changes in blood viscosity due to changes in Hct. Comparison with a large group of postmenopause women in the city of Stockholm showed identical trends.
Keywords: menopause, endothelial dysfunction, blood viscosity, blood pressure, hematocrit
Introduction
Postmenopausal women have an increased risk of cardiovascular disease in comparison to premenopausal women, which increases with age. This risk is associated with the incidence of hypertension, smoking, obesity, sedentary life style, dyslipidemia, stress, family history of cardiovascular disease, diabetes mellitus, insulin resistance, changes in body fat distribution from a gynoid to an android pattern, reduced glucose tolerance, abnormal plasma lipids, increased sympathetic tone, vascular inflammation, and endothelial dysfunction.1
Endothelial dysfunction is increasingly recognized as a condition that may underlie most metabolic and endocrine diseases that result in cardiovascular risks. Maturana and colleagues2 summarized the changes in endothelial function determined by the transition from pre- to postmenopause and discussed methods presently available for assessing endothelial function. These methods in general evaluate how the circulation responds to acute vasoactive stimuli mediated by endothelial mechanisms.3,4
A different approach for characterizing endothelial dysfunction consists in studying the population has analyzing parameters that are in part dependant on endothelial function. One of these associations is given by the relationship between mean arterial blood pressure (MAP) and blood viscosity or the related hematocrit (Hct).5
Blood viscosity and MAP are related by the interaction of two opposing mechanisms. Firstly, increasing Hct increases blood viscosity and peripheral vascular resistance, and therefore MAP. Secondly, increasing blood viscosity increases shear stress on the endothelium and therefore the production of endothelial nitric oxide (NO) causing vasodilatation.6 These two opposing effects lead to an autoregulatory mechanism that tends to maintain peripheral vascular resistance and therefore MAP stays constant in response to changes of blood shear stress, blood viscosity, and Hct.
Hematocrit and therefore blood viscosity present a natural variability in the population due to adaptations to altitude, genetics, diet, and level of exercise performed. However the relation between MAP and Hct in the healthy population (not afflicted by endothelia dysfunction) should be independent of Hct as a consequence of the above mentioned autoregulatory process, as well as additional blood pressure regulating mechanism. Maturana and colleagues2 summarized the changes in endothelial function determined by the transition from pre- to postmenopause, showing differences that could in principle lead to different relationships between MAP and Hct, which can also be due to the difference in hormonal conditions.
The present study analyzes the distribution of MAP and Hct in a population of pre- and postmenopause women from the city of Durango, Mexico (elevation 1,890 m), a population with similar ethnic characteristics and approximately uniform environmental and dietary features to determine if the relationship between MAP and Hct shows evidence of changes of the autoregulatory capacity of endothelial function in maintaining MAP independent of Hct in both groups. The availability of a large data pool from a population of postmenopausal women from the city of Stockholm, Sweden (sea level) also provided the opportunity to establish whether findings from the Mexican population were unique and due to local characteristics or could be attributed to a more general process associated with menopause and possibly endothelial dysfunction.
Methods
The study was carried out at the Institute for Research of the Universidad Juarez del Estado de Durango (UEJD). Individuals were entered following open invitations to non-hypertensive and nondiabetic women that visit the Institute to obtain their Papanicolaou test. The study was transversal and descriptive. Exclusion criteria were women during their menstrual period, smoking, the use of contraceptives, and any type of treatment including treatment for hypertension. Inclusion criteria were pre- and postmenopause women without age limitation. Women were determined to be in good health conditions on the basis of medical records and clinical investigation. Postmenopause women were not treated for hormonal therapy within at least three months prior to entering the study.
The protocol was approved by the UEJD Research Committee and informed consent was provided by each individual. The study was carried out according to laws and regulations of the General Health Law of Mexico. A written survey was carried out determine the level of sedentariness of the participants; individuals that did not perform at least 30 minutes of intense exercise five days per week were excluded.
Laboratory analysis included fasting glucose, urea, creatinine, and Hct. Blood samples (3 ml) were drawn in tubes without anticoagulants from the antecubital vein, 8 to 10 h after fasting and collected in EDTA anticoagulated tubes for Hct measurements. Hct was measured using a microhematocrit centrifuge (13,000 g for 3 min at 20 °C, Sol-Bat Centrifuge M-600, Readacrit L-10, Mexico).
Systolic and diastolic pressures were recorded and MAP was determined using the relationship:
Blood samples and MAP measurements were obtained at random times in between the menstrual periods.
The data was also analyzed by a method that (approximately) factors out the contribution of blood viscosity to peripheral vascular resistance,7 thus providing information on the relative state of constriction or relaxation of circulation, corresponding to the contribution of the anatomical component of vascular resistance in the configuration of total peripheral vascular resistance. This procedure consists in calculating a Hct-independent MAPi according to the algorithm:
| (1) |
where MAPm,i is the measured value, Hctaverage is the average for the sample population, and Hcti is the Hct associated with a given pressure measurement.
Statistical analysis
All parameters are reported as mean ± standard deviation (SD). Differences between groups were assessed using the paired Student t-test. A P value of <0.05 defined the level of statistical significance. Linear regression analysis was carried out using the Prizm program.
Results
Results are reported in Table 1. The only statistical difference between groups was MAP, which was significantly (P < 0.005) elevated in postmenopause women, but did not reach the level of hypertension.
Table 1.
Population features, blood chemistry, Hct and MAP of pre- and postmenopause women
| Premenopause | Postmenopause | |
|---|---|---|
| Number, n | 85 | 92 |
| Age, years | 39.2 ± 3.3 | 52.1 ± 7.2 |
| Hematocrit, % | 42.6 ± 2.4 | 42.9 ± 2.3 |
| Mean arterial blood pressure, mmHg | 85.6 ± 7.7 | 89.8 ± 11.0 |
| Weight, kg | 66.9 ± 10.3 | 67.7 ± 10.0 |
| BMI | 26.5 ± 3.9 | 27.6 ± 5.3 |
| Urea, mg/dl | 22.3 ± 2.5 | 23.1 ± 2.4 |
| Creatinine, mg/dl | 0.77 ± 0.10 | 0.75 ± 0.12 |
| Glucose, mg/dl | 90.5 ± 2.5 | 92.1 ± 9.0 |
Notes: *Statistically different between groups, p < 0.005.
Abbreviations: BMI, body mass index; Hct, hematocrit; MAP, mean arterial blood pressure.
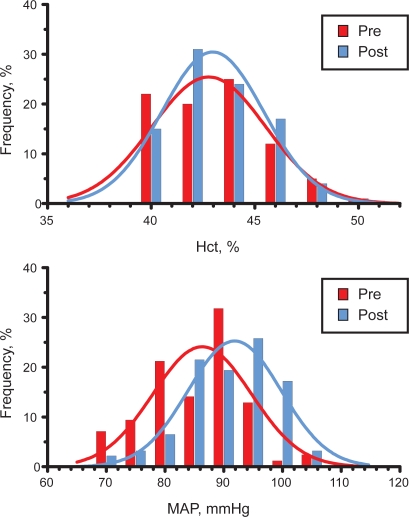
The statistical distribution of Hct in the two groups is shown in Figure 1, showing a lack of statistically significant difference.
Figure 1.
Distribution of hematocrit (Hct) and mean arterial blood pressure (MAP) in pre- and postmenopausal women in the city of Durango, Mexico. Both distributions are Gaussian.
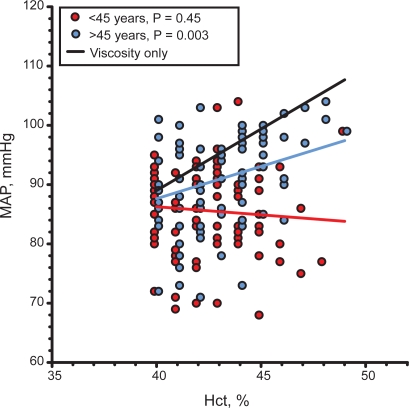
The relation between MAP and Hct was investigated by computing the linear dependence between these variables. MAP was linearly and significantly related to Hct with a positive slope m = 1.09 ± 0.35 mmHg/%, p < 0.01 in postmenopause women. The same analysis for premenopause women showed a negative correlation with a slope m = −0.27 ± 0.36 mmHg/%, p = 0.5 which was not statistically significant. However the difference between slopes was statistically significant, p < 0.01. This analysis is shown in Figure 2.
Figure 2.
Linear regression between MAP and Hct in pre- and postmenopause women in the city of Durango, Mexico. comparison with the relation between MAP and Hct if blood viscosity is the only determinant of peripheral vascular resistance.
Abbreviations: Hct, hematocrit; MAP, mean arterial blood pressure.
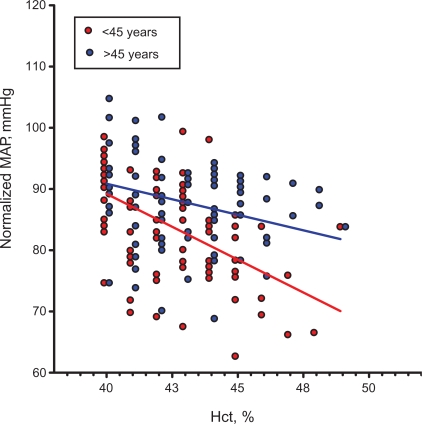
The relationship between MAP normalized relative to Hct and Hct had a negative slope for both pre- and postmenopause women (−2.14 ± 0.34 and −1.02 ± 0.34 mmHg/%, p < 0.005 for both cases, respectively). The difference between slopes was also significant (p < 0.02).
Discussion
The principal findings of this study are that pre- and post-menopause women did not present a significant difference in blood analysis, Hct and weight, with the exception of blood pressure which was significantly (p < 0.005) elevated in the postmenopause women. However, none of the postmenopausal women was diagnosed hypertensive and therefore received no antihypertensive treatment. As expected, Hct presented a variability in both populations, however the variability was identical, and the average Hct was not statically different between groups, a result supported by the findings of Clancy and colleagues.8 Notably, altitude did not appear to be a factor in determining the average or dispersion of Hct in the population studied since pre- and postmenopause in Durango (elevation 1,890 m) had Hct 42.6 ± 2.4% and 42.9 ± 2.3%, respectively while white women in a study by de Simone and colleagues,5 conducted in the city of New York, NY, aged 53.8 ± 12.1 had Hct 42 ± 3%. Similarly, body mass index was not different between these populations (p > 0.3, ns).
The distributions of Hct and MAP were Gaussian, allowing the calculation of the least square regression between parameters. The finding of the lack of positive correlation between MAP and Hct for premenopause women, and the tendency of the data to show a negative correlation is significant, since it suggests the operation of the previously discussed autoregulatory mechanism that renders MAP independent from the change in Hct and therefore presumably blood viscosity.
Figure 2 shows the change in blood pressure that would be present if the circulation responded passively to the changes of blood viscosity caused by changes in Hct. This calculation is made by assuming that the relation between Hct and blood viscosity in the range shown is linear, as shown by the findings of Kameneva and colleagues.9 The slope for this line is m = 2.08 mmHg/% being statistically different (p < 0.01) from the slope of the line relating MAP and Hct for postmenopause women.
The finding that the theoretical slope for the change in MAP due solely to the change in Hct is greater than that found in this study suggests that the impairment of endothelial function leading to the increased MAP in postmenopause women is not complete, and that in general a residual autoregulatory capacity remains.
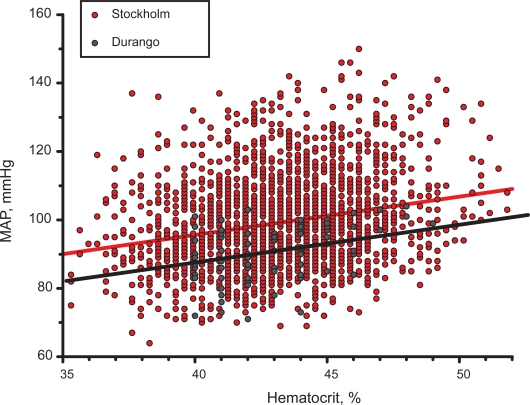
Information on the relationship between MAP and Hct is available from a study carried out in the city of Stockholm, Sweden in a population of n = 2,189 women aged >60 years. The results of this comparison shown in Figure 3 is solely presented to show that populations present identical trends in the relationship between MAP and Hct, a result suggested by clinical10 and experimental studies.6 Notably the slopes of the two regression lines are virtually identical since the relationship for the Stockholm population has slope m = 1.12 ± 0.09 vs m = 1.09 ± 0.35 mmHg/% for the population in Durango. Therefore a reduced capacity to regulate for the increase in Hct associated with menopause could be a characteristic for menopause. As expected, given the large number of subjects in the Stockholm group, the linear regression was significant (p < 0.0001). These findings may also indicate that age per se may be a factor in lowering the capacity for autoregulation of MAP vs Hct, due to factors other than endothelial dysfunction.
Figure 3.
Comparison of the trends for MAP vs Hct for women aged > 60 years in a study in the city of Stockholm (n = 2,189) and postmenopause women in the city of Durango (n = 92).
Abbreviations: Hct, hematocrit; MAP, mean arterial blood pressure.
It is generally assumed that elevated Hcts are associated with increased MAP, as shown by studies in chronic diseases such as hypertension and diabetes. However this does not necessarily obtain when changes in Hct are related to changes in peripheral vascular resistance, blood viscosity, and MAP as shown by de Simone and colleagues,11 who found that Hct and MAP were statistically significantly negatively correlated in American Indians. Salazar Vázquez and colleagues10 also showed that MAP and Hct have a “U” shaped relation in type 2 diabetics. Martini and colleagues6 analyzed in experimental animals the effect of small acute changes of Hct similar to does due to the natural variability in the human population and found a “U” shaped relation between Hct and MAP. Therefore in recent studies of various populations the increase in Hct is not uniformly associated with increased MAP, unless a threshold Hct is surmounted in which case red blood cell hemoglobin may become a sink for endothelium-derived NO.12 Furthermore, the tendency of a negative slope for the MAP vs Hct relationship found in this study may be a general feature in the healthy population.
Blood pressure regulation is also dependant on baroreceptor activity and metabolic factors. Therefore it should be expected that MAP and Hct are not related in the healthy population, however this tight regulation could be disrupted as a consequence of the significant endocrinologic changes that result from the transition to menopause as shown by the consistently observed related significant increase in MAP.
Factoring out the effect of blood viscosity shows that the anatomical contribution of peripheral vascular resistance tends to decrease with increasing Hct and presumably blood viscosity (Figure 4), the relationship being attenuated for post- relative to premenopause. The same negative correlation was found in the population of the Stockholm women, however the slope was significantly shallower, being −0.40 ± 0.08 mmHg/%, a finding that could be related to the greater age of this population. These findings support the contention that the endothelial vasodilator release is different in these populations, and that it tends to decrease with menopause and age although the evidence is not direct. This result also shows that while some of the MAP autoregulatory capacity is lost in postmenopause women, in healthy women the process is still effective since there is a significant tendency for MAP to lower as Hct increases.
Figure 4.
Mean arterial pressure as a function of hematocrit (Hct), and therefore blood viscosity, when the effect of hematocrit is factored out (normalized MAP according to equation ) Both trends are statistically significant (p< 0.05 for <45 years and >45 years) as well as the difference in trends (p < 0.02).
Abbreviation: MAP, mean arterial blood pressure.
Conclusions
This study shows that the healthy population of women presents a variability of Hct that is not significantly reflected in the variability of blood pressure, which should be expected if peripheral vascular resistance is passively influenced by blood viscosity. The decreased regulation of MAP versus the naturally occurring variability on Hct for postmenopause women found in two different populations and the strong similarity in the relationship between MAP and Hct suggest that this is a common feature to postmenopause. However, while this is a tendency in the population there are individuals that do not present increased blood pressure as a consequence of increased Hct. If we assume that that this tendency is related to a decreased autoregulatory capacity due to decreased response to shear stress by the endothelium, it may be possible to differentiate between the incidence or absence of endothelial dysfunction in the otherwise healthy population. Finally, this study does not show that there is a significant change in Hct between pre- and postmenopause healthy women.
Acknowledgments
This work was supported by grants from FOMIX M006-2007-1/CONACYT clave 66638 (México) and Bioengineering Research Partnership grant R24-HL64395 and USPHS grants R01-HL62354 and R01-HL62318 (US). The 60-year-old cohort study was supported by grants from the Stockholm County Council, the Swedish Research Council, the Swedish Heart and Lung Foundation and FAS. The authors thank Gunnel Gråbergs who processed the data from the 60-year-old cohorts before statistical analyses were undertaken. The authors report no conflicts of interest in this work.
References
- 1.Assmann G, et al. Coronary heart disease: reducing the risk: a worldwide view. International Task Force for the Prevention of Coronary Heart Disease. Circulation. 1999;100:1930–1938. doi: 10.1161/01.cir.100.18.1930. [DOI] [PubMed] [Google Scholar]
- 2.Maturana MA. Menopause, estrogens, and endothelial dysfunction: current concepts. Clinics. 2007;62:77–86. doi: 10.1590/s1807-59322007000100012. [DOI] [PubMed] [Google Scholar]
- 3.Clapauch R, et al. Use of vascular Doppler ultrasound to detect acute estradiol vascular effect in postmenopausal women. Clinics. 2007;62:673–678. doi: 10.1590/s1807-59322007000600003. [DOI] [PubMed] [Google Scholar]
- 4.Mercuro G. Impaired forearm blood flow and vasodilator reserve in healthy postmenopausal women. Am Heart J. 1999;137:692–697. doi: 10.1016/s0002-8703(99)70225-5. [DOI] [PubMed] [Google Scholar]
- 5.de Simone G. Relation of blood viscosity to demographic and physiologic variables and to cardiovascular risk factors in apparently normal adults. Circulation. 1990;81:107–117. doi: 10.1161/01.cir.81.1.107. [DOI] [PubMed] [Google Scholar]
- 6.Martini J. Paradoxical hypotension following increased hematocrit and blood viscosity. Am J Physiol Heart Circ Physiol. 2005;289:H2136–H2143. doi: 10.1152/ajpheart.00490.2005. [DOI] [PubMed] [Google Scholar]
- 7.Salazar Vázquez BY. Lowering of blood pressure by increasing hematocrit with non nitric oxide scavenging red blood cells. Am J Respir Cell Mol Biol. 2008;38:135–142. doi: 10.1165/rcmb.2007-0081OC. [DOI] [PMC free article] [PubMed] [Google Scholar]
- 8.Clancy KB. Menstruation does not cause anemia: endometrial thickness correlates positively with erythrocyte count and hemoglobin concentration in premenopausal women. Am J Hum Biol. 2006;18:710–713. doi: 10.1002/ajhb.20538. [DOI] [PubMed] [Google Scholar]
- 9.Kameneva MV. Gender difference in rheologic properties of blood and risk of cardiovascular diseases. Clin Hemorheol Microcirc. 1999;21:357–363. [PubMed] [Google Scholar]
- 10.Salazar–Vázquez BY. Blood pressure and hematocrit in diabetes and the role of endothelial responses in the variability of blood viscosity. Diabetes Care. 2006;29:1523–1528. doi: 10.2337/dc06-0323. [DOI] [PubMed] [Google Scholar]
- 11.de Simone G. Association of blood pressure with blood viscosity in American Indians. The strong heart study. Hypertension. 2005;45:625–630. doi: 10.1161/01.HYP.0000157526.07977.ec. [DOI] [PubMed] [Google Scholar]
- 12.Lancaster J., Jr The hemoglobin-nitric oxide axis: implications for transfusion therapeutics. Transfus Altern Transfus Med. 2008;9:273–280. [Google Scholar]


