Abstract
Background and purpose:
The voltage-gated Na+ channels (Nav) and their corresponding current (INa) are involved in several cellular processes, crucial to metastasis of cancer cells. We investigated the effects of eicosapentaenoic (EPA), an omega-3 polyunsaturated fatty acid, on INa and metastatic functions (cell proliferation, endocytosis and invasion) in human and rat prostate cancer cell lines (PC-3 and Mat-LyLu cells).
Experimental approach:
The whole-cell voltage clamp technique and conventional/quantitative real-time reverse transcriptase polymerase chain reaction analysis were used. The presence of Nav proteins was shown by immunohistochemical methods. Alterations in the fatty acid composition of phospholipids after treatment with EPA and metastatic functions were also examined.
Key results:
A transient inward Na+ current (INa), highly sensitive to tetrodotoxin, and NaV proteins were found in these cells. Expression of NaV1.6 and NaV1.7 transcripts (SCN8A and SCN9A) was predominant in PC-3 cells, while NaV1.7 transcript (SCN9A) was the major component in Mat-LyLu cells. Tetrodotoxin or synthetic small interfering RNA targeted for SCN8A and SCN9A inhibited metastatic functions (endocytosis and invasion), but failed to inhibit proliferation in PC-3 cells. Exposure to EPA produced a rapid and concentration-dependent suppression of INa. In cells chronically treated (up to 72h) with EPA, the EPA content of cell lipids increased time-dependently, while arachidonic acid content decreased. Treatment of PC-3 cells with EPA decreased levels of mRNA for SCN9A and SCN8A, cell proliferation, invasion and endocytosis.
Conclusion and implications:
Treatment with EPA inhibited INa directly and also indirectly, by down-regulation of Nav mRNA expression in prostate cancer cells, thus inhibiting their metastatic potential.
Keywords: voltage-gated sodium channels, prostate carcinoma cell, eicosapentaenoic acid, SCN9A, SCN8A, RT-PCR, invasion, endocytosis, proliferation
Introduction
The therapy of prostate cancer including the use of hormone-based drugs has progressed over recent years, but prostate cancer is still one of the leading causes of cancer deaths in the world. Therefore, new therapeutic strategies to prevent prostate cancer, to inhibit its progression and metastasis are needed. Epidemiological studies show clear geographical variations in the incidence of this disease (Parkin et al., 2005), with it being more common in the developed countries such as North America and Europe, compared with developing countries. And, within the developed countries, considerable differences of the mortality rates exist; North America and Europe have high mortality rates as compared with Japan and other Asian countries (Breslow et al., 1977). However, the frequency of latent prostate carcinoma diagnosed at autopsy is as common in Asian countries as in Western countries (Dunn, 1975). In addition, the consumption of a diet rich in fat tends to increase the risk of developing prostate carcinoma (Shennan and Bishop, 1974) and immigrants from Poland and Japan to the Western countries show a significant increase in the risk of developing prostate cancer (Haenszel and Kurihara, 1968; Armstrong and Doll, 1975). These findings implicate environmental factors, probably diet, as significant contributing factors enhancing oncogenesis and the growth and metastasis of prostate cancer. There is also growing evidence that omega-6 (ω-6) polyunsaturated fatty acids (PUFAs) promote prostate cancer growth, whereas ω-3 PUFA, from marine foods, are inhibitory (Rose, 1997; Larsson et al., 2004; Leitzmann et al., 2004), and high blood levels of ω-3 PUFA are associated with a reduced risk of prostate cancer (Chavarro et al., 2007). Thus, excessive amounts of ω-6 PUFAs and a higher ratio of ω-6/ω-3 PUFAs in prostate cells may contribute to an increased incidence of prostate cancer. Consequently, increasing dietary ω-3 PUFAs, such as eicosapentaenoic acid (EPA), and decreasing the ω-6/ω-3 ratios of prostate cells appears to be a feasible approach to reduce the risk and control growth of prostate cancer an of its metastasis, resulting in increased survival (Larsson et al., 2004; Kelavkar et al., 2006; Chavarro et al., 2007). However, the basic mechanisms underlying these protective effects of EPA remain undefined.
Ion channels play essential roles in cell function, that is, cell growth, metastasis and secretion in many types of cells, including cancer cells. EPA has been reported to modulate membrane-bound proteins such as ion channels, that is, voltage-gated Ca2+ channels (Xiao et al., 1997) and voltage-gated Na+ channels (Nav) (Xiao et al., 1995; 1998; Kang and Leaf, 1996; Jo et al., 2005). The binding sites of EPA on Nav have been proposed to be located on the cytoplasmic segment of the Na+ channel, in the α-subunit linking transmembrane repeats III and IV (Xiao et al., 2001). Thus, Nav appears to be an important target protein for EPA. A number of papers have reported that the up-regulation of the current (INa) carried by Nav channels is observed in malignant tumours of prostate, as compared with non-malignant tumours, and contributes to the progression and metastasis by enhancing a number of metastatic cell functions such as invasion, secretion and endocytosis (Grimes et al., 1995; Fraser et al., 2000; 2003; Anderson et al., 2003; Bennett et al., 2004; Krasowska et al., 2004; Brackenbury and Djamgoz, 2006). So far, 10 types of α-subunit in Na channels, referred to as SCN1A to SCN11A, have been identified (Goldin, 1999; 2002; nomenclature follows Alexander et al., 2008). The protein NaV1.7 encoded by the SCN9A gene has been reported to a major carrier of the functional INa expressed in prostate cancer cells (Diss et al., 2001; 2005). However, the effects of EPA on INa in prostate cancer cells have not been investigated.
To elucidate the protective effects of EPA on prostate cancer, the effects of EPA on INa were examined by the whole-cell patch-clamp technique and effects on the Nav transcripts by real-time reverse transcriptase polymerase chain reaction (RT-PCR) analysis, in human and rat prostate cancer cells (PC-3 and Mat-LyLu cell lines). The alterations in fatty acid composition of cellular phospholipids after treatment with EPA and functions of prostate cancer cells contributing to metastasis (proliferation, invasion and endocytosis) were also investigated.
Methods
Cell preparation
PC-3 human prostate epithelial tumour cell lines and Mat-LyLu rat epithelial tumour cell lines were obtained from JCRB cell bank (Osaka, Japan) and European Collection of Cell Cultures (ECACC, Wiltshire, UK) respectively. PC-3 cells were grown in Kaighn's modification of Ham's F12 medium (F12K) with 7% fetal bovine serum (FBS) in an atmosphere of 5% CO2 and 95% air at 37°C. Mat-LyLu cancer cells were cultured in RPMI 1640 medium containing 2 mmol·L−1 glutamine and 10% FBS. When cells became confluent, they were subcultured in the same medium. At confluence, the cells were passaged by using 0.05% trypsin in 0.02% EDTA. Medium was replaced twice weekly.
Solutions and drugs
The composition of the control extracellular Tyrode solution was as follows (in mmol·L−1): NaCl 136.5, KCl 5.4, CaCl2 1.8, MgCl2 0.53, glucose 5.5 and HEPES-NaOH buffer 5.5 (pH 7.4). To block K+ currents, the patch pipette contained (in mmol·L−1): CsCl 140, EGTA 10, MgCl2 2, Na2ATP 3, guanosine-5′-triphosphate (GTP, sodium salt, Sigma) 0.1 and HEPES-CsOH buffer 5 (pH 7.2). In addition, 4-aminopyridine (4-AP, 4 mmol·L−1), tetraethylammonium (2 mmol·L−1) and Ba2+ (1 mmol·L−1) were added to the control solution to block K+ current and record INa. Nifedipine, 4-AP, TEA, tetrodotoxin (TTX) and cis-5,8,11,14,17-eicosapentaenoic acid (EPA, Na salt) were obtained from Sigma Chemicals Co. EPA was dissolved in water just before use.
Recording technique and data analysis
Membrane currents were recorded with tight-seal whole-cell clamp techniques by using a patch-clamp amplifier (EPC-7, List Electronics, Darmstadt, Germany) (Hamill et al., 1981; Nakajima et al., 1999). The heat-polished patch electrode had tip resistance of 3–5 MΩ. All data were acquired, stored and analysed on Power Macintosh 7100/80 by using the PULSE + PULSEFIT software (HEKA Electronic) and Igor PRO (Wave Metrics, Lake Oswego, OR) as previously described (Terasawa et al., 2002). All experiments were performed at room temperature (20–25°C). The steady-state inactivation of INa was estimated by using double-pulse protocols. Conditioning voltage pulses (500 ms in duration) of various membrane potentials between −80 and +20 mV were applied from a holding potential of −80 mV. At 2 ms after the end of each conditioning pulse, a test pulse of +0 mV (300 ms in duration) was applied to elicit INa. The ratio of INa amplitudes, with and without conditioning pulses, was plotted against each conditioning voltage.
Analysis of fatty acid composition
PC-3 cells were incubated for 2.7–72 h in medium containing 30 µmol·L−1 EPA, and the medium was changed every other day. The cells were harvested by trypsinization, centrifuged at 2000×g for 15 min at 4°C, and then washed twice and resuspended at a cell density of 2 × 10⁷ cells·mL−1 in 20 mmol·L−1 phosphate buffer (pH 7.4) and then sonicated (10 watt for 2 min and then 40 watt for 30 s on ice). The lipids in the cell sonicate were analysed as described earlier (Asano et al., 1998). Briefly, lipids were extracted with chloroform–methanol solution (2:1, v·v−1) in the presence of butylated hydroxytoluene. Fatty acid composition of cell phospholipids was determined by gas chromatography after separation of phospholipid fraction by using aminopropyl-bonded phase columns.
RNA extraction, RT-PCR and real-time quantitative RT-PCR
Total cellular RNA was extracted by using ISOGEN (Nippon Gene, Tokyo, Japan). For RT-PCR, complementary DNA (cDNA) was synthesized from 1 µg of total RNA with reverse transcriptase with random primers (Toyobo, Osaka, Japan) as previously described (Jo et al., 2004). The reaction mixture was then subjected to PCR amplification with specific forward and reverse oligonucleotide primers for 35 cycles consisting of heat denaturation, annealing and extension. PCR products were size-fractionated on 2% agarose gels and visualized under UV light. Primers were chosen based on the sequence of human SCN1–6A and 8–9A and rat SCN1A–6A and 8–9A as shown in Table 1. Real-time quantitative RT-PCR was performed with the use of real-time Taq-Man technology and a sequence detector (ABI PRISM® 7000, Applied Biosystems, Foster City, CA, USA) (Jo et al., 2004). Gene-specific primers and Taq-Man probes were used to analyse transcript abundance. The 18S ribosomal RNA level was analysed as an internal control and used to normalize the values for transcript abundance of SCN family genes (SCN1–6A, 8A, 9A).
Table 1.
PCR primers used for amplification of voltage-gated Na+ channel genes and synthetic small interfering RNA (siRNA) for SCN8A and 9A
| Gene symbol (human/rat) | Channel | Size (bp) | Sequence (′5-′3) | ||
|---|---|---|---|---|---|
| hSCN1A (rSCN1A) | NaV1.1 | 298 (436) | sense | GAC AGC ATC AGG AGG AAA GG | (GCAAGCTGTCCGCTGGTAATATA) |
| antisense | TGG TCT GAC TCA GGT TGC TG | (AGTGATCGTGATATCAACCTGAAG) | |||
| hSCN2A (rSCN2A) | NaV1.2 | 194 (494) | sense | ATC CAG AGG GCT TAC AGA CG | (GCTGCAGCTCTCCATTCACACAC) |
| antisense | ATC ATA CGA GGG TGG AGA CG | (GGCTAAACAATACTGCAGGGAAAA) | |||
| hSCN3A (rSCN3A) | NaV1.3 | 354 (422) | sense | AAT TCT GTG GGG GCT CTA GG | (TATCCGTGTCAACTGGACTCTAAG) |
| antisense | AGC AGC AAG GTT GTC TGA GC | (GATTACTGGAGAAACTTGTGGACT) | |||
| hSCN4A (rSCN4A) | NaV1.4 | 502 (407) | sense | CAG GCA TCT TCA CAG CAG AG | (GCCTGCGCTCTCTGACTTG) |
| antisense | ACC ATG AGG AAG ACG GTG AG | (CCTGACATTGGTACCCGG) | |||
| hSCN5A (rSCN5A) | NaV1.5 | 618 (501) | sense | ACC ATC GTG AAC AAC AAG AGC C | (GCCTAGTCTGGAACTCCCTGGAC) |
| antisense | GGC AGC CAG CTT GAC AAT ACA C | (ACATCTCCAGAGAGCTACGGGACAC) | |||
| hSCN6A (rSCN6A) | NaX | 449 (692) | sense | AAG AGG TGT CTG GGC AGG AT | (AAAGGACCAAAGGTGTTCCATGATCTGATG) |
| antisense | GAC CAG CAT CTG TCC TGT TG | (CCGCTCATCCTTTCCCATCACTCTTTTCGT) | |||
| hSCN8A (rSCN8A) | NaV1.6 | 599 (401) | sense | GAG GTG AAG CCT CTG GAT GA | (TTCAATGCGGTTTCCATCCT) |
| antisense | CGG ATG GTC TTT CTC TGC TC | (GACTGCAGGCCATGGTTCA) | |||
| hSCN9A (rSCN9A) | NaV1.7 | 403 (402) | sense | GAG GCC TGT TTC ACA GAT GG | (TCAGCGTGCTTACAGACGGTA) |
| antisense | TGG GGC CAA GAT CTG AGT AG | (CTAATGGCTGTGCTGCCTTTG) | |||
| siRNA (human) | Sequence | ||||
| SCN8A_2 (82) | AACAACCAACTAATTGACTAA | ||||
| SCN8A_4 (84) | CCCAGTTCATTGAGTACTGTA | ||||
| SCN8A_6 (86) | CAGAGGGATACCAGTGTATGA | ||||
| SCN9A_1 (91) | TAGGCTAATGACCCAAGATTA | ||||
| SCN9A_4 (94) | CGGCAGCGGCTGAATATACAA | ||||
| control(non-silence) | AATTCTCCGAACGTGTCACGT | ||||
Immunocytochemistry
Immunocytochemical analyses were performed on the cells by using anti-PanNav (Alomone Labs, Jerusalem, Israel), a rabbit polyclonal antibody against a peptide conserved in all Nav isoforms, anti-NaV1.6 and anti-NaV1.7 (Alomone Labs, Jerusalem, Israel). The cells were cultured on Lab-Tek Chamber Slide Glass (Nalge Nunc International, Naperville, IL, USA), fixed with 2% paraformaldehyde in PBS for 30 min and then blocked for 10 min with 2% horse serum in PBS. The cells were incubated for 60 min with the primary antibodies diluted with 0.01% Triton X and 0.01% NaN3 in PBS. For negative controls, cells were treated without antibody. Alexa-Fluor-488-conjugated labelled donkey anti-rabbit IgG antibody (Molecular Probes, A21206) was used to visualize the channel expression. The cells were also stained with Hoechst 33 258 (Sigma Aldrich) to visualize nuclei. A confocal laser scanning microscope (Olympus FluoView FV300, Olympus Co., Tokyo, Japan) was used for observations.
Transfection of synthetic small interfering RNA (siRNA)
SCN8A and SCN9A siRNA and non-silencing (negative control) siRNAs, as described in Table 1, were purchased from Qiagen (Cambridge, MA, USA). They were transfected into PC-3 cells to a final concentration of 5 nmol·L−1, by using the HiPerFect Transfection Reagent (5 µL·mL−1 culture; Qiagen) according to the instructions of the manufacturer. Transfected cells were incubated for 48 h in an atmosphere of 5% CO2 and 95% air at 37°C before each experiment. Then, analysis of mRNA by using real-time RT-PCR and the functions of the cells were performed. Rhodamine-conjugated siRNA was used to confirm the transfection of siRNA by using Nikon ECLISE TE200-u.
Proliferation assay
Cell proliferation was assessed by the Cell Titer 96 Aqueous kit (Promega, Madison, WI, USA). The prostate cancer cells were plated in 96-well plates (Becton Dickinson Labware, Franklin Lakes, NJ, USA) at a density of 1 × 10⁴ cells per well. On the next day, experimental media with TTX, EPA or siRNA were added. The plates were then incubated for 24 or 48 h, after which the tetrazolium salt and dye solution was added and colour development was allowed to proceed for 1 h at 37°C, 5% CO2. Each plate was then read at an absorbance of 490 nm.
Invasion assay
Matrigel invasion chambers were prepared according to the manufacturer's instructions (Becton Dickinson Labware, MA) by coating Matrigel on the 8 µm pore membrane of the culture inserts for 24-well plates (Falcon). A 0.5 mL aliquot of PC-3 cell suspension at 1 × 10⁵ cells·mL−1 treated with or without siRNA for 48 h was seeded on the upper chamber and incubated at 37°C in a humidified chamber. Seven per cent FBS with or without TTX and EPA was added to the upper compartment. After migration for 24 h at 37°C, cells were removed from the upper compartment. The number of invasive PC-3 cells on the lower surface of the filter membrane was determined by Diff Quik staining (Siemens, IL) and counted at a magnification of ×100. The percentage invasion was calculated as the ratio of the number of invasive cells in the presence of TTX, EPA or siRNA, relative to that in the absence of the drug.
Endocytosis assay
PC-3 cells were placed in Eppendorf tubes at a density of 1 × 10⁵ cells per tube in Tyrode solution and left to equilibrate for 10–15 min. The solution was then replaced by 100 µL of Tyrode solution containing 0.5 mg·mL−1 horseradish peroxidase (HRP) type IV (Sigma-Aldrich). The cells were incubated in an atmosphere of 5% CO2 and 95% air at 37°C for 60 min with and without TTX, EPA or siRNA as previously described (Onganer and Djamgoz, 2005). A background, which indicates endogenous peroxidase activity, was measured with normal Tyrode solution. After the incubation, the cells were rinsed three times to remove all extracellular HRP. In order to release the HRP contents of the cells, 120 µL of lysis buffer (made by serially adding 0.9 g NaCl, 10 mL 10% NP-40 and 2.5 mL 10% Na-deoxycholate to a solution of 0.79 g Tris base in 75 mL distilled water and adding 1 mL of 100 mmol·L−1 EDTA and completing the volume to 100 mL with distilled water) was added to the cell pellet. Immediately afterwards, diaminobenzidine (0.5 mg·mL−1) and hydrogen peroxide (0.01%) in 120 µL of 1 mol·L−1 Tris buffer (pH 7.4) were added, and the reaction solutions were transferred to a 96-well plate. The density of the colour reaction was measured at 570 nm on a plate reader (Bio-Rad Laboratories Inc, Helcules, CA, USA), and the absorbance was taken to represent the endocytotic activity.
Data analysis
All values are expressed as means ± SEM. Student's paired t-test was used to compare two sets of data from the same subjects. Comparison of time courses of parameters was analysed by one-way anova for repeated measures. When differences were indicated, a Bonferroni's comparison was used to determine significance. Differences were considered significant if P < 0.05.
Results
EPA inhibits Na+ current in prostate cancer cells
Figure 1A,B show INa in prostate cancer cells. The cells were held at −80mV, and the command voltage pulses (50 ms in duration) were applied to +0 mV. A fast transient inward current could be elicited in both human PC-3 cancer cells (Figure 1A) and Mat-LyLu rat cancer cells (Figure 1B). TTX (1 µmol·L−1, Figure 1A,B) or replacement of extracellular Na+ with N-methyl-D-glucamine (NMDG; Figure 1C), an impermeable cation, completely abolished INa, indicating that the transient inward current was carried by TTX-sensitive Na+ channels (Nav), as previously reported for these prostate cancer cell lines (Grimes et al., 1995; Laniado et al., 1997; Fraser et al., 2003; Brackenbury and Djamgoz, 2006).
Figure 1.
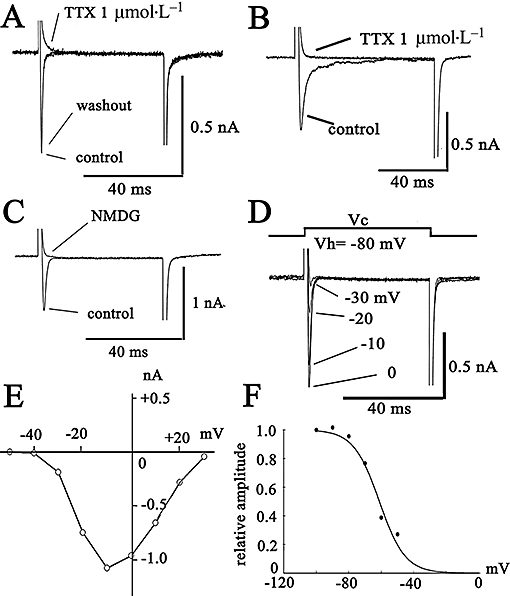
Characteristics of the Na current (INa) expressed in prostate cancer cells [human prostate cancer cell line (PC-3) and Mat-LyLu rat prostate cancer cell lines]. The cells were held at −80 mV, and command voltage pulses to +0 mV were applied in PC-3 (A) and Mat-LyLu cells (B and C). (C) Effects of replacement of extracellular Na+ with NMDG+. The current traces in B and C were elicited from a holding potential of −80 mV to +0 mV. In Mat-LyLu cells, the original current traces elicited by depolarizing pulses are indicated in D. The current–voltage (I–V) relations measured at the peak are illustrated in E. The I–V relations are shown after the leakage currents were subtracted. (F) Steady-state inactivation curves for INa expressed in Mat-LyLu cells. The data obtained from four cells were fitted by a Bolzmann equation. NMDG, N-methyl-D-glucamine; TTX, tetrodotoxin.
The typical current data recorded at each membrane potential and current–voltage (I–V) relations measured at the peak of the inward current are shown for Mat-LyLu cells (Figure 1D,E). At potentials more positive than −40 mV, INa was elicited (Figure 1A). The peak amplitude of the inward current was observed at approximately −10 mV. Figure 1F shows the steady-state inactivation curve for INa. The relation between membrane potentials and the h∞ value (Figure 1F) was fitted to the following equation (Boltzmann equation) by using the least-squares methods: I(V)/Imax = 1/{1 + exp[(V − Vh)k−1]}, where V is the membrane potential in mV, Vh is the membrane potential at half maximum, and k is the slope factor. The value of Vh and k was −61 ± 6 mV and 7.9 ± 4 mV (n = 4) respectively.
The effects of TTX on INa in Mat-LyLu cells are shown in Figure 2A,B. The cells were held at −80 mV, and the command pulses to +0 mV (50 ms in duration) were applied at 0.1 Hz. Inhibition by TTX was concentration-dependent with an IC50 value of 7.0 nmol·L−1 (n = 5). Extracellular application of EPA (30 µmol·L−1) also rapidly inhibited INa, and this inhibition attained a steady-state level within 2–3 min (Figure 2C). After washing with albumin (0.1%), INa gradually returned to the control level (Figure 2C). These effects of EPA were concentration-dependent (3–30 µmol·L−1; Figure 2D) and yielded an IC50 of approximately 6 µmol·L−1 (n = 5, Figure 2E).
Figure 2.
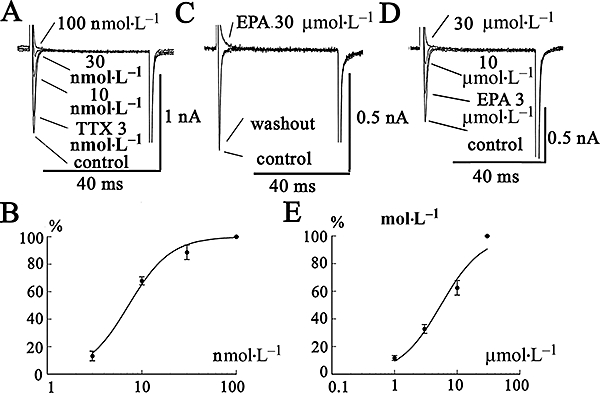
Effects of TTX and EPA on INa expressed in Mat-LyLu cells. (A) Concentration-dependent inhibition of INa by TTX. The cells were held at −80 mV, and command voltage-pulses to +0 mV (50 ms in duration) were applied at 0.2 Hz. (B) The inhibitory effect of TTX on the current amplitude measured at the peak is plotted against various concentrations of TTX. Data are shown as means ± SEM (n = 5) and fitted to a Michaelis-Menten simple bimolecular model: %inhibition = 100/{1 + (IC50[TTX]−1)}, where IC50 is 50% inhibitory concentration for TTX. The data yielded an IC50 value of 7.0 nmol·L−1. (C) Effects of EPA on INa. The cell was held at −80 mV, and a depolarizing pulse to +0 mV was applied. After washing out with 0.1% albumin, the depressed INa returned to a control level. (D & E) Concentration-dependent inhibition of INa by EPA. The data represent a typical recording obtained from five different cells. The inhibitory effect of EPA on the current amplitude measured at the peak is plotted against various concentrations of EPA. Data are shown as means ± SEM (n = 5) and fitted using a Hill equation: % inhibition = 100/{1 + (IC50[EPA]−1)n}, where n represents Hill coefficient, and IC50 is 50% inhibitory concentration for EPA. The data yielded an IC50 value of 6 µmol·L−1 and n of 1.1. EPA, eicosapentaenoic acid; INa, Na+ current; TTX, tetrodotoxin.
Expression of mRNA for voltage-gated Na channels in PC-3 cells
The results described above show that a TTX-sensitive Nav is functional in prostate cancer cells. Therefore, we investigated the expression of mRNA for members of the SCN channel family (SCN1A–9A) in Mat-LyLu cells (Figure 3A) and PC-3 cells (Figure 4A). We did not assay for SCN7A, because SCN6A and 7A are probably encoded by the same gene or for SCN10A or 11A, as INa carried by these channels is TTX-insensitive (Catterall, 1992). The transcripts of SCN1A, 2A, 6A, 8A and 9A were detected in Mat-LyLu cells (Figure 3A). In PC-3 cells, transcripts of SCN8A and 9A were clearly detected (Figure 4A), and transcripts of SCN2A and 5A were only weakly expressed. The transcripts of SCN1A, 4A and 6A were not detected. The size of SCN cDNA fragments were as predicted, identical to cDNA fragments amplified from reversely transcribed mRNA.
Figure 3.
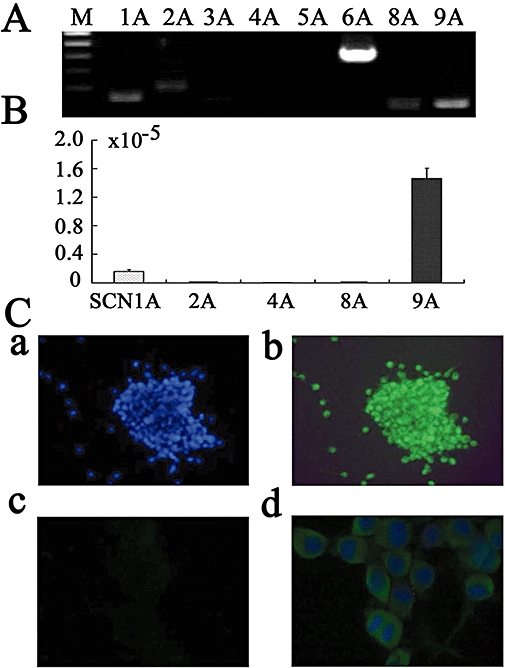
Voltage-gated Na+ channel proteins in Mat-LyLu rat prostate cancer cell lines. (A) Expression of genes for voltage-gated Na+ channels, detected by reverse transcriptase polymerase chain reaction (RT-PCR) in Mat-LyLu cells. M, Marker. (B) Summary results of real-time quantitative RT-PCR. The expression levels of SCN channel genes were normalized to those of the 18S ribosomal RNA levels. Data are means ± SEM from six independent samples. (C) Immunocytochemical detection with PanNaV in Mat-LyLu cells. Staining with Hoechst 33258 to visualize nuclei (Ca), PanNaV (Cb), negative control (without antibody, Cc), double staining with Hoechst 33258 and PanNaV (Cd).
Figure 4.
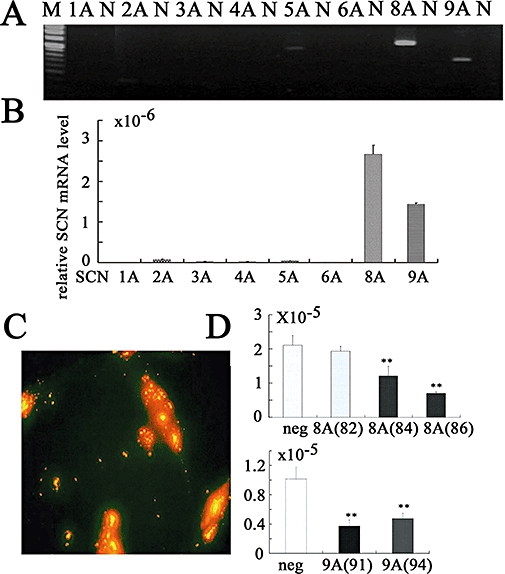
Expression of voltage-gated Na+ channel genes detected by reverse transcriptase polymerase chain reaction (RT-PCR) in human prostate cancer cell line (PC-3). (A) Results of RT-PCR. M, Marker; N, negative control. (B) Real-time quantitative RT-PCR. The expression levels of SCN channel genes were normalized to those of the 18S ribosomal RNA levels. Summary data are means ± SEM from six independent samples. (C) Transfection of synthetic small interfering RNA (siRNA) for SCN8A mRNA. The transfected siRNA conjugated with rhodamine was visualized under fluorescent microscopy. (D) Expression level of SCN8A and SCN9A mRNA in PC-3 cells transfected with various kinds of siRNA by using real-time quantitative RT-PCR. The numbers in parentheses refer to the different sequences as shown in Table 1 (lower half). **P < 0.01 vs. negative control.
Expression of SCN channel family members (SCN1A–9A) was also investigated by real-time quantitative RT-PCR in Mat-LyLu cells (Figure 3B) and PC-3 cells (Figure 4B). Transcript levels were normalized to 18S ribosomal housekeeping gene. As SCN6A has not been shown to form a functional Na+ channel (Ogata and Ohishi, 2002), SCN9A appeared to encode for the TTX-sensitive, Nav in Mat-LyLu cells. On the other hand, in PC-3 cells, expression levels of SCN8A and SCN9A mRNA were much higher than those of SCN2A and 5A, suggesting that SCN8A and SCN9A encode for TTX-sensitive Nav in PC-3 cells.
Immunocytochemical detection of PanNaV
Expression of Nav protein was confirmed by immunostaining cultured cells, by using anti-PanNav in Mat-LyLu cells (Figure 3Cb), which was consistent with the patch-clamp experiments. No expression of PanNav was detected in negative controls without the antibody (Figure 3Cc). The cells were also counterstained with Hoechst 33 258 to visualize nuclei (Figure 3Ca), and the double staining with this dye and PanNav is shown in Figure 3Cd. Similarly, expression of Nav proteins, by using anti-NaV1.6 (Figure 5A), anti-NaV1.7 (Figure 5B) and anti-PanNaV (Figure 5C) antibodies, was confirmed in PC cells. No expression of PanNav was detected in negative controls without the antibody (Figure 5d). These results were consistent with the results of the RT-PCR studies.
Figure 5.
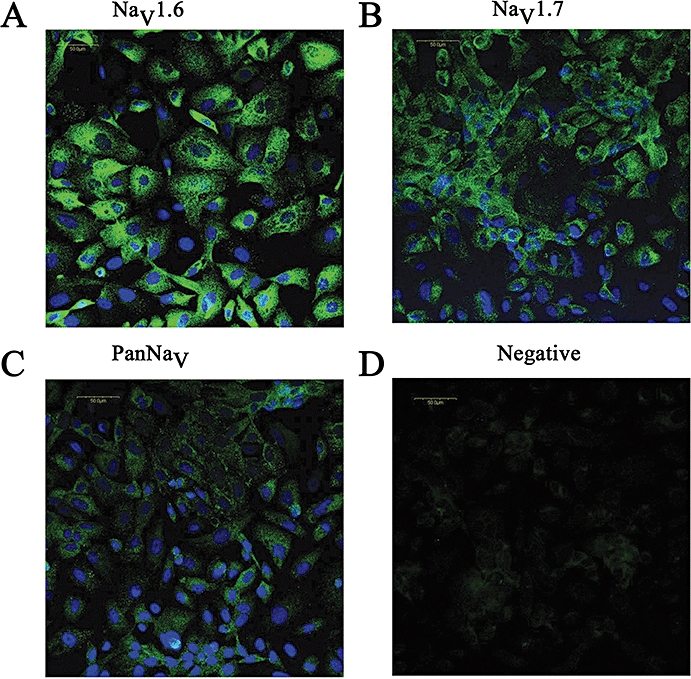
Immunocytochemical detection of NaV1.6, NaV1.7 and PanNaV in PC-3 cells. In A, double staining with Hoechst 33 258 and antibody to NaV1.6. In B, staining with NaV1.7 and in C with PanNaV antibodies is shown. Negative control (without antibody, D).
Effect of siRNA for SCN8A and SCN9A on the expression of voltage-gated Na+ channels
To inhibit the expression of SCN8A and SCN9A, we used siRNA methods. Transfection of siRNA conjugated with rhodamine was confirmed by fluorescent microscopy (Figure 4C). Two days after siRNA treatment, the inhibitory effect on the expression of SCN mRNA was analysed by real-time RT-PCR. The expression level of SCN8A and SCN9A mRNA in PC-3 cells was significantly inhibited by the corresponding siRNA, compared with non-silencing (negative control) siRNA, as shown in Figure 4D. The most effective inhibition of mRNA for SCN8A was with the SCN8A (86) structure (Figure 4D, P < 0.001, n = 4), and the most effective siRNA for SCN9A was SCN9A (91) (see Table 1 for structures; Figure 4D, P < 0.001, n = 4). As 48 h treatment was sufficient to reduce the expression level, we used the cells 48 h after the transfection to investigate the effect of siRNA for SCN8A (86) and SCN9A (91) in the subsequent experiments.
Effects of long-term treatment with EPA on fatty acid compositions of PC cells and mRNA levels of the Na+ channel
Figure 6A shows the changes in fatty acid composition of phospholipids after treatment with EPA [C20:5 (ω-3)] for 2.7–72 h. The EPA, docosapentaenoic acid [DPA, C22:5 (ω-3)] and docosahexaenoic acid [DHA, C22:6 (ω-3)] content of the phospholipids increased in a time-dependent manner. On the other hand, arachidonic acid [AA, C20:4 (ω-6)] decreased time-dependently. Thus, the ratio of EPA to AA increased from 0.1 to 1.3 (24 h) and then 3.2 (72 h). The ratio of ω-3 to ω-6 also increased significantly.
Figure 6.
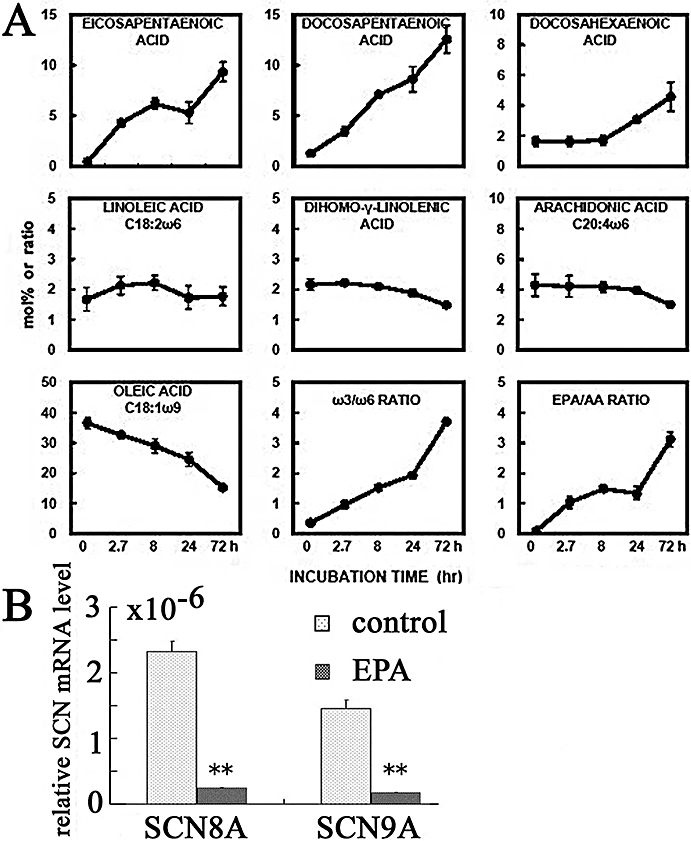
Effects of long-term exposure to EPA on fatty acid compositions of PC-3 cells and mRNA levels of the Na+ channel proteins, in PC-3 cells. (A) Changes in fatty acid compositions of phospholipids in control cells and cells treated with EPA. The cells were treated with EPA (30 µmol·L−1) for 2.7–72 h. The changes of fatty acid composition in phospholipids (mol%) are indicated. The data represent means ± SEM value obtained from two different cells. (B) Effects of chronic treatment with EPA on the expression of SCN8A and 9A mRNA in PC-3 cells. SCN9A expression was assessed by real-time quantitative RT-PCR, and transcript levels were normalized to 18S ribosomal housekeeping gene. EPA (30 µmol·L−1) was added to the cells before they reached confluence in culture medium for 48 h. After incubation for 48 h in culture medium supplemented with 7% FBS, expression of mRNA for SCN8A and SCN9A in the presence of EPA was compared with that in the absence of EPA. **P < 0.01 vs. control. EPA, eicosapentaenoic acid; FBS, fetal bovine serum; RT-PCR, reverse transcriptase polymerase chain reaction.
Figure 6B shows the effects of 48 h treatment with EPA on the expression of SCN8A and 9A mRNA by real-time quantitative RT-PCR in PC-3 cells. The transcript levels were normalized to 18S ribosomal housekeeping gene. EPA (30 (M) was added to the cells before they reached confluence in culture medium supplemented with 7% FBS for 48 h. Treatment with EPA for 48 h significantly inhibited the expression of both SCN8A and SCN9A mRNA. Thus, these results suggested that longer exposures (48–72 h) to EPA decreased the level of the mRNA for Na channels carrying INa, after the EPA was incorporated into the cell lipids.
Effects of EPA on cell migration and proliferation
In order to determine the roles of Na+ channels on cell migration and proliferation, PC-3 cells were treated with either TTX or siRNA. The cells transfected with siRNA for SCN9A (91) and/or SCN8A (86) were compared with the cells transfected with non-silencing (negative control) siRNA. TTX (10 µmol·L−1, Figure 7A) significantly inhibited cell migration (n = 6, P < 0.05). In addition, siRNA for SCN9A inhibited cell migration (n = 6, P < 0.05), but a combination of siRNA for SCN8A and for SCN9A provided greater inhibition (Figure 7B). As shown in Figure 7C,D, EPA (30 µmol·L−1) also significantly inhibited cell migration (n = 6, P < 0.05) in a similar way to TTX (10 µmol·L−1).
Figure 7.
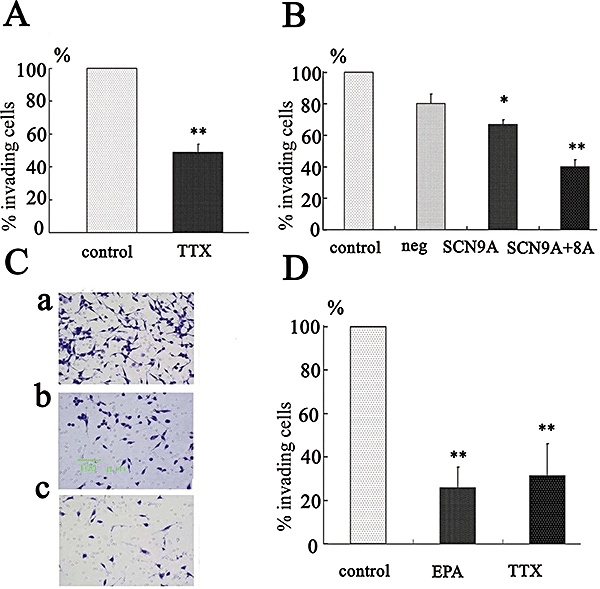
Effects of treatment with TTX, siRNA targeted for SCN8A or SCN9A and EPA on cell invasion in PC-3 cells. (A) Effects of TTX (10 µmol·L−1) on cell invasion. (B) Effects of siRNA for SCN9A alone and in combination with siRNA for SCN8A on cell invasion. (C & D) Effects of EPA and TTX on invasion assay. In C, photographs showing typical fields of view of PC-3 cells following invasion through the Matrigel-coated chamber under control conditions (a), and in the presence of TTX (10 µmol·L−1, b), and EPA (30 µmol·L−1, c). In D, summary data from these assays (means ± SEM from six different experiments). *P < 0.05, **P < 0.01 vs. control. EPA, eicosapentaenoic acid; siRNA, synthetic small interfering RNA; TTX, tetrodotoxin.
Effects of TTX and the combination of siRNA targeted for SCN8A and SCN9A, on cell proliferation were investigated in PC-3 cells. Neither TTX (10 µmol·L−1) nor siRNA had effect on cell proliferation at 24 and 48 h (Figure 8A,B, n = 6). However, EPA (30 µmol·L−1) markedly inhibited cell proliferation, in contrast to TTX (Figure 8C).
Figure 8.
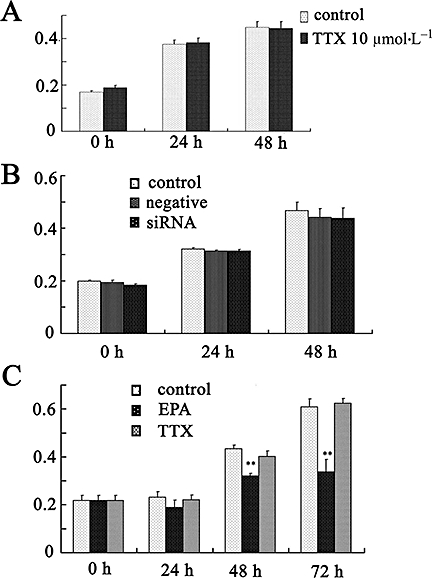
Effects of TTX, siRNA targeted for SCN8A and SCN9A and EPA on cell proliferation in PC-3 cells. (A) Effects of TTX on cell proliferation, assessed after cells were treated with TTX (10 µmol·L−1) for 0, 24 and 48 h. (B) Effect of combined SCN8A and SCN9A siRNA on cell proliferation. Cells were transfected with siRNA targeted for both SCN8A (86) and SCN9A (91), or with non-silencing (negative control) siRNA. (C) Effects of EPA on cell proliferation after exposure to EPA (30 µmol·L−1) for up to 72 h. **P < 0.01 vs. 0 h EPA, eicosapentaenoic acid; siRNA, synthetic small interfering RNA; TTX, tetrodotoxin.
Effects of EPA on endocytosis in PC-3 cells
Effects of TTX and siRNA targeted for both SCN8A and SCN9A on cell endocytosis were examined in PC-3 cells, by using HRP uptake. As shown in Figure 9A,B, TTX (1–10 µmol·L−1, n = 7, Figure 9A) and the siRNA (Figure 9B) significantly reduced HRP uptake into PC-3 cells (P < 0.01, n = 7), suggesting that INa is necessary for endocytosis in PC-3 cells. Also, EPA significantly inhibited HRP uptake into the cells in a concentration-dependent manner (n = 7; Figure 9C).
Figure 9.
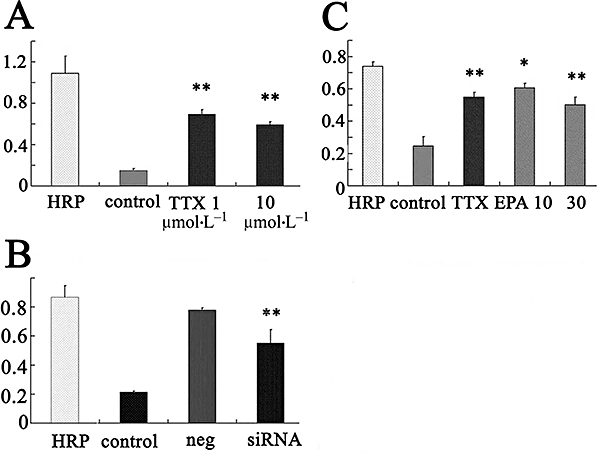
Effects of treatment with TTX (A), siRNA for SCN8A and SCN9A (B) and EPA (C) on endocytosis of HRP in PC-3 cells. Background (control) indicates endogenous peroxidase activity. *P < 0.05, **P < 0.01. EPA, eicosapentaenoic acid; HRP, horseradish peroxidase; siRNA, synthetic small interfering RNA; TTX, tetrodotoxin.
Discussion
The major findings of the present study were twofold. Firstly, EPA inhibited voltage-gated Na+ current (INa) in prostate cancer cells via two independent mechanisms: by directly affecting the channel and rapidly inhibiting INa with an IC50 of approximately 6 µmol·L−1 or indirectly by decreasing the level of the mRNAs for channel proteins (SCA8A and SCN9A), carrying INa, after incorporation of EPA into cell lipids. Secondly, EPA, TTX and siRNA targeted for Na channel α-subunits inhibited metastatic functions (invasion and endocytosis) of the two cell lines. These results suggest that EPA could inhibit metastatic activity by blocking the up-regulated INa in prostate cancer cells. Such blockade may reduce the risk of prostate carcinoma and its progression, and consequently increase survival.
The present study shows the presence of INa in prostate cancer cells (Mat-LyLu rat prostate cancer cell lines and PC-3 human prostate cancer cell lines), which was consistent with previous papers (Grimes et al., 1995; Fraser et al., 2000; 2003; Anderson et al., 2003; Bennett et al., 2004; Krasowska et al., 2004; Brackenbury and Djamgoz, 2006). TTX completely inhibited INa expressed in both cancer cell lines and, in Mat-LyLu cells, TTX had an IC50 value of approximately 7 nmol·L−1. These findings indicate that INa expressed in these prostate cancer cells closely resembles TTX-sensitive INa found in human brain and skeletal muscle, but is different from the TTX-insensitive INa found in heart. By using molecular techniques, it appears that human breast cancer cells express a TTX-insensitive Na+ channel subunit, SCN5A, while prostate cancer cells express a TTX-sensitive protein, SCN9A (Diss et al., 2001; 2005). In primary cultures of human cervical cancer, TTX-sensitive INa has been reported to be carried by a number of channels, NaV1.2, NaV1.4, NaV1.6 and NaV1.7 (Diaz et al., 2007). In the present studies, the transcript of NaV1.1, NaV1.2, NaV1.6 and NaV1.7 was detected in Mat-LyLu cells, as previously reported (Diss et al., 2001; 2005). However, in PC-3 cells, the predominant expression was of NaV1.6 and NaV1.7, and there was more of SCN8A, compared with SCN9A. The presence of these Na channels was confirmed by immunohistochemical studies in these prostate cancer cells. Thus, the expression of SCN8A and SCN9A genes appears to yield TTX-sensitive INa in PC-3 cells.
The present study showed for the first time that EPA inhibited INa in prostate cancer cells. The inhibitory effect of EPA was observed at concentrations greater than 0.1 µmol·L−1, and the IC50 of EPA was approximately 6 µmol·L−1. As the plasma concentration of free EPA measured by gas chromatography was about 1–6 µmol·L−1 and can be increased after ingestion of cod liver oil or after treatment with EPA-ester (Okuda et al., 1997), the inhibitory action of EPA on INa may play a crucial role in clinical settings. Several possible mechanisms to explain the effects of EPA on INa can be proposed. But, as shown previously (Jo et al., 2005), neither indomethacin, a cyclo-oxygenase inhibitor, nor NDGA, a lipoxygenase inhibitor, prevented the effects of EPA on INa (data not shown) suggesting that the metabolites of these pathways are not involved in this action of EPA. Alternatively, EPA has been reported to inhibit ICa.L in smooth muscle cells and cardiac myocytes (Xiao et al., 1997). Thus, it is more likely that EPA modulates INa by an interaction with the channel protein itself or by acting at lipid sites near the channels, after partition into the lipid bilayer. The binding sites of EPA have been proposed to be on the short cytoplasmic segment of the α-subunit of Na channels, linking transmembrane repeats III and IV in cardiac myocytes (Kang and Leaf, 1996). The IC50 value of EPA on cardiac cells is approximately 4 µmol·L−1, which is close to that in the present study using prostate cancer cells. We also reported that INa expressed in cultured human bronchial smooth muscle cells is carried by NaV1.7 coded by SCN9A mRNA and inhibited by EPA (Jo et al., 2004; 2005). Thus, whether EPA inhibits INa in prostate cancer cells by binding the sites similar to those in NaV1.5 (Kang and Leaf, 1996) remains unclear, but INa appears to be an important target for EPA in prostate cancer cells.
Besides the acute effect of EPA, this fatty acid is incorporated into membrane phospholipids and consequently affects various membrane functions and gene expression (Asano et al., 1998). Examples of this latter effect include prevention of the up-regulation of mRNA induced by mexiletine, an anti-arrythmic agent (Kang et al., 1997) in ventricular cells with EPA (20 µmol·L−1) for 4 days although the basal level of mRNA for SCN5A was not altered. More recently, EPA inhibited SCN9A expression in cultured human bronchial smooth muscle cells (Jo et al., 2005) and a ω-3 PUFA, DHA, inhibited SCN5A mRNA expression and INa in human breast cancer cells, where NaV1.5 was predominant (Isbilen et al., 2006). In our study, after chronic treatment with EPA, the EPA content of the phospholipid fraction (mol%) increased time-dependently, and that of AA decreased, increasing the ratio of EPA to AA. In our present work, EPA significantly decreased the level of both SCN8A and SCN9A mRNA in PC-3 prostate cancer cells, suggesting that EPA regulates the transcription of mRNA or its processing and stability of mRNA. Thus, it is likely that EPA may suppress the up-regulation of INa genes, by inhibiting transcription of the relevant genes in prostate cancer cells.
Na+ current is up-regulated in several types of cancer cells, including prostate cancer, and is known to enhance other cellular functions linked to invasion, secretion, adhesion and motility (Grimes et al., 1995; Laniado et al., 1997; Smith et al., 1998; Abdul and Hoosein, 2001; Anderson et al., 2003; Fraser et al., 2003; Mycielska et al., 2003; Bennett et al., 2004; Onganer and Djamgoz, 2005; Slade et al., 2005; Fulgenzi et al., 2006). The present study showed that INa was involved in cell invasion and endocytosis but not proliferation, in PC-3 cells. TTX and siRNA targeted for SCN9A or SCN8A significantly inhibited cell invasion. Interestingly, inhibition by a combination of siRNA for SCN9A and for SCN8A, was greater than that after either siRNA alone, suggesting that both subunits were contributing the INa observed. Similarly, endocytosis measured by uptake of HRP was significantly inhibited by TTX or siRNA for Nav proteins. In the present study, we also showed that EPA significantly inhibited cell invasion and endocytosis, through a ‘chronic’ effect on gene expression, as well as by a direct inhibition of the Na channel. The precise mechanism through which INa could regulate cellular functions is not known yet, but several possibilities can be considered. Particularly, Na+ influx through INa may regulate cell volume (Bortner and Cidlowski, 2003), and changes in ion flux and cell volume may be integral to the invasion process (Soroceanu et al., 1999). In turn, the subcellular/molecular mechanisms underlying these effects may involve the cytoskeleton (directly via β-subunit interaction and/or indirectly via local Ca2+ fluxes), protein kinase activity and gene expression (Fraser et al., 2003; Mycielska and Djamgoz, 2004). In contrast to the effects of TTX and siRNA on cell invasion and endocytosis, cell proliferation of prostate cancer cells was not affected by TTX and siRNA, suggesting that the contribution of INa to proliferation of cancer cells was minimal, a result compatible with previous work (Fraser et al., 1999; Fulgenzi et al., 2006). Nevertheless, EPA did significantly suppress cell proliferation, as well as invasion and endocytosis. Thus, EPA appears to inhibit cell growth, independent of INa blockade, possibly by modulating AA metabolism and/or Pertussis toxin-sensitive signal transduction pathways (Sauer et al., 2005). Thus, it is likely that the suppressive effects of EPA on several functions that are crucial to metastasis, such as proliferation, motility, secretion and invasion may be involved in the inhibitory effects of EPA on the metastatic activities of prostate cancer cells.
In conclusion, the present study suggests that treatment with EPA induces direct acute inhibition of INa and long-term down-regulation of expression of Na channel proteins, up-regulated in prostate cancer cells, thus inhibiting their metastatic activities. INa would appear to be one of the targets of EPA for long-term control and suppression of prostate cancer cells.
Acknowledgments
This study was supported by The Vehicle Racing Commemorative Foundation, and grants-in-aid from the Ministry of Education, Science and Culture, the Ministry of Health and Welfare of Japan to T Nakajima.
Glossary
Abbreviations:
- EPA
eicosapentaenoic acid
- FBS
fetal bovine serum
- INa
Na+ current
- Nav
voltage-gated Na+ channel
- NMDG
N-methyl-D-glucamine
- PUFA
polyunsaturated fatty acid
- RT-PCR
reverse transcriptase polymerase chain reaction
- siRNA
synthetic small interfering RNA
- TTX
tetrodotoxin
Conflict of interests
None.
References
- Abdul M, Hoosein N. Inhibition by anticonvulsants of prostate-specific antigen and interleukin-6 secretion by human prostate cancer cells. Anticancer Res. 2001;21:2045–2048. [PubMed] [Google Scholar]
- Alexander SPH, Mathie A, Peters JA. Guide to Receptors and Channels (GRAC) Br J Pharmacol. (3rd edn.) 2008;153(Suppl.)(2):S1–S209. doi: 10.1038/sj.bjp.0707746. [DOI] [PMC free article] [PubMed] [Google Scholar]
- Anderson JD, Hansen TP, Lenkowski PW, Walls AM, Choudhury IM, Schenck HA, et al. Voltage-gated sodium channel blockers as cytostatic inhibitors of the androgen-independent prostate cancer cell line PC-3. Mol Cancer Ther. 2003;2:1149–1154. [PubMed] [Google Scholar]
- Armstrong B, Doll R. Environmental factors and cancer incidence and mortality in different countries, with special reference to dietary practices. Int J Cancer. 1975;15:617–631. doi: 10.1002/ijc.2910150411. [DOI] [PubMed] [Google Scholar]
- Asano M, Nakajima T, Hazama H, Iwasawa K, Tomaru T, Omata M, et al. Influence of cellular incorporation of n-3 eicosapentaenoic acid on intracellular Ca2+ concentration and membrane potential in vascular smooth muscle cells. Atherosclerosis. 1998;138:2722–2728. doi: 10.1016/s0021-9150(98)00010-0. [DOI] [PubMed] [Google Scholar]
- Bennett ES, Smith BA, Harper JM. Voltage-gated Na+ channels confer invasive properties on human prostate cancer cells. Pflugers Arch. 2004;447:908–914. doi: 10.1007/s00424-003-1205-x. [DOI] [PubMed] [Google Scholar]
- Bortner CD, Cidlowski JA. Uncoupling cell shrinkage from apoptosis reveals that Na+ influx is required for volume loss during programmed cell death. J Biol Chem. 2003;278:39176–39184. doi: 10.1074/jbc.M303516200. [DOI] [PubMed] [Google Scholar]
- Brackenbury WJ, Djamgoz MB. Activity-dependent regulation of voltage-gated Na+ channel expression in Mat-LyLu rat prostate cancer cell line. J Physiol. 2006;573:343–356. doi: 10.1113/jphysiol.2006.106906. [DOI] [PMC free article] [PubMed] [Google Scholar]
- Breslow N, Chan CW, Dhom G, Drury RA, Franks LM, Gellei B, et al. Latent carcinoma of prostate at autopsy in seven areas. The International Agency for Research on Cancer, Lyons, France. Int J Cancer. 1977;20:680–688. doi: 10.1002/ijc.2910200506. [DOI] [PubMed] [Google Scholar]
- Catterall WA. Cellular and molecular biology of voltage-gated sodium channels. Physiol Rev. 1992;72:S15–S48. doi: 10.1152/physrev.1992.72.suppl_4.S15. [DOI] [PubMed] [Google Scholar]
- Chavarro JE, Stampfer MJ, Li H, Campos H, Kurth T, Ma J. A prospective study of polyunsaturated fatty acid levels in blood and prostate cancer risk. Cancer Epidemiol Biomarkers Prev. 2007;16:1364–1370. doi: 10.1158/1055-9965.EPI-06-1033. [DOI] [PubMed] [Google Scholar]
- Diaz D, Delgadillo DM, Hernández-Gallegos E, Ramírez-Domínguez ME, Hinojosa LM, Ortiz CS, et al. Functional expression of voltage-gated sodium channels in primary cultures of human cervical cancer. J Cell Physiol. 2007;210:469–478. doi: 10.1002/jcp.20871. [DOI] [PubMed] [Google Scholar]
- Diss JK, Archer SN, Hirano J, Fraser SP, Djamgoz MB. Expression profiles of voltage-gated Na+ channel alpha-subunit genes in rat and human prostate cancer cell lines. Prostate. 2001;48:165–178. doi: 10.1002/pros.1095. [DOI] [PubMed] [Google Scholar]
- Diss JK, Stewart D, Pani F, Foster CS, Walker MM, Patel A, et al. A potential novel marker for human prostate cancer: voltage-gated sodium channel expression in vivo. Prostate Cancer Prostatic Dis. 2005;8:266–273. doi: 10.1038/sj.pcan.4500796. [DOI] [PubMed] [Google Scholar]
- Dunn JE. Cancer epidemiology in populations of the United States – with emphasis on Hawaii and California – and Japan. Cancer Res. 1975;35:3240–3245. [PubMed] [Google Scholar]
- Fraser SP, Ding Y, Liu A, Foster CS, Djamgoz MB. Tetrodotoxin suppresses morphological enhancement of the metastatic MAT-LyLu rat prostate cancer cell line. Cell Tissue Res. 1999;295:505–512. doi: 10.1007/s004410051256. [DOI] [PubMed] [Google Scholar]
- Fraser SP, Grimes JA, Djamgoz MB. Effects of voltage-gated ion channel modulators on rat prostatic cancer cell proliferation: comparison of strongly and weakly metastatic cell lines. Prostate. 2000;44:61–76. doi: 10.1002/1097-0045(20000615)44:1<61::aid-pros9>3.0.co;2-3. [DOI] [PubMed] [Google Scholar]
- Fraser SP, Salvador V, Manning EA, Mizal J, Altun S, Raza M, et al. Contribution of functional voltage-gated Na+ channel expression to cell behaviors involved in the metastatic cascade in rat prostate cancer: I. Lateral motility. J Cell Physiol. 2003;195:479–487. doi: 10.1002/jcp.10312. [DOI] [PubMed] [Google Scholar]
- Fulgenzi G, Graciotti L, Faronato M, Soldovieri MV, Miceli F, Amoroso S, et al. Human neoplastic mesothelial cells express voltage-gated sodium channels involved in cell motility. Int J Biochem Cell Biol. 2006;38:1146–1159. doi: 10.1016/j.biocel.2005.12.003. [DOI] [PubMed] [Google Scholar]
- Goldin AL. Diversity of mammalian voltage-gated sodium channels. Ann NY Acad Sci. 1999;868:38–58. doi: 10.1111/j.1749-6632.1999.tb11272.x. [DOI] [PubMed] [Google Scholar]
- Goldin AL. Evolution of voltage-gated Na+ channels. J Exp Biol. 2002;205:575–584. doi: 10.1242/jeb.205.5.575. [DOI] [PubMed] [Google Scholar]
- Grimes JA, Fraser SP, Stephens GJ, Downing JE, Laniado ME, Foster CS, et al. Differential expression of voltage-activated Na+ currents in two prostatic tumor cell lines: contribution to invasiveness in vitro. FEBS Lett. 1995;369:290–294. doi: 10.1016/0014-5793(95)00772-2. [DOI] [PubMed] [Google Scholar]
- Haenszel W, Kurihara M. Studies of Japanese migrants. I. Mortality from cancer and other diseases among Japanese in the United States. J Natl Cancer Inst. 1968;40:43–68. [PubMed] [Google Scholar]
- Hamill P, Marty A, Neher E, Sakmann B, Sigworth FJ. Improved patch-clamp techniques for high-resolution current recording from cells and cell-free membrane patches. Pflugers Arch. 1981;391:85–100. doi: 10.1007/BF00656997. [DOI] [PubMed] [Google Scholar]
- Isbilen B, Fraser SP, Djamgoz MB. Docosahexaenoic acid (omega-3) blocks voltage-gated sodium channel activity and migration of MDA-MB-231 human breast cancer cells. Int J Biochem Cell Biol. 2006;38:2173–2182. doi: 10.1016/j.biocel.2006.06.014. [DOI] [PubMed] [Google Scholar]
- Jo T, Nagata T, Iida H, Imuta H, Iwasawa K, Ma J, et al. Voltage-gated sodium channel expressed in cultured human smooth muscle cells: Involvement of SCN9A. FEBS Lett. 2004;567:339–343. doi: 10.1016/j.febslet.2004.04.092. [DOI] [PubMed] [Google Scholar]
- Jo T, Iida H, Kishida S, Imuta H, Oonuma H, Nagata T, et al. Acute and chronic effects of eicosapentaenoic acid on voltage-gated sodium channel expressed in cultured human bronchial smooth muscle cells. Biochem Biophys Res Commun. 2005;331:1452–1459. doi: 10.1016/j.bbrc.2005.04.062. [DOI] [PubMed] [Google Scholar]
- Kang JX, Leaf A. Evidence that free polyunsaturated fatty acids modify Na+ channels by directly binding to the channel proteins. Proc Natl Acad Sci USA. 1996;93:3542–3546. doi: 10.1073/pnas.93.8.3542. [DOI] [PMC free article] [PubMed] [Google Scholar]
- Kang JX, Li Y, Leaf A. Regulation of sodium channel gene expression by class I antiarrhythmic drugs and n-3 polyunsaturated fatty acids in cultured neonatal rat cardiac myocytes. Proc Natl Acad Sci USA. 1997;94:2724–2728. doi: 10.1073/pnas.94.6.2724. [DOI] [PMC free article] [PubMed] [Google Scholar]
- Kelavkar UP, Hutzley J, Dhir R, Kim P, Allen KG, McHugh K. Prostate tumor growth and recurrence can be modulated by the omega-6:omega-3 ratio in diet: Athymic mouse xenograft model simulating radical prostatectomy. Neoplasia. 2006;8:112–124. doi: 10.1593/neo.05637. [DOI] [PMC free article] [PubMed] [Google Scholar]
- Krasowska M, Grzywna ZJ, Mycielska ME, Djamgoz MB. Patterning of endocytic vesicles and its control by voltage-gated Na+ channel activity in rat prostate cancer cells: fractal analyses. Eur Biophys J. 2004;33:535–542. doi: 10.1007/s00249-004-0394-3. [DOI] [PubMed] [Google Scholar]
- Laniado ME, Lalani EN, Fraser SP, Grimes JA, Bhangal G, Djamgoz MB, et al. Expression and functional analysis of voltage-activated Na+ channels in human prostate cancer cell lines and their contribution to invasion in vitro. Am J Pathol. 1997;150:1213–1221. [PMC free article] [PubMed] [Google Scholar]
- Larsson SC, Kumlin M, Ingelman-Sundberg M, Wolk A. Dietary long-chain n-3 fatty acids for the prevention of cancer: a review of potential mechanisms. Am J Clin Nutr. 2004;79:935–945. doi: 10.1093/ajcn/79.6.935. [DOI] [PubMed] [Google Scholar]
- Leitzmann MF, Stampfer MJ, Michaud DS, Augustsson K, Colditz GC, Willett WC, et al. Dietary intake of n-3 and n-6 fatty acids and the risk of prostate cancer. Am J Clin Nutr. 2004;80:204–216. doi: 10.1093/ajcn/80.1.204. [DOI] [PubMed] [Google Scholar]
- Mycielska ME, Djamgoz MB. Cellular mechanisms of direct-current electric field effects: galvanotaxis and metastatic disease. J Cell Sci. 2004;117:1631–1639. doi: 10.1242/jcs.01125. [DOI] [PubMed] [Google Scholar]
- Mycielska ME, Fraser SP, Szatkowski M, Djamgoz MB. Contribution of functional voltage-gated Na+ channel expression to cell behaviors involved in the metastatic cascade in rat prostate cancer: II. Secretory membrane activity. J Cell Physiol. 2003;195:461–469. doi: 10.1002/jcp.10265. [DOI] [PubMed] [Google Scholar]
- Nakajima T, Iwasawa K, Oonuma H, Imuta H, Hazama H, Asano M, et al. Troglitazone inhibits voltage-dependent calcium currents in guinea pig cardiac myocytes. Circulation. 1999;99:2942–2950. doi: 10.1161/01.cir.99.22.2942. [DOI] [PubMed] [Google Scholar]
- Ogata N, Ohishi Y. Molecular diversity and function of the voltage-gated Na+ channels. Jpn J Pharmacol. 2002;88:365–377. doi: 10.1254/jjp.88.365. [DOI] [PubMed] [Google Scholar]
- Okuda Y, Kawashima K, Sawada T, Tsurumaru K, Asano M, Suzuki S, et al. Eicosapentaenoic acid enhances nitric oxide production by cultured human endothelial cells. Biochem Biophys Res Commun. 1997;232:487–491. doi: 10.1006/bbrc.1997.6328. [DOI] [PubMed] [Google Scholar]
- Onganer PU, Djamgoz MB. Small-cell lung cancer (human): potentiation of endocytic membrane activity by voltage-gated Na+ channel expression in vitro. J Membr Biol. 2005;204:67–75. doi: 10.1007/s00232-005-0747-6. [DOI] [PubMed] [Google Scholar]
- Parkin DM, Bray F, Ferlay J, Pisani P. Global cancer statistics, 2002. CA Cancer J Clin. 2005;55:74–108. doi: 10.3322/canjclin.55.2.74. [DOI] [PubMed] [Google Scholar]
- Rose DP. Effects of dietary fatty acids on breast and prostate cancers: evidence from in vitro experiments and animal studies. Am J Clin Nutr. 1997;66:1513S–1522S. doi: 10.1093/ajcn/66.6.1513S. [DOI] [PubMed] [Google Scholar]
- Sauer LA, Dauchy RT, Blask DE, Krause JA, Davidson LK, Dauchy EM. Eicosapentaenoic acid suppresses cell proliferation in MCF-7 human breast cancer xenografts in nude rats via a pertussis toxin-sensitive signal transduction pathway. J Nutr. 2005;135:2124–2129. doi: 10.1093/jn/135.9.2124. [DOI] [PubMed] [Google Scholar]
- Shennan DH, Bishop OS. Diet and mortality from malignant disease in 32 countries. West Indian Med J. 1974;23:44–53. [PubMed] [Google Scholar]
- Slade MJ, Tolhurst R, Palmieri C, Jiang J, Latchman DS, Coombes RC, et al. Voltage-gated sodium channel expression and potentiation of human breast cancer metastasis. Clin Cancer Res. 2005;11:5381–5389. doi: 10.1158/1078-0432.CCR-05-0327. [DOI] [PubMed] [Google Scholar]
- Smith P, Rhodes NP, Shortland AP, Fraser SP, Djamgoz MB, Ke Y, et al. Sodium channel protein expression enhances the invasiveness of rat and human prostate cancer cells. FEBS Lett. 1998;423:19–24. doi: 10.1016/s0014-5793(98)00050-7. [DOI] [PubMed] [Google Scholar]
- Soroceanu L, Manning TJ, Jr, Sontheimer H. Modulation of glioma cell migration and invasion using Cl- and K+ ion channel blockers. J Neurosci. 1999;19:5942–5954. doi: 10.1523/JNEUROSCI.19-14-05942.1999. [DOI] [PMC free article] [PubMed] [Google Scholar]
- Terasawa K, Nakajima T, Iida H, Iwasawa K, Oonuma H, Jo T, et al. Nonselective cation currents regulate membrane potential of rabbit coronary arterial cell: modulation by lysophosphatidylcholine. Circulation. 2002;106:3111–3119. doi: 10.1161/01.cir.0000039345.00481.1d. [DOI] [PubMed] [Google Scholar]
- Xiao YF, Kang JX, Morgan JP, Leaf A. Blocking effects of polyunsaturated fatty acids on Na+ channels of neonatal rat ventricular myocytes. Proc Natl Acad Sci USA. 1995;92:11000–11004. doi: 10.1073/pnas.92.24.11000. [DOI] [PMC free article] [PubMed] [Google Scholar]
- Xiao YF, Gomez AM, Morgan JP, Lederer WJ, Leaf A. Suppression of voltage-gated L-type Ca2+ currents by polyunsaturated fatty acids in adult and neonatal rat ventricular myocytes. Proc Natl Acad Sci USA. 1997;94:4182–4187. doi: 10.1073/pnas.94.8.4182. [DOI] [PMC free article] [PubMed] [Google Scholar]
- Xiao YF, Wright SN, Wang GK, Morgan JP, Leaf A. Fatty acids suppress voltage-gated Na+ currents in HEK293t cells transfected with the alpha-subunit of the human cardiac Na+ channel. Proc Natl Acad Sci USA. 1998;95:2680–2685. doi: 10.1073/pnas.95.5.2680. [DOI] [PMC free article] [PubMed] [Google Scholar]
- Xiao YF, Ke Q, Wang SY, Auktor K, Yang Y, Wang GK, et al. Single point mutations affect fatty acid block of human myocardial sodium channel alpha subunit Na+ channels. Proc Natl Acad Sci USA. 2001;98:3606–3611. doi: 10.1073/pnas.061003798. [DOI] [PMC free article] [PubMed] [Google Scholar]


