

Abstract
Background and purpose:
Increased portal pressure in liver injury results from hypercontraction of perivascular non-parenchymal cells including liver myofibroblasts (MFs). Prostaglandin E2 (PGE2) is the major eicosanoid which is released around the venous system during liver injury, but little is known about their contractile effect on MFs.
Experimental approach:
Contraction of primary rat liver MFs was measured by a collagen gel contraction assay. Expression of E prostanoid (EP) receptor subtypes was assessed by reverse transcription-polymerase chain reaction. Fura-2 fluorescence was used to determine intracellular Ca2+ concentration ([Ca2+]i). Phosphorylation of protein kinase C (PKC) was detected by Western blot analysis.
Key results:
Liver MFs expressed mRNAs for all four EP receptors. PGE2 induced contraction in a dose- and time-dependent manner, and slightly increased [Ca2+]i only at high concentrations (10 µmol·L−1). An agonist selective for EP3 receptors, ONO-AE-248, dose-dependently induced MF contraction but did not increase [Ca2+]i. Pretreatment with rottlerin (a specific novel PKC inhibitor) and Ro 31-8425 (a general PKC inhibitor) significantly reduced 1 µmol·L−1 PGE2- or ONO-AE-248-induced contractions. Furthermore, 1 µmol·L−1 PGE2 stimulated phosphorylation of PKC isoforms PKCδ and PKCε. The F prostanoid (FP) receptor antagonist AL8810 abolished the [Ca2+]i elevation and the rapid contraction induced by 10 µmol·L−1 PGE2.
Conclusions and implications:
Lower concentrations up to 1 µmol·L−1 of PGE2 induce liver MF contraction via a [Ca2+]i-independent PKC-mediated pathway through the EP3 receptor, while higher concentrations have an additional pathway leading to Ca2+-dependent contraction through activating the FP receptor.
Keywords: liver myofibroblast, prostaglandin E2, EP3 receptor, FP receptor, protein kinase C
Introduction
In cirrhosis, portal hypertension is caused by an increase in vascular resistance and splanchnic blood flow, which are caused primarily by structural changes such as fibrotic scar tissue and by elevated intrahepatic vascular tone (Laleman et al., 2005). Several in vitro and in vivo studies have highlighted the role of non-parenchymal cells including liver myofibroblasts (MFs) and hepatic stellate cells (HSCs). MFs are located around the central vein and the portal area, whileHSCs are in the space of Disse (Knittel et al., 1999a). In response to liver injury, these cells undergo activation, and produce increased quantities of extracellular matrix (ECM) protein (Friedman, 2000). Besides a fibrogenic response, they also acquire enhanced contractile properties upon activation, which is characterized by greater expression of α-smooth muscle actin (Knittel et al., 1999b; Desmouliere et al., 2003). It is possible that contraction of these non-parenchymal cells, in response to secreted vasoconstrictors, results in an increase in the sinusoidal pressure gradient and resistance, and consequently, in the progress of portal hypertension (Shah et al., 1998; Reynaert et al., 2002). Therefore, MFs and HSCs are now considered to be therapeutic targets to decrease portal hypertension in advanced chronic liver disease. Although most studies have focused on HSC contractility and suggested that various stimulants cause contraction both in Ca2+-dependent and -independent manner (Kawada et al., 1993; Pinzani et al., 1996; Melton et al., 2006; Laleman et al., 2007), few studies have yet addressed MF contractility.
Cyclooxygenase (COX) is the rate-limiting enzyme in prostaglandin biosynthesis from arachidonic acid and exists as two isoforms. COX-1 is constitutively expressed in most tissues and fulfills housekeeping functions. On the other hand, COX-2 is the inducible isoform that accounts for the increased production of PGs in response to pro-inflammatory and mitogenic stimuli (Hu, 2003). Prostaglandin E2 (PGE2) exerts both pro-inflammatory and anti-proliferative effects via G-protein-coupled receptors (GPCRs) (Narumiya et al., 1999; Sugimoto and Narumiya, 2007). There are four GPCRs responding to PGE2 designated as EP1, EP2, EP3 and EP4. The E prostanoid (EP) receptors exhibit differences in signal transduction depending upon coupled G protein subtypes. EP1 receptors couples to Gq and increases intracellular Ca2+. EP2 and EP4 receptors couples to Gs and stimulate adenylate cyclase with a subsequent increase in intracellular cyclic adenosine monophosphate (cAMP). Binding of PGE2 to the EP3 receptor, on the other hand, activates multiple signaling pathways, including Ca2+, protein kinase C (PKC) and phosphatidylinositol 3-kinase (PI3K) signaling pathways (Breyer et al., 2001). In the liver, non-parenchymal cells produce mainly PGE2 and also other PGs, and release them around the vessels during liver injury (Enomoto et al., 2000; Neyrinck et al., 2004).
Previous in vivo studies reported that COX-2 is highly expressed in cirrhotic liver, mainly in the sinusoidal area and area around the vessels, indicating that COX-2 and the resulting product PGE2 may modulate the function of non-parenchymal cells during liver injury (Cheng et al., 2002; Mohammed et al., 2004). However, the role of PGE2 in liver MF bioactivity still remains unknown.
In this study, we isolated rat liver MFs and assessed the changes in their contractility and intracellular Ca2+ concentration ([Ca2+]i) by PGE2 treatment. Low doses of PGE2 caused MF contraction via Ca2+-independent PKC activation through the EP3 receptor. In addition to this mechanism, high doses of PGE2 activated the F prostanoid (FP) receptor and subsequently induced Ca2+-dependent contraction.
Methods
Cell isolation and culture
All animal procedures were performed in accordance with the guidelines of the University of Tokyo. Rat liver MFs were isolated from male Sprague-Dawley rats (300–500 g) as described previously (Kojima et al., 2007). In brief, the liver was perfused with collagenase (Sigma, USA) and protease (Merck, Germany), following removal of hepatocytes and cell debris by low-speed centrifugation. A cell fraction containing MFs was obtained by density gradient centrifugation using 14.6% Nycodenz (Sigma, USA). The cells were cultured in Dulbecco's modified Eagle's medium (DMEM, Sigma, USA) supplemented with 10% fetal bovine serum (FBS, JRH Biosciences, USA), and passaged two to three times before use. Cells between passage 3 and 8 were used for experiments. We confirmed that isolated cells from rat liver express α-smooth muscle actin, fibulin-2 and interleukin-6 at the mRNA level prior to the experiments (data not shown). These have been suggested as specific markers for MFs (Knittel et al., 1999b; Ramadori and Saile, 2002; Tateaki et al., 2004).
Collagen gel contraction assay
Contraction of liver MFs was examined as previously described (Reynaert et al., 2001; Maruyama et al., 2008). In brief, collagen gels were prepared by mixing 70% type I collagen from porcine tendon (Nitta Gelatin, Japan), 20% 5 × DMEM and 10% 0.05 N NaOH under ice-cold conditions (final collagen concentration, 2.1 mg·mL−1). The solution was added to each well of 12 well plates and incubated at 37°C for 1 h. Cells were plated on top of the collagen gels at a concentration of 1 × 10⁵ cells per well. After incubation overnight to allow cell attachment, serum-free conditions were introduced for 48 h. Gels were then detached from the plates using a microspatula. The surface area of the gels was quantified using ImageJ (National Institutes of Health, USA). Relative contraction of the gels was expressed as a percentage according to the following formula: [(gel surface area of buffer − gel surface area of test substance)/(gel surface area of buffer − gel surface area of 5% FBS stimulation for 24 h)] × 100%.
[Ca2+]i measurement
[Ca2+]i was measured using fura-2 AM as previously described (Kojima et al., 2007). In brief, liver MFs on glass coverslips in HEPES-buffered solution were loaded with 3 µmol·L−1 fura-2 AM (Dojindo Laboratories, Japan) for 40 min in a dark room at 37°C and placed in a bath on the stage of an inverted microscope (TE-300, Nikon, Japan) equipped with a 40-fold objective lens. Using a fluorescence imaging system (Hamamatsu Photonics, Japan), images of 510 nm fluorescence were captured every 3 s using 340 nm and 380 nm wavelength light, and the fluorescence of an image at 340 nm (F340) was divided by the fluorescence at 380 nm (F380) giving a ratio (F340/F380). [Ca2+]i was calculated using the following formula described previously (Takahashi et al., 1999): [Ca2+]i = Kd × (Sf2/Sb2) × (R − Rmin)/(Rmax − R), where Kd is the effective dissociation constant of fura-2 and has a value of 224 nmol·L−1, R is the fluorescence ratio, Rmin and Rmax are the ratios in absence and presence of Ca2+, respectively, and Sf2 and Sb2 are the emissions at 380 nm in the absence and presence of Ca2+ respectively. Calibration was accomplished after permeabilization of the cells with 3 µmol·L−1 ionomycin and measurement of fluorescence at both wavelengths under Ca2+-free (in 0.5 mmol·L−1 EGTA) or Ca2+-saturated (in 1.5 mmol·L−1 CaCl2) conditions to obtain Rmin, Rmax, Sf2 and Sb2. The area under the Δratio per time curve (area under curve, AUC) was calculated to assess the response.
Reverse transcription-polymerase chain reaction (RT-PCR)
Total RNA was extracted from liver MFs, and the concentration of total RNA was adjusted to 1 µg·µL−1 with RNase-free distilled water. RT-PCR was performed as previously described (Kojima et al., 2007). After denaturation at 95°C for 10 min, 36 cycles of amplification at 94°C for 40 s, at 60°C for 1 min and at 72°C for 1 min were performed using a thermal cycler (Takara Bio, Japan). The PCR products were electrophoresed onto a 2% agarose gel containing ethidium bromide at 0.2 µg·mL−1. The detectable fluorescence bands were visualized using an ultraviolet transilluminator. The forward and the reverse primers for EP1 through EP4 receptors, FP receptor, COX-1, COX-2, microsomal prostaglandin E synthase-1 (mPGES-1), mPGES-2 and glyceraldehyde-3-phosphate dehydrogenase (GAPDH) were designed as shown in Table 1.
Table 1.
RT-PCR primer pairs
| Target gene | 5′ sequence | 3′ sequence | Product (bp) |
|---|---|---|---|
| GAPDH | TCCCTCAAGATTGTCAGCAA | AGATCCACAACGGATACATT | 308 |
| EP1 | ATGGTCTTCTTTGGCCTGTG | GTTCTCTCGGAAACGTCGAG | 387 |
| EP2 | GAACGCTACCTCGCCATCGG | CGAAGGTGATGGTCATAATGGC | 421 |
| EP3 | CTTTGCCTCCGCCTTCGCC | CTTAGCAGCAGATAAACCCAGG | 363 |
| EP4 | CATCTTACTCATCGCCACCTCTC | GTTAGGTCTGGCAGGTATAGGAGG | 393 |
| FP | GACTCTTAGCTCTCGGCATCTC | CGTAGCAGAATGTAGACCCAGG | 298 |
| COX-1 | CCGGATTGGTGGGGGTAG | AGGGGCAGGTCTTGGTGTTG | 434 |
| COX-2 | CTGTATCCCGCCCTGCTGGTG | ACTTGCGTTGATGGTGGCTGTCTT | 282 |
| PGE synthase-1 | GTTTGGTGATGGAGAACAGC | GTAGACGAAACCAAGGAAGAGG | 257 |
| PGE synthase-2 | CCAGTACAAGACATGTCCCTTC | GTACACGTTGGGAGAGATGAGA | 439 |
COX, cyclooxygenase; EP, E prostanoid; GAPDH, glyceraldehyde-3-phosphate dehydrogenase; PGE, prostaglandin E; RT-PCR, reverse transcription-polymerase chain reaction.
Western blot analysis
To detect phosphorylated PKCδ and PKCε, Western blots were carried out in accordance with the method described previously (Vary et al., 2005), with modifications noted below. Liver MFs were transferred to ice-cold homogenization buffer [50 mmol·L−1 Tris-HCl, pH 7.4, 1% NP-40, 0.25% sodium deoxycholate, 150 mmol·L−1 NaCl, 1 mmol·L−1 EDTA, 1 mmol·L−1 Na3VO4, 1 mmol·L−1 NaF, 1 mg·mL−1 Pefabloc SC (protease inhibitor) and 1 mg·mL−1 Complete (protease inhibitor cocktail)] followed by centrifugation at 20 000× g for 30 min at 4°C, and the supernatant was collected for analysis. The blots on polyvinylidene difluoride (PVDF) membranes were probed with anti-phospho-PKCδThr505 and phospho-PKCεSer729 antibodies (1:500 each). For secondary reaction, anti-mouse IgG (Alexa Fluor 680) or anti-rabbit IgG (IRDye800) were used (1:10 000 each). Bands were detected and quantified with the Odyssey system (LI-COR Biosciences, USA). To correct for loading variations, the result was expressed as a ratio of phospho/total PKC with the control ratio set at 1.0.
Cell morphology and viability
For Giemsa staining, MFs were fixed in 4% paraformaldehyde for 5 min, incubated in Giemsa solution (2% in 10 mmol·L−1 phosphate buffer, pH 7.4) for 1 h, washed in distilled water, dehydrated and covered with glass. For actin staining, cells were fixed in 4% paraformaldehyde and incubated with 0.01% Triton and 10% normal goat serum (Chemicon International, USA) for 30 min at room temperature. Cells were probed with anti-smooth muscle actin antibody (1:100) followed by anti-mouse IgG (Alexa Fluor 568, 1:100). Cells were finally incubated with DAPI (1 µg·mL−1) for 5 min. For Trypan blue staining, cells were trypsinized, resuspended in 0.3% Trypan blue solution and counted using a haemocytometer. The cells with and without blue dye staining were recorded as dead and alive respectively.
Materials
Drug and molecular target nomenclature conforms to the BJP's Guide to Receptors and Channels (Alexander et al., 2008). The chemicals obtained were: PGE2 and AL8810 (Cayman Chemical, USA), ATP disodium salt, ionomycin calcium salt and DAPI (Sigma, USA), Ro 31-8425 (Calbiochem, Germany), phorbol 12,13-dibutyrate (PDBu) and rottlerin (Biomol International, USA), Pefabloc SC and Complete (Roche Applied Science, USA), anti-PKCδ and anti-PKCε antibodies (BD Biosciences, USA), anti-phospho-PKCδThr505 antibody (Cell Signaling Technology, USA), anti-phospho-PKCεSer729 antibody (Upstate Biotechnology, USA), anti-rabbit IgG conjugated to Alexa Fluor 680 and anti-mouse IgG conjugated to Alexa Fluor 568 (Molecular Probes, USA), anti-mouse IgG conjugated to IRDye800 (Rockland, USA) and anti-smooth muscle actin antibody (DAKO, Denmark). ONO-DI-004 (EP1 receptor agonist), ONO-AE1-259-01 (EP2 receptor agonist), ONO-AE-248 (EP3 receptor agonist) and ONO-AE1-329 (EP4 receptor agonist) were gifts kindly provided by Ono Pharmaceutical Company Ltd. (Osaka, Japan).
Statistical analysis
The results of the experiments are expressed as mean ± SEM. Statistical evaluation of the data was performed by paired or unpaired Student's t-test for comparison between two groups, and by one-way analysis of variance followed by Dunnett's test for comparisons between more than two groups. Statistical significance was established at P-values lower than 0.05.
Results
EP receptor subtypes
We performed RT-PCR in liver MFs to investigate the expression of the four subtypes of EP receptor. As shown in Figure 1A, MFs expressed mRNAs for all four EP receptor subtypes: EP1, EP2, EP3 and EP4. They also expressed COX-1, COX-2, mPGES-1 and mPGES-2, which are the essential enzymes in PGE2 biosynthesis from arachidonic acid (Figure 1B).
Figure 1.
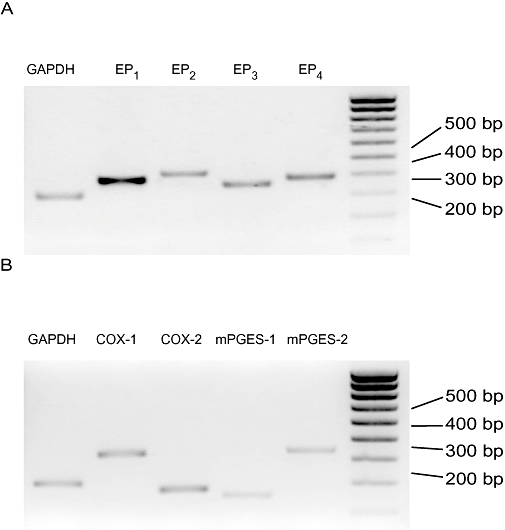
Expression of the four subtypes of E prostanoid (EP) receptor EP1 through EP4 (A) and cyclooxygenase-1 (COX-1), COX-2, microsomal prostaglandin E synthase-1 (mPGES-1) and mPGES-2 (B) in liver myofibroblasts (MFs). Figures show representative results from RT-PCR. GAPDH, glyceraldehyde-3-phosphate dehydrogenase; RT-PCR, reverse transcription-polymerase chain reaction.
Effect of PGE2 on liver MF contraction
We next performed the collagen gel contraction assay in order to investigate the contractile effect of PGE2. Hydrated collagen gels provide a potent model for examining in vitro the reciprocal mechanical interactions that occur between cells and the ECM (Tomasek et al., 2002). Liver MFs cultured on collagen gels were stimulated with PGE2 after cell attachment and serum starvation. As shown in Figure 2A, PGE2 induced cell contraction in a dose-dependent manner (0.1–10 µmol·L−1, n = 5). Contractile effects of PGE2 were observed at each time point during the experiment. PGE2 (1 µmol·L−1) induced cell contraction of 44.8 ± 3.0% at 8 h. Data are shown as the percentage of maximal contraction induced by 5% FBS.
Figure 2.

Prostaglandin E2 (PGE2) induced collagen gel contraction in liver myofibroblasts. (A) Collagen gels were treated in DMEM containing a range of concentrations of PGE2: 0.1, 0.3, 1 and 10 µmol·L−1. (B) Effect of E prostanoid receptor subtype-selective agonists on collagen gel contraction: EP1 (ONO-DI-004), EP2 (ONO-AE1-259-01), EP3 (ONO-AE-248) and EP4 (ONO-AE1-329). All the agonists were used at a concentration of 1 µmol·L−1. (C) Effect of EP3 receptor agonist ONO-AE-248 over a range of concentrations: 0.1, 1 and 10 µmol·L−1. Gels were photographed to quantify the surface area. Relative contraction was calculated as shown in Methods. Data are presented as mean ± SEM. *P < 0.05, **P < 0.01 compared with unstimulated condition. DMEM, Dulbecco's modified Eagle's medium.
Effect of EP receptor-selective agonists on cell contraction
Liver MFs cultured on collagen gels were stimulated with a selective agonist of each EP receptor to examine which subtype is responsible for the contractile effect of PGE2. The EP3 receptor agonist ONO-AE-248 (1 µmol·L−1) produced contraction of 31.7 ± 1.7% at 8 h after stimulation (P < 0.01), whereas neither ONO-DI-004 (EP1 receptor agonist), ONO-AE1-259-01 (EP2 receptor agonist), nor ONO-AE1-329 (EP4 receptor agonist) induced contraction. The EP4 receptor agonist ONO-AE1-329 showed a slight suppressive effect at 1 h (Figure 2B, P < 0.05, n = 6). As shown in Figure 2C, the contractile effects of ONO-AE-248 were dose-dependent (0.1–10 µmol·L−1, n = 7). These results suggest that PGE2 induces contraction in MFs via the EP3 subtype of the PGE receptor.
[Ca2+]i response to PGE2 and a selective agonist of the EP3 receptor
To explore the downstream pathways of EP3 receptor, we examined the involvement of intracellular Ca2+ in liver MFs treated with PGE2 or an EP3 selective agonist. PGE2 (1 µmol·L−1) and ONO-AE-248 (1–10 µmol·L−1) did not increase [Ca2+]i, while PGE2 induced a slight but apparent increase in [Ca2+]i at a concentration of 10 µmol·L−1 (Figure 3A). We previously reported that ATP induces sufficient [Ca2+]i increase in MFs (Kojima et al., 2007). Compared with [Ca2+]i increase by 10 µmol·L−1 ATP, the amount of change in AUC induced by 10 µmol·L−1 PGE2 was only 23% (AUC, 0–2 min). Because of their similarity of chemical structure, prostanoids are known to react with different prostanoid receptors, especially at higher concentration. We thus examined the effect of antagonism of the FP receptor on [Ca2+]i elevation induced by10 µmol·L−1 PGE2. As shown in Figure 3B, the FP receptor antagonist AL8810 (3 µmol·L−1) completely inhibited this [Ca2+]i increase (P < 0.01, n = 4).
Figure 3.
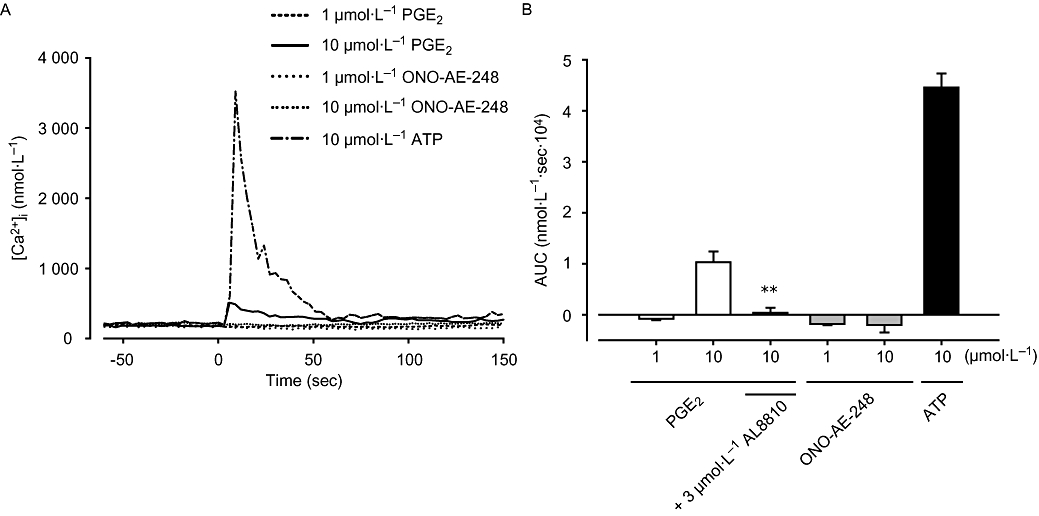
Effect of prostaglandin E2 (PGE2) and ONO-AE-248 on [Ca2+]i. (A) Liver myofibroblasts cultured on glass coverslips were stimulated with PGE2 and ONO-AE-248 (1 or 10 µmol·L−1), or ATP (10 µmol·L−1). Changes in [Ca2+]i were measured using Ca2+ fluorescent dye fura-2. (B) The area under [Ca2+]i-time curve after stimulation (AUC: 0–2 min). Data are presented as mean ± SEM of 52–110 cells from four separate experiments. **P < 0.01 compared with 10 µmol·L−1 PGE2-treated cells. AUC, area under curve.
Effect of PKC inhibitors on cell contraction
We next examined the effect of PKC inhibitors on cell contraction induced by PGE2 or the EP3 receptor agonist. Liver MFs on collagen gels were pretreated with compounds that differentially inhibit different PKC isozymes. Ro 31-8425 is a broad range PKC inhibitor for both Ca2+-dependent conventional PKC (cPKC) and Ca2+-independent novel PKC (nPKC), showing threefold to fourfold selectivity for cPKCs versus PKCε. Rottlerin specifically inhibits nPKC isozyme PKCδ. In the present study, cells were pretreated with these inhibitors for 30 min prior to the treatment with 1 µmol·L−1 of PGE2 or ONO-AE-248. As shown in Figure 4A,B, Ro 31-8425 (30–300 nmol·L−1) significantly inhibited PGE2- and ONO-AE-248-induced MF contractions (P < 0.05, n = 5). Rottlerin (0.3–3 µmol·L−1) also inhibited cell contraction in a dose-dependent manner (Figure 4C,D, P < 0.01, n = 5).
Figure 4.
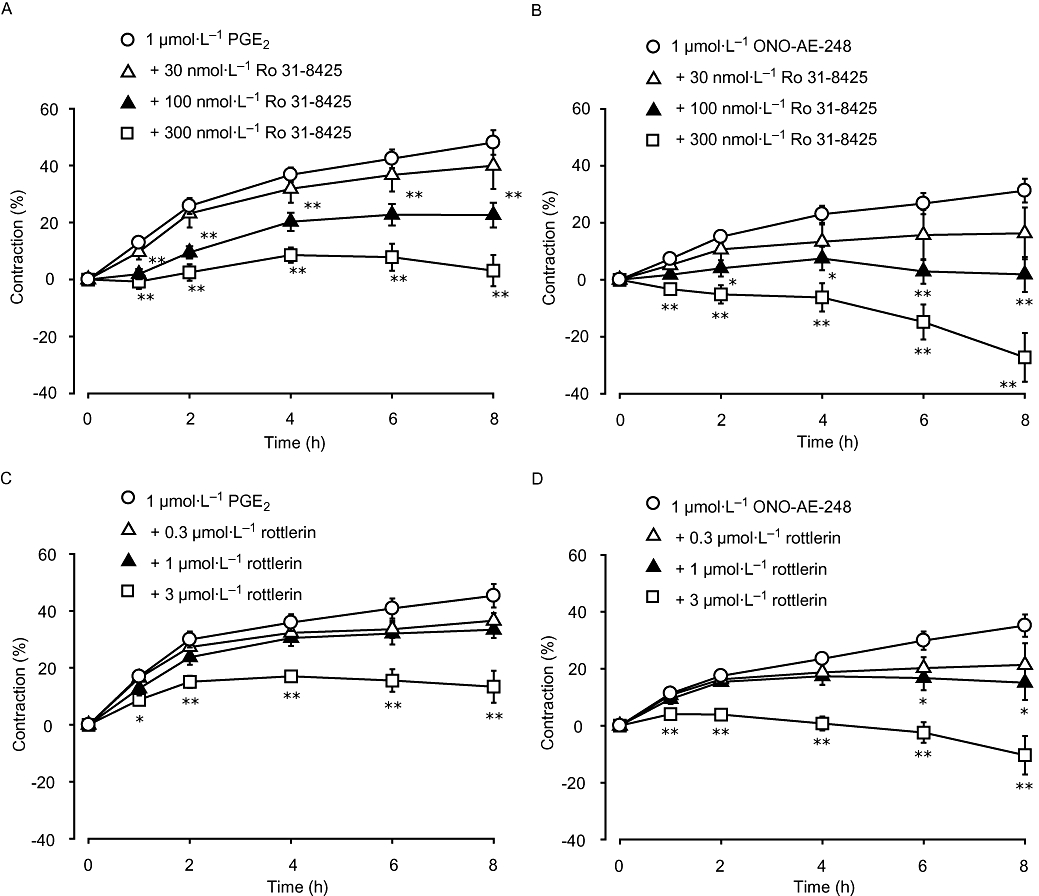
Ro 31-8425 and rottlerin inhibited liver myofibroblast (MF) contractions induced by PGE2- or ONO-AE-248. Cells were stimulated with 1 µmol·L−1 of PGE2 (A, C) or ONO-AE-248 (B, D) after pretreatment for 30 min with either protein kinase C (PKC) inhibitor: Ro 31-8425 (general PKC inhibitor: 30, 100 and 300 nmol·L−1) (A, B) or rottlerin (specific nPKC inhibitor: 0.3, 1 and 3 µmol·L−1) (C, D). Data are presented as mean ± SEM. *P < 0.05, **P < 0.01 compared with 1 µmol·L−1 PGE2- or ONO-AE-248-treated cells.
Effect of PKC inhibitors on cell morphology and viability
We confirmed whether both PKC inhibitors influence MF morphology and viability under the present conditions. As shown in Figure 5A, we could not observe any changes in MF cell shape and expression of α-smooth muscle actin after 8 h treatment with Ro 31-8425 (300 nmol·L−1) or rottlerin (3 µmol·L−1). We also examined cell viability using Trypan blue staining. MFs were stimulated for 8 h with Ro 31-8425 (300 nmol·L−1) or rottlerin (3 µmol·L−1) and the percentage of viable cells were not different from that under unstimulated condition (Figure 5B, n = 5).
Figure 5.
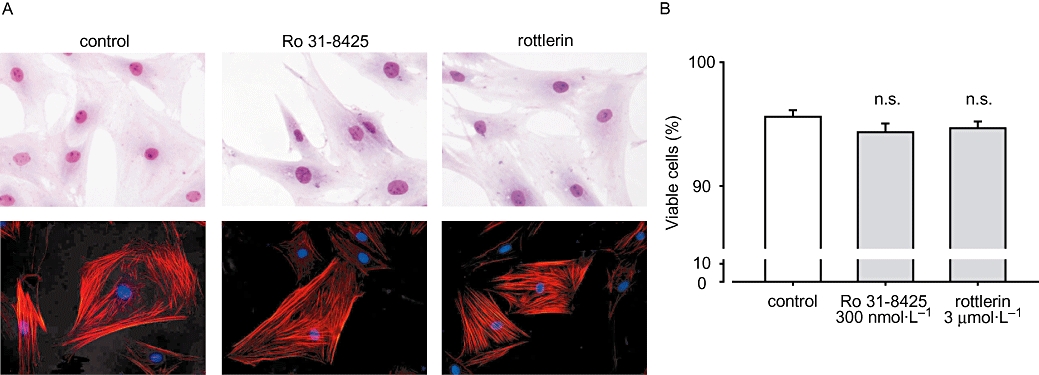
Ro 31-8425 and rottlerin did not influence myofibroblast (MF) morphology and viability. MFs were treated with Ro 31-8425 (300 nmol·L−1) or rottlerin (3 µmol·L−1) for 8 h. (A) MF were fixed in paraformaldehyde and stained in Giemsa solution (upper row) or probed with anti-smooth muscle actin antibody (lower row). (B) Cells after 8 h stimulation were resuspended in 0.3% Trypan blue solution, and viable and dead cells were counted. Data are presented as mean ± SEM. No significant difference was observed between control and 8 h stimulated conditions.
PGE2 promotes PKCδ and PKCε phosphorylation
To directly examine whether PGE2 activates nPKC, we next evaluated the phosphorylation of nPKC isozymes, PKCδ (Thr505, Figure 6A) and PKCε (Ser729, Figure 6B). While 5 min stimulation with 1 µmol·L−1 PGE2 did not phosphorylate both PKC isozymes, 15 min stimulation significantly increased phosphorylation of both PKCδThr505 (P < 0.01, n = 4) and PKCεSer729 (P < 0.05, n = 4). For both PKC isozymes, we confirmed that a known PKC activator PDBu (1 µmol·L−1, 5 min) increased significantly their phosphorylation (Figure 6A,B, far right lane). We next examined whether PKC inhibitors can block these phosphorylations. 30 min pretreatment with Ro 31-8425 (300 nmol·L−1) and rottlerin (3 µmol·L−1) influenced neither PKCδ (Figure 6C) nor PKCε (Figure 6D) phosphorylation induced by PGE2 (1 µmol·L−1, 15 min).
Figure 6.
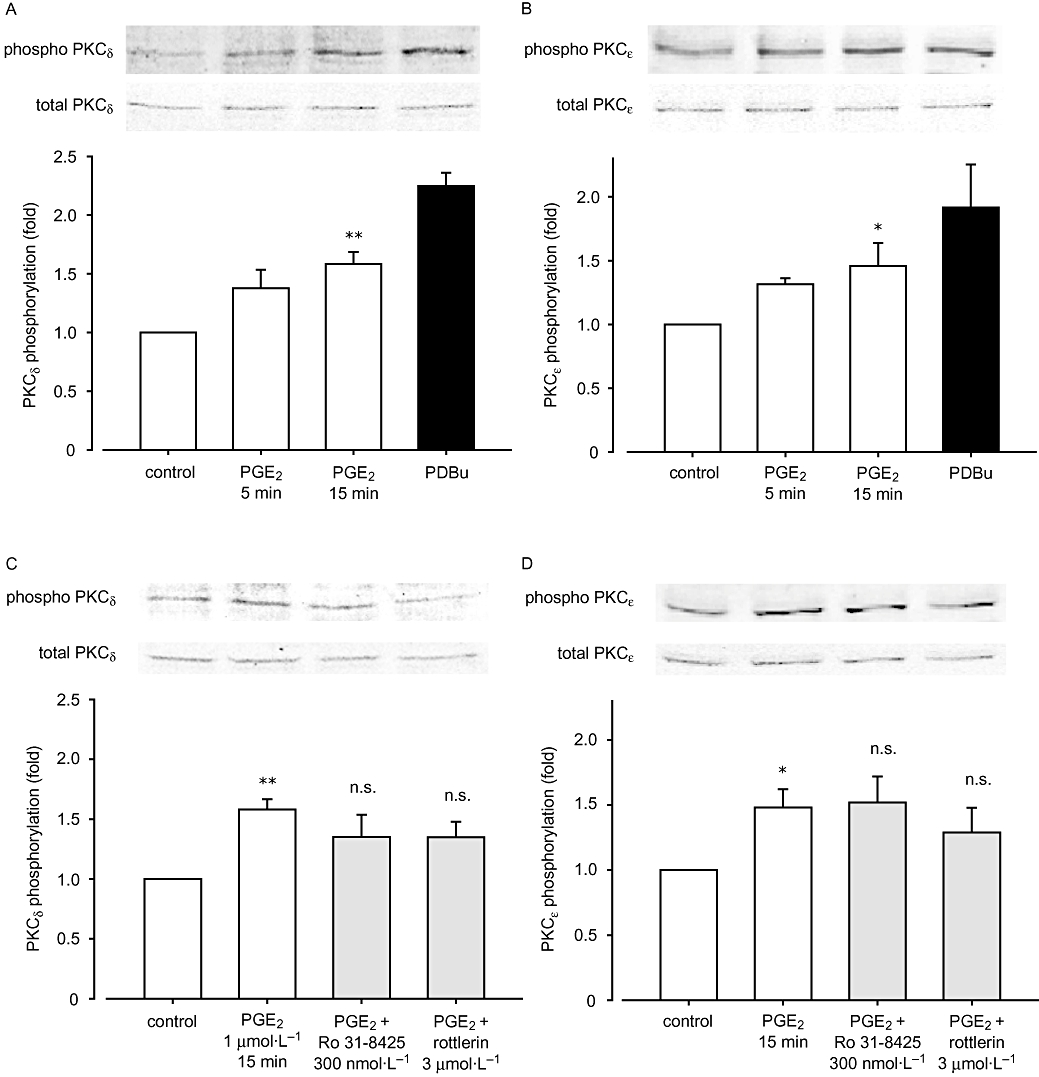
Effect of prostaglandin E2 (PGE2) on protein kinase C (PKC) phosphorylations. Cell homogenates were analysed by Western blotting after stimulation with: (A, B) 1 µmol·L−1 PGE2 (5 or 15 min) or 1 µmol·L−1 PDBu (5 min), (C, D) 30 min pretreatment with Ro 31-8425 or rottlerin followed by 1 µmol·L−1 PGE2 (15 min). Anti-phospho-PKCδThr505 antibody (A, C) or anti-phospho-PKCεSer729 (B, D) antibody was used. The phosphorylation was measured by densitometry and normalized as described in Methods. Representative pictures are also shown. Data are presented as mean ± SEM. *P < 0.05, **P < 0.01 compared with basal control.
FP receptor antagonist partially blocked 10 µmol·L−1 PGE2-induced cell contraction
We examined the effect of the FP receptor antagonist AL8810 on cell contraction induced by PGE2. As shown in Figure 7A, 30 min pretreatment with AL8810 (3 µmol·L−1) partially blocked the contraction induced by 10 µmol·L−1 PGE2. ONO-AE-248 (10 µmol·L−1) induced only 59.7% contraction as compared with PGE2 at 1 h, while the difference was abolished by AL8810 treatment (P < 0.05, n = 4). In contrast, AL8810 did not affect cell contraction induced by ONO-AE-248 or 1 µmol·L−1 PGE2 (n = 4, data not shown). When assessed by RT-PCR, MFs expressed FP receptor as well as EP receptors (Figure 7B).
Figure 7.
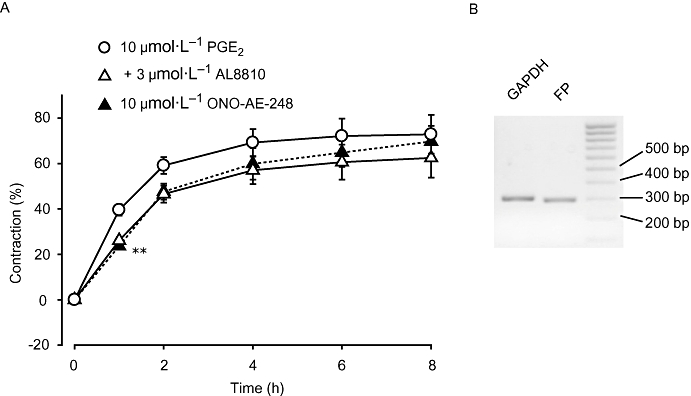
The F prostanoid (FP) receptor selective antagonist AL8810 partially inhibited 10 µmol·L−1 prostaglandin E2 (PGE2)-induced liver myofibroblast (MF) contraction. (A) Cells were stimulated with 10 µmol·L−1 PGE2 after pretreatment for 30 min with AL8810 at a concentration of 3 µmol·L−1. Data are presented as mean ± SEM. **P < 0.01 compared with 10 µmol·L−1 PGE2-treated cells. (B) Representative results from RT-PCR showing the expression of the FP receptor. RT-PCR, reverse transcription-polymerase chain reaction.
Discussion and conclusions
In the present study, we examined the effect of PGE2 on isolated liver MF contractility. We demonstrated that PGE2 up to 1 µmol·L−1 induced cell contraction via the EP3-PKC pathway which was not accompanied by a detectable [Ca2+]i increase and that at higher concentrations, PGE2 activated the FP receptor resulting in a [Ca2+]i increase and additional cell contraction.
Recent studies have clearly shown that MFs possess a different origin from HSCs (Knittel et al., 1999a; Kinnman et al., 2003). Although both cells exhibit a similar phenotype regarding contractility and ECM secretion, some reports have provided evidence that these cells differentially contribute to liver cirrhosis. Proliferation of MFs observed in a cirrhotic liver suggests a pivotal role of this cell type, while HSCs also undergo activation during liver injury but fail to proliferate in vivo and also in vitro (Ramadori and Saile, 2002; Saile et al., 2002). In this study, we sought to investigate the contractility of MFs which still remained largely unknown.
Many reports have shown that non-parenchymal cells in sinusoidal spaces were positively stained with COX-2 in various models of liver disease (Yamamoto et al., 2003; Planaguma et al., 2005). These results allow us to hypothesize that liver MFs are one of the major sources of PGE2 upon liver injury. Indeed, MFs expressed COX-2 as well as mPGES-1 and mPGES-2, indicating that secreted PGE2 may control the function of adjacent non-parenchymal cells in an autocrine and/or paracrine manner. Previous reports show that liver injury or inflammation increases the local PGE2 concentration in sinusoids up to several hundred or thousand nanomolar (Neuschafer-Rube et al., 1993; Devaux et al., 2001). These reports support that PGs in our study are within a physiologically relevant concentration in the liver. In the present study, MFs expressed a noticeable level of COX-2 expression even under unstimulated conditions (Figure 1B). We previously reported that scaffold materials influence MF bioactivity (Kojima et al., 2007). Therefore incubation on plastic dishes may have provided some stimulation of COX-2 expression in MFs. Further investigation is needed to clarify this point.
Prostaglandin E2 is thought to regulate important liver functions such as glucose homeostasis, delivery of blood substances to hepatocytes and lipid oxidation (Bradford et al., 1999; Enomoto et al., 2000; Pestel et al., 2002). In this study, we focused on its contractile effects on liver MFs and demonstrated that exogenous administration of PGE2 promoted cell contraction. PGE2 is known to produce a broad range of biological effects through its binding to specific receptors namely EP1, EP2, EP3 and EP4. In liver MFs, all four EP receptor subtypes were observed at mRNA level. We then applied four EP subtype-selective agonists to see their contractile effects individually and found that only ONO-AE-248, a selective agonist for EP3, receptors, induced contraction. Our results are consistent with the previous reports showing that EP3 receptors mediate PGE2-induced contraction in human pulmonary artery (Qian et al., 1994). Another group also suggested that both EP1 and EP3 receptors are involved in constriction of adult porcine large cerebral arteries (Jadhav et al., 2004). However, the selective agonist for EP1 receptors did not induce contraction in rat liver MFs, even at a concentration of 10 µmol·L−1 (data not shown).
Some other studies clarified that PGE2 exhibits vasodilator effects through EP2 receptor in human dermal fibroblasts, or through EP4 receptor in mice aorta and human middle cerebral arteries, which couple efficiently to Gs or Gi (Davis et al., 2004; Sandulache et al., 2006). Consistent with these observations, we showed that the EP4 selective agonist ONO-AE1-329 slightly inhibited rat liver MF contraction at an early period of PGE2 treatment. This dilation may be mediated through intracellular cAMP generation resulting from EP4 receptor-coupled Gs activation. In this study, we could not observe any contractile effect after EP1 and EP2 receptor stimulation. These receptors may be involved in other pathophysiological roles in MFs, such as cell proliferation, migration, or ECM secretion.
Although a previous study indicated that EP3 receptor stimulation caused smooth muscle contraction through Ca2+-signaling pathways in guinea-pig aorta (Jones et al., 1998), our study demonstrated that PGE2 or a EP3 selective agonist caused MF contraction without changing [Ca2+]i at a concentration of 1 µmol·L−1. We therefore sought to reveal the Ca2+-independent pathway in MF contraction induced by 1 µmol·L−1 of PGE2 or ONO-AE-248.
In vascular smooth muscle, a Ca2+-independent pathway, known as Ca2+ sensitization, is proposed to be an important component of the constrictor response to many receptor agonists. Several key intracellular protein kinases including PKC have been thought to be involved in pathways leading to Ca2+-sensitization (Somlyo and Somlyo, 2003). PKC can be subdivided into three classes based on primary structure and biological properties: conventional PKC isozymes (cPKC), novel PKC isozymes (nPKC) and atypical PKC isozymes (aPKC) (Ward et al., 2004). Our results showing no [Ca2+]i increase in the presence of 1 µmol·L−1 of PGE2 or ONO-AE-248 rule out the involvement of cPKC, which requires [Ca2+]i increase on activation. In our study, we revealed that rottlerin (a specific nPKC inhibitor) as well as Ro 31-8425 (a general PKC inhibitor) strongly inhibited 1 µmol·L−1 PGE2- or ONO-AE-248-induced contraction. The general PKC inhibitor Ro 31-8425 is known to inhibit both cPKCs- and PKCε-activity while rottlerin inhibits PKCδ more potently than other nPKC isozymes. The effects of these inhibitors were specific to the contractile response against PGE2, because the administration of each PKC inhibitor alone did not induce toxicity in terms of cell morphology and viability. We also observed that PKCδ and PKCε undergo rapid phosphorylation in response to MF stimulation with PGE2. These data show the possible involvement of PKCδ and PKCε in the primary component of EP3 selective agonist action.
Ro 31-8425 and rottlerin are known to bind to the ATP binding site at the catalytic domain of PKC (Muid et al., 1991; Gschwendt et al., 1994). Although it is well-known that cPKCs are phosphorylated by a Ro 31-8425- and rottlerin-insensitive kinase, PDK-1 (phosphoinositide-dependent kinase-1), the detailed relationship of nPKC phosphorylation and the inhibitory effect of PKC inhibitors is still unclear (Way et al., 2000; Steinberg, 2004). As shown in Figure 6C,D, pretreatment with Ro 31-8425 and rottlerin did not influence nPKC phosphorylations. Our results suggest that nPKCs may be phosphorylated by a kinase insensitive to Ro 31-8425 and rottlerin in liver MFs. Further investigation should be made to reveal the detailed interactions between PKC inhibition and the inhibition of contractile activity by these agents.
As well as PKC signaling pathways, it has been suggested that the other pathways also involve in Ca2+ sensitization. Recently, the small GTPase, Rho, and Rho-kinase has been investigated as an important regulator of HSC proliferation, migration and contraction (Tangkijvanich et al., 2001; Ramm et al., 2003; Laleman et al., 2007) but the involvement of Rho and other related factors in MF contraction still remains to be tested.
A higher concentration of PGE2 (10 µmol·L−1) caused rapid and greater MF contraction compared with that with the low concentration (1 µmol·L−1). A notable finding in the [Ca2+]i measurement is that this PGE2-induced contraction at 10 µmol·L−1 is accompanied by a small increase of [Ca2+]i, suggesting that different signal pathways are involved. PGE2 and prostaglandin F2α (PGF2α) are structurally identical, except at the C-9 position in the cyclopentane ring where PGE2 has a keto substituent and PGF2α has a hydroxyl. Also, PGE2 binds to the FP receptor in CHO cells and HEK-293 cells (Kiriyama et al., 1997; Fujino et al., 2004). Therefore, it is possible that the [Ca2+]i increase by 10 µmol·L−1 PGE2 in rat liver MFs was due to FP receptor activation, whose downstream pathway has been classically characterized by Ca2+ signaling (Breyer et al., 2001). We demonstrated here that the selective antagonist for FP receptor, AL8810, significantly inhibited [Ca2+]i increase by 10 µmol·L−1 PGE2. AL8810 also inhibited the rapid contraction by 10 µmol·L−1 PGE2, which indicates the involvement of the FP receptor in PGE2-induced MF contraction, especially at higher concentrations.
In summary, we showed that low concentrations of PGE2 induced contraction in liver MFs via EP receptor subtype EP3. This effect appears to involve an enhancement of the Ca2+ sensitization through a Ca2+-independent, novel PKCδ and/or PKCε-mediated pathway. We also demonstrated that a high concentration of PGE2 activated the PGF2α receptor FP and increased [Ca2+]i, leading to stronger MF contraction than through the EP3-PKC pathway. A better understanding of the intracellular signal transduction mechanisms leading to MF contraction might lead to the identification of novel potential targets for the treatment of portal hypertension and cirrhosis. The present results may provide new insights into the development of a pharmacological therapeutic strategy targeting PGE2 and its receptor subtypes.
Acknowledgments
This work was supported by Grant-in-Aid for Scientific Research from The Ministry of Education, Culture, Sports, Science and Technology (Japan) and the Japan Society for the Promotion of Science.
Glossary
Abbreviations:
- ECM
extracellular matrix
- GPCR
G-protein-coupled receptor
- HSC
hepatic stellate cell
- MF
myofibroblast
- mPGES
microsomal prostaglandin E synthase
- PGE2
prostaglandin E2
- PGF2α
prostaglandin F2α
Conflicts of interest
None.
References
- Alexander SP, Mathie A, Peters JA. Guide to Receptors and Channels (GRAC), 3rd edition. Br J Pharmacol. 2008;153(Suppl.)(2):S1–S209. doi: 10.1038/sj.bjp.0707746. [DOI] [PMC free article] [PubMed] [Google Scholar]
- Bradford BU, Enomoto N, Ikejima K, Rose ML, Bojes HK, Forman DT, et al. Peroxisomes are involved in the swift increase in alcohol metabolism. J Pharmacol Exp Ther. 1999;288:254–259. [PubMed] [Google Scholar]
- Breyer RM, Bagdassarian CK, Myers SA, Breyer MD. Prostanoid receptors: subtypes and signaling. Annu Rev Pharmacol Toxicol. 2001;41:661–690. doi: 10.1146/annurev.pharmtox.41.1.661. [DOI] [PubMed] [Google Scholar]
- Cheng J, Imanishi H, Iijima H, Shimomura S, Yamamoto T, Amuro Y, et al. Expression of cyclooxygenase 2 and cytosolic phospholipase A(2) in the liver tissue of patients with chronic hepatitis and liver cirrhosis. Hepatol Res. 2002;23:185–195. doi: 10.1016/s1386-6346(01)00177-2. [DOI] [PubMed] [Google Scholar]
- Davis RJ, Murdoch CE, Ali M, Purbrick S, Ravid R, Baxter GS, et al. EP4 prostanoid receptor-mediated vasodilatation of human middle cerebral arteries. Br J Pharmacol. 2004;141:580–585. doi: 10.1038/sj.bjp.0705645. [DOI] [PMC free article] [PubMed] [Google Scholar]
- Desmouliere A, Darby IA, Gabbiani G. Normal and pathologic soft tissue remodeling: role of the myofibroblast, with special emphasis on liver and kidney fibrosis. Lab Invest. 2003;83:1689–1707. doi: 10.1097/01.lab.0000101911.53973.90. [DOI] [PubMed] [Google Scholar]
- Devaux Y, Seguin C, Grosjean S, de Talance N, Schwartz M, Burlet A, et al. Retinoic acid and lipopolysaccharide act synergistically to increase prostanoid concentrations in rats in vivo. J Nutr. 2001;131:2628–2635. doi: 10.1093/jn/131.10.2628. [DOI] [PubMed] [Google Scholar]
- Enomoto N, Ikejima K, Yamashina S, Enomoto A, Nishiura T, Nishimura T, et al. Kupffer cell-derived prostaglandin E(2) is involved in alcohol-induced fat accumulation in rat liver. Am J Physiol Gastrointest Liver Physiol. 2000;279:G100–106. doi: 10.1152/ajpgi.2000.279.1.G100. [DOI] [PubMed] [Google Scholar]
- Friedman SL. Molecular regulation of hepatic fibrosis, an integrated cellular response to tissue injury. J Biol Chem. 2000;275:2247–2250. doi: 10.1074/jbc.275.4.2247. [DOI] [PubMed] [Google Scholar]
- Fujino H, Vielhauer GA, Regan JW. Prostaglandin E2 selectively antagonizes prostaglandin F2alpha-stimulated T-cell factor/beta-catenin signaling pathway by the FPB prostanoid receptor. J Biol Chem. 2004;279:43386–43391. doi: 10.1074/jbc.M408276200. [DOI] [PubMed] [Google Scholar]
- Gschwendt M, Muller HJ, Kielbassa K, Zang R, Kittstein W, Rincke G, et al. Rottlerin, a novel protein kinase inhibitor. Biochem Biophys Res Commun. 1994;199:93–98. doi: 10.1006/bbrc.1994.1199. [DOI] [PubMed] [Google Scholar]
- Hu KQ. Cyclooxygenase 2 (COX2)-prostanoid pathway andliver diseases. Prostaglandins Leukot Essent Fatty Acids. 2003;69:329–337. doi: 10.1016/j.plefa.2003.07.001. [DOI] [PubMed] [Google Scholar]
- Jadhav V, Jabre A, Lin SZ, Lee TJ. EP1- and EP3-receptors mediate prostaglandin E2-induced constriction of porcine large cerebral arteries. J Cereb Blood Flow Metab. 2004;24:1305–1316. doi: 10.1097/01.WCB.0000139446.61789.14. [DOI] [PubMed] [Google Scholar]
- Jones RL, Qian YM, Chan KM, Yim AP. Characterization of a prostanoid EP3-receptor in guinea-pig aorta: partial agonist action of the non-prostanoid ONO-AP-324. Br J Pharmacol. 1998;125:1288–1296. doi: 10.1038/sj.bjp.0702189. [DOI] [PMC free article] [PubMed] [Google Scholar]
- Kawada N, Tran-Thi TA, Klein H, Decker K. The contraction of hepatic stellate (Ito) cells stimulated with vasoactive substances. Possible involvement of endothelin 1 and nitric oxide in the regulation of the sinusoidal tonus. Eur J Biochem. 1993;213:815–823. doi: 10.1111/j.1432-1033.1993.tb17824.x. [DOI] [PubMed] [Google Scholar]
- Kinnman N, Francoz C, Barbu V, Wendum D, Rey C, Hultcrantz R, et al. The myofibroblastic conversion of peribiliary fibrogenic cells distinct from hepatic stellate cells is stimulated by platelet-derived growth factor during liver fibrogenesis. Lab Invest. 2003;83:163–173. doi: 10.1097/01.lab.0000054178.01162.e4. [DOI] [PubMed] [Google Scholar]
- Kiriyama M, Ushikubi F, Kobayashi T, Hirata M, Sugimoto Y, Narumiya S. Ligand binding specificities of the eight types and subtypes of the mouse prostanoid receptors expressed in Chinese hamster ovary cells. Br J Pharmacol. 1997;122:217–224. doi: 10.1038/sj.bjp.0701367. [DOI] [PMC free article] [PubMed] [Google Scholar]
- Knittel T, Kobold D, Piscaglia F, Saile B, Neubauer K, Mehde M, et al. Localization of liver myofibroblasts and hepatic stellate cells in normal and diseased rat livers: distinct roles of (myo-)fibroblast subpopulations in hepatic tissue repair. Histochem Cell Biol. 1999a;112:387–401. doi: 10.1007/s004180050421. [DOI] [PubMed] [Google Scholar]
- Knittel T, Kobold D, Saile B, Grundmann A, Neubauer K, Piscaglia F, et al. Rat liver myofibroblasts and hepatic stellate cells: different cell populations of the fibroblast lineage with fibrogenic potential. Gastroenterology. 1999b;117:1205–1221. doi: 10.1016/s0016-5085(99)70407-5. [DOI] [PubMed] [Google Scholar]
- Kojima N, Hori M, Murata T, Morizane Y, Ozaki H. Different profiles of Ca2+ responses to endothelin-1 and PDGF in liver myofibroblasts during the process of cell differentiation. Br J Pharmacol. 2007;151:816–827. doi: 10.1038/sj.bjp.0707269. [DOI] [PMC free article] [PubMed] [Google Scholar]
- Laleman W, Landeghem L, Wilmer A, Fevery J, Nevens F. Portal hypertension: from pathophysiology to clinical practice. Liver Int. 2005;25:1079–1090. doi: 10.1111/j.1478-3231.2005.01163.x. [DOI] [PubMed] [Google Scholar]
- Laleman W, Van Landeghem L, Severi T, Vander Elst I, Zeegers M, Bisschops R, et al. Both Ca2+ -dependent and -independent pathways are involved in rat hepatic stellate cell contraction and intrahepatic hyperresponsiveness to methoxamine. Am J Physiol Gastrointest Liver Physiol. 2007;292:G556–564. doi: 10.1152/ajpgi.00196.2006. [DOI] [PubMed] [Google Scholar]
- Maruyama T, Murata T, Ayabe S, Hori M, Ozaki H. Prostaglandin D(2) induces contraction via thromboxane A(2) receptor in rat liver myofibroblasts. Eur J Pharmacol. 2008;591:237–242. doi: 10.1016/j.ejphar.2008.06.037. [DOI] [PubMed] [Google Scholar]
- Melton AC, Datta A, Yee HF., Jr Ca2+]i-independent contractile force generation by rat hepatic stellate cells in response to endothelin-1. Am J Physiol Gastrointest Liver Physiol. 2006;290:G7–13. doi: 10.1152/ajpgi.00337.2005. [DOI] [PubMed] [Google Scholar]
- Mohammed NA, Abd El-Aleem SA, El-Hafiz HA, McMahon RF, El-Aleem SA. Distribution of constitutive (COX-1) and inducible (COX-2) cyclooxygenase in postviral human liver cirrhosis: a possible role for COX-2 in the pathogenesis of liver cirrhosis. J Clin Pathol. 2004;57:350–354. doi: 10.1136/jcp.2003.012120. [DOI] [PMC free article] [PubMed] [Google Scholar]
- Muid RE, Dale MM, Davis PD, Elliott LH, Hill CH, Kumar H, et al. A novel conformationally restricted protein kinase C inhibitor, Ro 31-8425, inhibits human neutrophil superoxide generation by soluble, particulate and post-receptor stimuli. FEBS Lett. 1991;293:169–172. doi: 10.1016/0014-5793(91)81178-b. [DOI] [PubMed] [Google Scholar]
- Narumiya S, Sugimoto Y, Ushikubi F. Prostanoid receptors: structures, properties, and functions. Physiol Rev. 1999;79:1193–1226. doi: 10.1152/physrev.1999.79.4.1193. [DOI] [PubMed] [Google Scholar]
- Neuschafer-Rube F, Puschel GP, Jungermann K. Characterization of prostaglandin-F2 alpha-binding sites on rat hepatocyte plasma membranes. Eur J Biochem. 1993;211:163–169. doi: 10.1111/j.1432-1033.1993.tb19883.x. [DOI] [PubMed] [Google Scholar]
- Neyrinck AM, Margagliotti S, Gomez C, Delzenne NM. Kupffer cell-derived prostaglandin E2 is involved in regulation of lipid synthesis in rat liver tissue. Cell Biochem Funct. 2004;22:327–332. doi: 10.1002/cbf.1110. [DOI] [PubMed] [Google Scholar]
- Pestel S, Jungermann K, Gotze O, Schieferdecker HL. Inhibition by prostaglandin E(2) of anaphylatoxin C5a- but not zymosan-induced prostanoid release from rat Kupffer cells. Lab Invest. 2002;82:463–471. doi: 10.1038/labinvest.3780439. [DOI] [PubMed] [Google Scholar]
- Pinzani M, Milani S, De Franco R, Grappone C, Caligiuri A, Gentilini A, et al. Endothelin 1 is overexpressed in human cirrhotic liver and exerts multiple effects on activated hepatic stellate cells. Gastroenterology. 1996;110:534–548. doi: 10.1053/gast.1996.v110.pm8566602. [DOI] [PubMed] [Google Scholar]
- Planaguma A, Claria J, Miquel R, Lopez-Parra M, Titos E, Masferrer JL, et al. The selective cyclooxygenase-2 inhibitor SC-236 reduces liver fibrosis by mechanisms involving non-parenchymal cell apoptosis and PPARgamma activation. FASEB J. 2005;19:1120–1122. doi: 10.1096/fj.04-2753fje. [DOI] [PubMed] [Google Scholar]
- Qian YM, Jones RL, Chan KM, Stock AI, Ho JK. Potent contractile actions of prostanoid EP3-receptor agonists on human isolated pulmonary artery. Br J Pharmacol. 1994;113:369–374. doi: 10.1111/j.1476-5381.1994.tb16997.x. [DOI] [PMC free article] [PubMed] [Google Scholar]
- Ramadori G, Saile B. Mesenchymal cells in the liver – one cell type or two? Liver. 2002;22:283–294. doi: 10.1034/j.1600-0676.2002.01726.x. [DOI] [PubMed] [Google Scholar]
- Ramm GA, Li L, Britton RS, O'Neill R, Bacon BR. Effect of protein kinase C activation and inhibition on rat hepatic stellate cell activation. Dig Dis Sci. 2003;48:790–796. doi: 10.1023/a:1022857313917. [DOI] [PubMed] [Google Scholar]
- Reynaert H, Vaeyens F, Qin H, Hellemans K, Chatterjee N, Winand D, et al. Somatostatin suppresses endothelin-1-induced rat hepatic stellate cell contraction via somatostatin receptor subtype 1. Gastroenterology. 2001;121:915–930. doi: 10.1053/gast.2001.27971. [DOI] [PubMed] [Google Scholar]
- Reynaert H, Thompson MG, Thomas T, Geerts A. Hepatic stellate cells: role in microcirculation and pathophysiology of portal hypertension. Gut. 2002;50:571–581. doi: 10.1136/gut.50.4.571. [DOI] [PMC free article] [PubMed] [Google Scholar]
- Saile B, Matthes N, Neubauer K, Eisenbach C, El-Armouche H, Dudas J, et al. Rat liver myofibroblasts and hepatic stellate cells differ in CD95-mediated apoptosis and response to TNF-alpha. Am J Physiol Gastrointest Liver Physiol. 2002;283:G435–444. doi: 10.1152/ajpgi.00441.2001. [DOI] [PubMed] [Google Scholar]
- Sandulache VC, Parekh A, Li-Korotky HS, Dohar JE, Hebda PA. Prostaglandin E2 differentially modulates human fetal and adult dermal fibroblast migration and contraction: implication for wound healing. Wound Repair Regen. 2006;14:633–643. doi: 10.1111/j.1743-6109.2006.00156.x. [DOI] [PubMed] [Google Scholar]
- Shah V, Garcia-Cardena G, Sessa WC, Groszmann RJ. The hepatic circulation in health and disease: report of a single-topic symposium. Hepatology. 1998;27:279–288. doi: 10.1002/hep.510270141. [DOI] [PubMed] [Google Scholar]
- Somlyo AP, Somlyo AV. Ca2+ sensitivity of smooth muscle and nonmuscle myosin II: modulated by G proteins, kinases, and myosin phosphatase. Physiol Rev. 2003;83:1325–1358. doi: 10.1152/physrev.00023.2003. [DOI] [PubMed] [Google Scholar]
- Steinberg SF. Distinctive activation mechanisms and functions for protein kinase Cdelta. Biochem J. 2004;384:449–459. doi: 10.1042/BJ20040704. [DOI] [PMC free article] [PubMed] [Google Scholar]
- Sugimoto Y, Narumiya S. Prostaglandin E receptors. J Biol Chem. 2007;282:11613–11617. doi: 10.1074/jbc.R600038200. [DOI] [PubMed] [Google Scholar]
- Takahashi A, Camacho P, Lechleiter JD, Herman B. Measurement of intracellular calcium. Physiol Rev. 1999;79:1089–1125. doi: 10.1152/physrev.1999.79.4.1089. [DOI] [PubMed] [Google Scholar]
- Tangkijvanich P, Tam SP, Yee HF., Jr Wound-induced migration of rat hepatic stellate cells is modulated by endothelin-1 through rho-kinase-mediated alterations in the acto-myosin cytoskeleton. Hepatology. 2001;33:74–80. doi: 10.1053/jhep.2001.20677. [DOI] [PubMed] [Google Scholar]
- Tateaki Y, Ogawa T, Kawada N, Kohashi T, Arihiro K, Tateno C, et al. Typing of hepatic nonparenchymal cells using fibulin-2 and cytoglobin/STAP as liver fibrogenesis-related markers. Histochem Cell Biol. 2004;122:41–49. doi: 10.1007/s00418-004-0666-0. [DOI] [PubMed] [Google Scholar]
- Tomasek JJ, Gabbiani G, Hinz B, Chaponnier C, Brown RA. Myofibroblasts and mechano-regulation of connective tissue remodelling. Nat Rev Mol Cell Biol. 2002;3:349–363. doi: 10.1038/nrm809. [DOI] [PubMed] [Google Scholar]
- Vary TC, Goodman S, Kilpatrick LE, Lynch CJ. Nutrient regulation of PKCepsilon is mediated by leucine, not insulin, in skeletal muscle. Am J Physiol Endocrinol Metab. 2005;289:E684–694. doi: 10.1152/ajpendo.00613.2004. [DOI] [PubMed] [Google Scholar]
- Ward JP, Knock GA, Snetkov VA, Aaronson PI. Protein kinases in vascular smooth muscle tone – role in the pulmonary vasculature and hypoxic pulmonary vasoconstriction. Pharmacol Ther. 2004;104:207–231. doi: 10.1016/j.pharmthera.2004.08.009. [DOI] [PubMed] [Google Scholar]
- Way KJ, Chou E, King GL. Identification of PKC-isoform-specific biological actions using pharmacological approaches. Trends Pharmacol Sci. 2000;21:181–187. doi: 10.1016/s0165-6147(00)01468-1. [DOI] [PubMed] [Google Scholar]
- Yamamoto H, Kondo M, Nakamori S, Nagano H, Wakasa K, Sugita Y, et al. JTE-522, a cyclooxygenase-2 inhibitor, is an effective chemopreventive agent against rat experimental liver fibrosis1. Gastroenterology. 2003;125:556–571. doi: 10.1016/s0016-5085(03)00904-1. [DOI] [PubMed] [Google Scholar]