

Abstract
Many G protein-coupled receptors have been shown to exist as oligomers, but the oligomerization state and the effects of this on receptor function are unclear. For some G protein-coupled receptors, in ligand binding assays, different radioligands provide different maximal binding capacities. Here we have developed mathematical models for co-expressed dimeric and tetrameric species of receptors. We have considered models where the dimers and tetramers are in equilibrium and where they do not interconvert and we have also considered the potential influence of the ligands on the degree of oligomerization. By analogy with agonist efficacy, we have considered ligands that promote, inhibit or have no effect on oligomerization. Cell surface receptor expression and the intrinsic capacity of receptors to oligomerize are quantitative parameters of the equations. The models can account for differences in the maximal binding capacities of radioligands in different preparations of receptors and provide a conceptual framework for simulation and data fitting in complex oligomeric receptor situations.
Keywords: binding capacity, cell surface receptor expression, G protein-coupled receptors, ligand binding, oligomerization, receptor dimerization
Introduction
There has been much discussion recently about the oligomeric status of G protein-coupled receptors (GPCRs). For many years, GPCRs were considered to be monomeric. Indeed, most theories of GPCR action until recently have assumed a monomeric receptor. Increasing evidence, however, suggests that these receptors may actually form dimers or higher order oligomers, both homodimers/oligomers and heterodimers/oligomers (Milligan and Smith, 2007; Milligan, 2008). Family C GPCRs exist as stable dimers [recently, it has been shown that metabotropic glutamate receptors (mGluRs) assemble into strict dimers whereas GABAB receptors spontaneously form dimers of heterodimers (Maurel et al., 2008)], and evidence to support dimer/oligomer formation for other GPCRs comes from a variety of experimental approaches including atomic force microscopy, resonance energy transfer methods and both equilibrium and kinetic radioligand binding studies (Mercier et al., 2002; Liang et al., 2003; Ma et al., 2007; Sohy et al., 2007; Maurel et al., 2008). Despite these observations, the stoichiometry of receptor oligomerization is far from being defined; on the contrary, a vigorous debate is, currently, in progress regarding whether rhodopsin is dimeric in native retinal rods (Chabre et al., 2003; Fotiadis et al., 2003) and regarding the proper interpretation of bioluminescence resonance energy transfer (BRET) data and its application to GPCR oligomerization analysis (James et al., 2006; Bouvier et al., 2007). A particular aspect of the problem is whether there is a requirement for the receptor to be dimeric to be fully functional, because recent results suggest that a monomeric receptor is sufficient to activate G proteins (Meyer et al., 2006; Bayburt et al., 2007; White et al., 2007; Whorton et al., 2007). In this regard, it has been pointed out that a key question is not whether isolated monomeric receptors are able to activate G proteins but rather, if GPCRs are delivered to the cell surface as dimers/oligomers, are they also pre-associated with G proteins (Milligan, 2008); similarly, it has been suggested that to understand the biological role of receptor dimerization we must focus on receptor functions other than those concerning G-protein activation (Gurevich and Gurevich, 2008b). This exciting controversy between experiments and between experimentalists can be moderated, at least in part, by more eclectic positions. The answer to the problem may be not the same for all GPCRs, or even for a single receptor at different stages of its life cycle (Gurevich and Gurevich, 2008a).
The dimerization/oligomerization of GPCRs has been modelled by several authors [see (Colquhoun, 1973; Wells, 1992; Christopoulos and Kenakin, 2002) for thoughtful mathematical modelling and analysis]. A generic model for oligomerization of GPCRs has been provided [see, e.g. (Wreggett and Wells, 1995)] based on a receptor with n subunits, and this has been extended to include inactive and active states (Ma et al., 2007). Other authors have generated simpler models that follow the same general principles (Armstrong and Strange, 2001; Durroux, 2005; Franco et al., 2006); of note is the recent model developed for the constitutively dimeric mGluRs, which integrates the extracellular ligand binding domain and the heptahelical domain responsible for G-protein activation (Rovira et al., 2008). These models provide good descriptions of some of the behaviours exhibited by GPCRs that cannot be explained by using a monomer model.
One aspect of GPCR behaviour that has been attributed to dimer/oligomer formation is the anomalous ligand binding of different radioligands. For muscarinic acetylcholine receptors it has been shown that different radioligands ([3H]QNB, [3H]NMS) exhibit different maximal binding capacities but, nevertheless, full cross competition occurs between the ligands (Wreggett and Wells, 1995; Ma et al., 2007). This has been modelled by using the general cooperativity model outlined above, and a tetramer has been shown to provide a good description of the data. Differences in the relative maximal binding capacities of radioligands have been observed in different preparations of receptors and attributed to differences in cooperativity (Wreggett and Wells, 1995). It has also been reported that the cooperativity exhibited by the muscarinic acetylcholine receptor can be manipulated by detergents and that this may reflect differences in the presentation of the oligomer or oligomers of this receptor (Park et al., 2002).
For the D2 dopamine receptor expressed in Chinese hamster ovary (CHO) cells, [3H]spiperone and [3H]raclopride labelled similar numbers of sites when assayed in the presence of Na+, but in the absence of Na+ the maximal binding capacity of [3H]raclopride was about half that of [3H]spiperone. Despite this there was full cross competition between the two ligands with Hill coefficients close to unity. This could be modelled by using a simple dimer model with negative cooperativity between successive equivalents of raclopride (Armstrong and Strange, 2001). Similar ligand binding behaviour has been reported for the native D2 receptor in brain (Hall et al., 1990) suggesting that these observations have some generality. For the D2 dopamine receptor expressed in Sf9 insect cells, qualitatively similar behaviour was observed (Vivo et al., 2006). In this study, three radioligands were used ([3H]spiperone, [3H]nemonapride and [3H]raclopride). The three radioligands exhibited different maximal binding capacities in the presence and absence of Na+. There was full cross competition between ligands and, in some cases, Hill coefficients less than one were seen. The detailed ligand binding characteristics seemed to be dependent on the preparation of membranes used. In this latter case it was suggested that negatively cooperative effects in an oligomer (at least a hexamer) could account for the differences in maximal binding capacity [see (Giraldo, 2008) for a discussion on curve fitting and cooperativity properties in the context of dimeric receptors].
It seems, therefore, that there may be differences in the cooperative properties of GPCRs in different preparations and under different conditions. Whereas these may be described by using cooperative models in a single oligomer it is important to consider other models to describe such behaviour.
One possibility is that different oligomeric species are co-expressed. In the present report we have examined the effects of co-expression of dimeric and tetrameric species of receptors. Our aim was to provide a quantitative formalism for the interpretation of intermediate plateaus, in particular 1/4, 1/2 and 3/4, in fractional saturation binding curves in the context of systems made up of dimers and higher-order (tetramers) oligomers. Although the existence of receptor monomers cannot be ruled out in the analysis of complex binding isotherms, the inclusion of monomer species would increase the complexity of the system without providing extra concepts to the rationale used. Thus, monomer receptor species were not included in the modelling. We have examined dimer/tetramer models with and without equilibration between the species, and we have also included effects of ligands on the equilibrium. We show that such models can account for differences in the maximal binding capacities of radioligands in different preparations of receptors.
A receptor composed of two oligomeric states (dimer/tetramer) in equilibrium
In the following model, it is supposed that the receptor is present in the cell membrane in two oligomeric forms, dimer and tetramer. The equilibrium between these species and the pharmacological consequences are analysed. The analysis was performed first in the absence of ligand.
Equation 1 shows the formation reaction of a tetramer molecule from two dimer molecules.
| (1) |
where [R2] and [R4] are the concentrations of dimer and tetramer species respectively, and  is the formation constant. The equilibrium constant L may be considered, in general, as the intrinsic index of the receptor to constitutively form higher order oligomers.
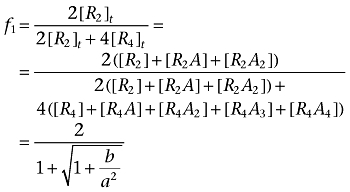
We can derive the fraction of receptor sites found either as dimer (f1) or tetramer (f2) arrays (Equations 2 and 3).
 |
(2) |
 |
(3) |
where Rb = 2[R2] + 4[R4] is the total concentration of receptor sites. We see that the oligomeric arrangement of a receptor depends on both its intrinsic propensity for oligomerization (L) and its cellular expression (Rb), where an increase in either of these quantities leads to an increase in the extent of receptor oligomerization. Figure 1 depicts theoretical curves of the variation of both f1 and f2 with the common logarithm of Rb for three values of L. For a particular L value, f1 and f2 curves cross at  . For Rb lower than
  the dimer is predominant whereas for Rb greater than
  the predominant species is the tetramer. Increasing L shifts the curves to the left. This means that for greater values of L, the receptor expression (Rb) needed for changing the receptor oligomerization degree from dimer to tetramer is lower. By contrast, for higher values of Rb the receptor is arranged mostly as a tetramer even for those receptor species having a reduced tendency to oligomerize (L << 1).
Figure 1.

Variation of the fraction of receptor sites (f) either in dimers (f1) or in tetramers (f2) with the common logarithm of the total concentration of receptor sites (logRb) for three values of the dimer/tetramer conversion constant (L), in the absence of ligand. For this interconvertible dimer/tetramer receptor system, the tetramer is more stable than the dimer for high Rb values. The value of L determines the location of the curve along the abscissa axis, with the curves mid-points displaced to the left for high L values.
Another parameter describing receptor distribution is the total concentration of receptor molecular species, Rt, defined as Rt = [R2] + [R4]. It is worth noting the differences in the definition between Rt and Rb parameters. Rb is the concentration of receptor sites and is independent of the oligomerization dynamics, whereas Rt is the concentration of receptor molecular entities (R2 and R4), which is dependent of the oligomerization degree. The relationship between Rb and Rt is given by the equation:
 |
(4) |
The limits of Rt when L tends to 0 or to infinity are Rb/2 and Rb/4 respectively, showing that when the receptor is fully expressed as a dimer the number of receptor sites is twice the total receptor concentration and when the receptor is fully expressed as a tetramer the number of receptor sites is four times the total receptor concentration. Note that Rt is lower or greater as the tendency of the receptor to oligomerize (measured by L) is greater or lower respectively.
Equation 5 shows the number of receptor sites per receptor molecule (Rb/Rt) as a function of Rb and L.
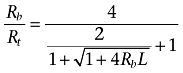 |
(5) |
The ratio between Rb and Rt ranges between 2 and 4, depending on the product of Rb and L. Figure 2 depicts the variation of Rb/Rt for the same conditions considered in Figure 1. This Figure clearly shows that the oligomerization degree (Rb/Rt) depends directly on the receptor expression level (Rb), and that the curves are left- or right-shifted depending on whether the receptor is more stable as a tetramer or as a dimer respectively [see (Kroeger et al., 2001) for data indicating that the degree of receptor oligomerization is influenced by the level of cell surface receptor expression].
Figure 2.
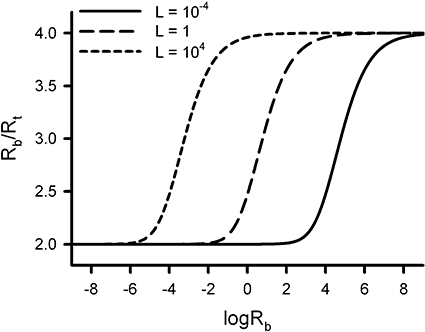
Variation of the number of receptor sites per receptor molecule (Rb/Rt) with the logarithm of the total concentration of receptor sites (logRb) for three values of the dimer/tetramer conversion constant (L), in the absence of ligand. The ordinate values range between 2 (dimer) and 4 (tetramer). The localization of the curves along the abscissa axis, which measures the proportion of dimers and tetramers for a given level of receptor expression (Rb), depends on L. The population of receptor tetramers increases as L increases.
The effect of ligand on the dynamics of receptor oligomerization
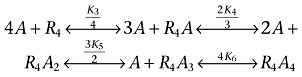
Equation 6 includes the equilibrium between dimer and tetramer receptor states in the presence of ligand.
| (6) |
 |
where  ,
,  ,
,  ,
,  ,
,  ,
,
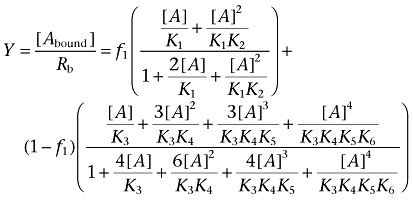
Analogously to the previous case, we denote f1 as the total concentration of receptor sites belonging to dimer receptors relative to the total concentration of receptor sites.
 |
where
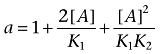 |
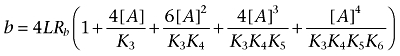 |
| (7) |
Note that b > 0, 1 + b/a2 > 1, and f1 < 1.
We see that f1 is a function of the ligand-receptor dissociation constants (K1 to K6), the total concentration of receptor sites or receptor expression (Rb), the propensity of the dimeric receptor to increase the oligomerization level (L) and the concentration of the ligand ([A]). We can consider the lower ([A]→0) and the upper ([A]→∞) asymptotes of the variation of f1 with [A].
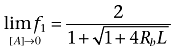 |
(8) |
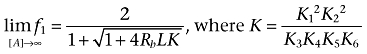 |
(9) |
As expected, the limit of f1 as [A] goes to 0 (Equation 8) matches the expression of f1 in the absence of ligand (Equation 2). Interestingly, Equation 9 captures the capability of a ligand of increasing, decreasing or not affecting receptor oligomerization through the ligand-receptor oligomerization constant K; that is, K > 1 (positive oligomerizator), K < 1 (negative oligomerizator) and K = 1 (neutral oligomerizator) respectively. Here, the term oligomerizator denotes a ligand able to alter the intrinsic oligomerization equilibrium of a receptor given by Equation 1[see (Vidi et al., 2008) for data showing ligand-dependent oligomerization of dopamine D2 and adenosine A2A receptors].
Figure 3 displays the variation of the number of receptor sites per receptor molecule (Rb/Rt) with the logarithm of ligand concentration for three different ligands: a neutral oligomerizator (K = 1), a positive oligomerizator (K = 1012) and a negative oligomerizator (K = 10−12). We have used the condition [R2] = [R4], which produces a value of three for Rb/Rt in the absence of ligand, to better illustrate the behaviour of these ligands. We see that the neutral oligomerizator does not alter the Rb/Rt value, the positive oligomerizator changes asymptotically the initial value to four and, in contrast, the negative oligomerizator changes the initial Rb/Rt value to two.
Figure 3.
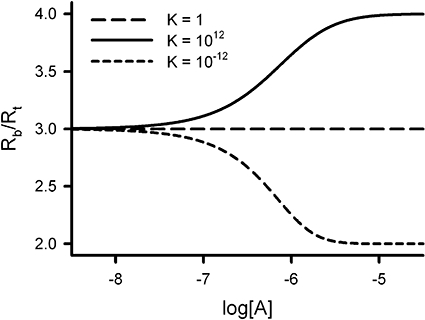
Variation of the number of receptor sites per receptor molecule (Rb/Rt) with the logarithm of ligand concentration (log[A]) for three different ligands: neutral oligomerizator (K1 to K6 = 10−6; K = 1), positive oligomerizator (K1 = K2 = 10−3, K3 to K6 = 10−6; K = 1012 > 1) and negative oligomerizator (K1 = K2 = 10−6, K3 to K6 = 10−3; K = 10−12 < 1). Fixed values in the three simulations were L = 106 and Rb = 6/L. The latter condition ensures that in the absence of ligand [R2] = [R4] and Rb/Rt = 3. The initial ordinate value does not change with [A] for a neutral oligomerizator, increases up to four with [A] for a positive oligomerizator and decreases up to two with [A] for a negative oligomerizator.
Analysing the fraction of bound ligand in an interconvertible dimer/tetramer receptor
The total concentration of bound ligand is the sum of two quantities, one bound to dimeric receptors and the other to tetrameric receptors.
| (10) |
where 
Equation 11 gives the fraction of bound ligand relative to the total concentration of binding sites.
 |
(11) |
where f1 is defined in Equation 7.
The implications of Equation 11 on the ligand binding behaviour were analysed graphically. Figure 4 depicts the variation of Y with log[A] for three values (10−4, 1 and 104) of the dimer/tetramer conversion constant (L). We fixed the values of the total concentration of receptor sites (Rb = 10−6) and the dissociation equilibrium constants (K1 = 10−6, K2 = 1020, K3 = 10−6, K4 = 10−6, K5 = 10−6 and K6 = 1020). We have used extremely large values for K2 and K6 dissociation constants to prevent the occupation of the second site of the dimer and the fourth site of the tetramer (see Equation 6). The given set of binding constants yields an oligomerization constant of K = 1026, which corresponds to an extremely positive oligomerizator ligand. We see that in the three simulations, the upper asymptote is 1, which is the theoretically expected maximum value. It is worth noting, however, that, depending on the system parameter values, this value could only be reached at experimentally unattainable [A] values. In addition, intermediate plateaus can be observed, which could give the false impression that the maximum binding is lower than unity in the case of finishing the binding experiment at relatively low [A] values. In this particular case, a plateau at Y = 3/4 is obtained for each of the three values used of L whereas a plateau at Y = 1/2 is found for both L = 10−4 and L = 1 (the latter being less well defined) but not for L = 104. Using Equation 8, we can calculate the relative fractional populations of the dimer in the absence of ligand. Values of 1.00, 1.00 and 0.99 are obtained for L = 10−4, 1 and 104 respectively, which show that, at low ligand concentration, receptors are mostly in dimer forms. Because the ligand is a positive oligomerizator, it induces tetramer formation as ligand concentration increases. The conversion of dimer into tetramer is reached for lower ligand concentrations as the value of L is increased. The plateaus at Y = 1/2 correspond to the [R2A] species (singly occupied dimer). This plateau is not observed for L = 104 because its presence is masked by the more rapid formation of the tetramer. The plateaus at Y = 3/4 correspond to [R4A3] species (triply occupied tetramer). In addition, it is worth noting that, both for the dimer and the tetramer, the test binding constants used correspond to an extremely negatively cooperative system.
Figure 4.
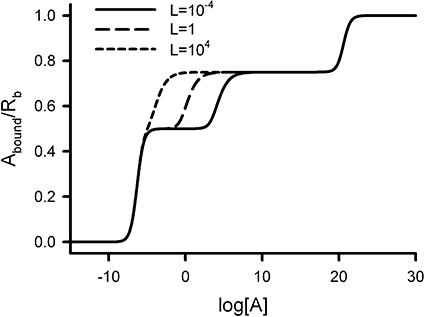
The dimer and tetramer model with interconvertible oligomeric states. The graph shows the variation of the amount of ligand bound per receptor site (Y = Abound/Rb) with the logarithm of ligand concentration (log[A]) for three values of the dimer/tetramer conversion constant (L). Fixed values used for the system parameters were Rb = 10−6, K1 = 10−6, K2 = 1020, K3 = 10−6, K4 = 10−6, K5 = 10−6 and K6 = 1020. Two intermediate plateaus are depicted at Y = 0.5 and 0.75.
As shown in the above example, the number of sites per molecular entity determines the number of possible plateaus. Thus, for the interconvertible dimer/tetramer system, theoretical plateaus are possible at Y equal to 1/2 and 1 for the dimer and Y equal to 1/4, 1/2, 3/4, and 1 for the tetramer. It is worth noting, that other values can be achieved for higher oligomers; thus, if a hexamer is present in the system new plateaus can be obtained for Y equal to 1/6, 1/3, 2/3 and 5/6.
The dimer and tetramer states of the receptor may not be in equilibrium
There exists also the possibility that the two receptor oligomer populations (dimers and tetramers) are fixed either because they do not interconvert or because the kinetics of oligomerization are much slower than that of ligand binding. Given this assumption, all the equilibrium constants of Equation 6 remain in the calculations except that for the oligomerization equilibrium (L).
The fraction of bound ligand can be assessed as in Equation 11. However, the fractions of the receptor oligomeric species, f1 and (1 − f1), are not dependent now on the equilibrium constant L, contrary to what was seen above with the interconvertible oligomeric states, for which f1 depended on L through Equation 7; instead, f1 and (1 − f1) remain constant and independent of [A]. This feature profoundly affects the Y profiles, allowing the formation of intermediate plateaus at Y values different from those resulting from the number of sites in any of the molecular oligomeric species included in the system. To illustrate this property, Figure 5 displays a collection of nine curves with intermediate plateaus ranging between 0.525 and 0.725 Y values as f1 varies between 0.9 (lower intermediate asymptote) and 0.1 (upper intermediate asymptote). In interpreting this oligomer system, which is not in rapid equilibrium, it is worth mentioning that, as in the simulation used for the equilibrium case, binding to the last binding sites in dimers and tetramers is artificially prevented using extremely large K2 and K6. Because of this restriction, the plateaus of the curves reflect the occupation of the first site of the dimer and the third site of the tetramer. As more tetramers are present in the system (f1 decreases), the values of the intermediate plateaus (apparent Bmax) increase, and the plateaus progressively resemble that of the pure tetramer. Note that because of the oligomer mixture composition, the intermediate plateaus of Figure 5 range between 0.525 (90% dimer + 10% tetramer) and 0.725 (10% dimer + 90% tetramer) and not between 0.5 and 0.75, which would correspond to pure dimer and tetramer species respectively.
Figure 5.
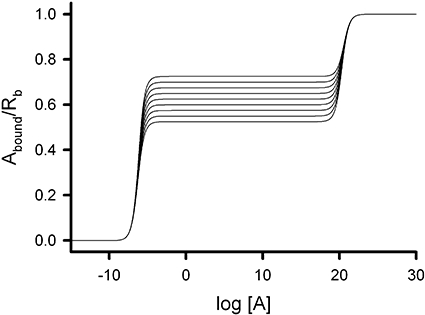
The dimer and tetramer model with independent oligomeric states. The graph shows the variation of the ligand bound per receptor site (Y = Abound/Rb) with the logarithm of ligand concentration (log[A]) for the fraction of the dimer state varying from 0.1 (upper intermediate asymptote) to 0.9 (lower intermediate asymptote) by 0.1. Fixed values used for the system parameters were K1 = 10−6, K2 = 1020, K3 = 10−6, K4 = 10−6, K5 = 10−6 and K6 = 1020. Intermediate plateaus are found between 0.525 (90% dimer + 10% tetramer) and 0.725 (10% dimer + 90% tetramer).
How can the model be used in experimental situations?
In the previous sections a model for the coexistence of dimer and tetramer oligomers either in equilibrium or in non-equilibrium situations has been presented. Simulations performed on the model equations provided us with deeper insights into receptor aggregation features as, for example, the tendency to increase the oligomerization degree with the increase of the receptor expression level; the relationship between the observed plateaus in the fractional ligand binding curves and the ratio of potentially occupable sites to the total of sites per receptor molecule, for the equilibrium case; and the characterization of the ligand capacity to shift the degree of receptor aggregation.
Detection of the presence of more than one oligomeric species
It is important to ask whether the model can be used to detect, experimentally, the existence of two receptor oligomeric forms, say a dimer and a tetramer in equilibrium. Let us suppose a saturation binding curve with inner plateaus at 1/4, 1/2 and 3/4 values, which are compatible with a receptor tetramer. As the 1/2 value can also be obtained from a dimer receptor, the additional presence of this form cannot be ruled out. How can we confirm its presence? An appropriate approach can be to change the receptor levels. The curve profile for the fraction of bound sites is independent of receptor concentration in the case of a pure receptor oligomeric form, but the same does not happen in the case of a mixture. An alteration of either the location of the curve along the x-axis or the number of intermediate plateaus is an indication of the coexistence of various oligomeric forms, where ligands may show different sensitivities to the alteration of total receptor concentration.
An example for the above discussion can be taken from the literature where the variation of the fractional saturation binding curves for [125I]EGF with EGF receptor concentration was analysed (Macdonald and Pike, 2008). This outcome was considered by the authors as a diagnostic feature of the presence of a mixture of receptor oligomer forms. Because it had been previously demonstrated that the EGF receptor can form dimers (Yarden and Schlessinger, 1987), the dependence of the fractional saturation binding curves with the level of receptor expression was fulfilled by a model in which unoccupied EGF receptor monomers are in a pre-existing equilibrium with unoccupied EGF receptor dimers (Macdonald and Pike, 2008).
The estimation of the constants of the model
Equation 11 gives the fraction of receptor bound sites as a function of ligand concentration. The Equation includes six ligand-receptor binding constants (K1 and K2 for the dimer and K3 to K6 for the tetramer) and a parameter indicating the relative population of the oligomer species (f1). In the equilibrium case, the f1 parameter is not a constant. On the contrary, it depends on the ligand concentration, the binding constants, the total number of receptor sites (Rb) and the association constant for oligomerization (L). Clearly, the model is over-parameterized for a single binding curve as the information provided by the dimeric receptor does not add features to the curve shape, which could be distinguished from those provided by the tetrameric receptor. To use the model, several curves should be obtained by changing the receptor expression level, with the minimum number of curves depending on the relative values of the binding constants and the receptor association constant L. Of note, this system variation affects only one of the model parameters, Rb, with the rest of the parameters keeping common values for all the curves. The Rb values can be obtained directly from the upper asymptote of each of the saturation binding curves and entered as constants during fitting. A global fitting of the model to the set of curves would allow us to obtain the parameter estimates, that is, the ligand-receptor binding constants and the association constant for tetramer formation. This strategy was followed in the above-mentioned example for the analysis of [125I]EGF binding to the oligomeric equilibrium between EGF receptor monomers and dimers, for which six isotherms were used, with the number of receptors per cell ranging between 24 000 and 450 000. The estimated value for the equilibrium constant for the monomer – dimer association reaction was 5.3 × 10¹¹ (mol/dm2)−1, with the units resulting from expressing receptor concentration as a density per cell surface (Macdonald and Pike, 2008).
Conclusion
Based on the discussion above, it is clear that models of GPCRs where dimeric and tetrameric species are co-expressed can generate data that are not seen with simpler models where one species is expressed. Where there is equilibrium between the tetramer and dimer species, the model predicts that, in saturation binding experiments, ligands may exhibit Bmax values of 75%, 50% or 25% of a ligand that binds to all of the sites. Such behaviour may also be seen with a simple tetramer model but in that case it depends on differences in cooperativity. In the present case the behaviour results from a mixture of cooperativity and the potential of the receptor to exist as a tetramer or dimer. Modulation of the tetramer/dimer state may, in principle, also affect the signalling properties of the receptor. Where there is no equilibration between the tetramer/dimer species, this new model allows Bmax values other than the 25%/50%/75% values mentioned earlier. This is a unique feature of the model.
It is important to ask, however, whether the complexity of the new models is justified based on data in the literature. One of the most comprehensive sets of data on this topic comes from the work of Wells on muscarinic acetylcholine receptors. For example, in a study on the M2 muscarinic acetylcholine receptor expressed in Sf9 cells, purified and then reconstituted, a tetramer model provided a good description of the ligand binding properties and in particular the differences in Bmax for different radioligands (Ma et al., 2007). Other models including co-expressed dimers and monomers were considered but provided no improvement in description. Similar models have been invoked to describe the ligand binding behaviour of muscarinic receptors in other systems.
For the D2 dopamine receptor, however, more complexity appears. Whereas for the D2 receptor expressed in CHO cells a simple dimer model with negative cooperativity (Armstrong and Strange, 2001) suffices to describe the ligand binding data, for the receptor expressed in Sf9 cells a more complex model is required (Vivo et al., 2006). In this system, differences in relative Bmax values for different radioligands were seen in different preparations. This behaviour cannot be explained with a single species model and suggest more complexity, perhaps mixtures of different size oligomers not in equilibrium. The potential role of microdomain localization, such as cholesterol-rich regions, on the organization of GPCRs into higher-order oligomers has recently been highlighted (Guo et al., 2008). Whether a collection of independent microdomains with heterogeneous receptor oligomeric populations is the cause of the complex behaviour of D2 receptor is an issue that requires further investigation.
Recently, the location of at least four D2 dopamine receptors in close molecular proximity at the plasma membrane of living mammalian cells has been demonstrated by combining bioluminescence/fluorescence complementation and energy transfer techniques (Guo et al., 2008). Moreover, cross-linking experiments showed that this higher-order organization was unaltered over a 100-fold range of receptor expression that includes physiological levels of expression. The existence of multiple receptor interfaces, in particular those involving the first and fourth transmembrane segments, was assessed (Guo et al., 2008). The independence of the higher order organization on expression level found in this study (at least in the range examined) suggests that a single oligomeric species rather than a mixture is present. Importantly, the interface arrangement raises the issue of the functional basis of crosstalk between receptor protomers, after the demonstration that, for both rhodopsin (Bayburt et al., 2007) and β2-adrenoceptors (Whorton et al., 2007), one single receptor suffices to signal efficiently to G proteins when reconstituted into lipid nanodiscs. Without direct evidence, possible hypotheses may be investigated on the fine tuning that cooperativity may yield both for binding and function. In addition, we can speculate that oligomerization may provide functions lacking in individual protomers. As was shown for homodimeric mGluRs (Kniazeff et al., 2004), a mutant receptor that was fully inactivated when expressed alone could be in part recovered by its wild-type counterpart when expressed as a dimer.
Mathematical modelling can be useful for both the analysis of ligand-receptor cooperativity interactions and the quantitative evaluation of the functional crosstalk between protomers, as has been recently shown for homodimeric mGluRs (Rovira et al., 2008). Moreover, theoretical approaches as those followed here for the examination of the stoichiometry of receptor oligomerization can provide complementary information to recently reported experimental methodologies (Gandia et al., 2008; Maurel et al., 2008).
Receptor dimerization involves the occurrence of not only homodimers but also of heterodimers. This seems logical as nature typically explores the viability of all combinations of single elements. As a corollary to this, higher-order oligomerization involving heteroreceptors is expected. Recently, higher-order hetero-oligomers in the plasma membrane have been identified by combining BRET and fluorescence resonance energy transfer techniques (Carriba et al., 2008), showing that the limit of receptor complexity is far from being reached. Furthermore, in the same way as receptor heterodimerization has opened new avenues for the therapeutic interest of the direct interactions between receptors belonging to different GPCR classes (see Dalrymple et al., 2008 and references therein), higher-order receptor hetero-oligomerization may represent an important system for cell signalling and, consequently, for drug discovery. Modelling higher-order receptor hetero-oligomerization is beyond the scope of this study, but some of the basics for future research on this field are presented here.
Another behaviour seen in GPCRs that may be relevant relates to the occurrence of high and low affinity agonist binding sites. Classically, this behaviour has been explained in terms of receptor coupled (RG) and uncoupled (R) to G protein. The two sets of sites could, however, be an expression of cooperativity in agonist binding (Potter et al., 1991). If this were the case then the models that are proposed will limit the relative numbers of the two sets of sites. In many cases the two sets of sites are found experimentally to be in approximately equal proportions. This would then be in accord with a simple dimer or tetramer model with negative cooperativity. There are, however, reports of different percentages of higher affinity states in some systems. For example for the D2 dopamine receptor expressed in Sf9 cells, the proportion is ∼30% (Nickolls and Strange, 2003). It is difficult to know if this is a result of negative cooperativity in a tetramer, whether it supports the idea of a dimer/tetramer model with no equilibration or whether it reflects the R/G ratio.
Acknowledgments
This study was supported in part by Ministerio de Educación y Ciencia (SAF2007-65913) and Fundació La Marató de TV3 (Ref. 070530). The authors are grateful to the anonymous referees for their helpful comments.
Glossary
Abbreviations
- GPCR
G protein-coupled receptor
- BRET
bioluminescence resonance energy transfer
- FRET
fluorescence resonance energy transfer
- mGluR
metabotropic glutamate receptor
Conflict of interest
None.
References
- Armstrong D, Strange PG. Dopamine D2 receptor dimer formation: evidence from ligand binding. J Biol Chem. 2001;276:22621–22629. doi: 10.1074/jbc.M006936200. [DOI] [PubMed] [Google Scholar]
- Bayburt TH, Leitz AJ, Xie G, Oprian DD, Sligar SG. Transducin activation by nanoscale lipid bilayers containing one and two rhodopsins. J Biol Chem. 2007;282:14875–14881. doi: 10.1074/jbc.M701433200. [DOI] [PubMed] [Google Scholar]
- Bouvier M, Heveker N, Jockers R, Marullo S, Milligan G. BRET analysis of GPCR oligomerization: newer does not mean better. Nat Methods. 2007;4:3–4. doi: 10.1038/nmeth0107-3. [DOI] [PMC free article] [PubMed] [Google Scholar]
- Carriba P, Navarro G, Ciruela F, Ferre S, Casado V, Agnati L, et al. Detection of heteromerization of more than two proteins by sequential BRET-FRET. Nat Methods. 2008;5:727–733. doi: 10.1038/nmeth.1229. [DOI] [PubMed] [Google Scholar]
- Chabre M, Cone R, Saibil H. Biophysics: is rhodopsin dimeric in native retinal rods? Nature. 2003;426:30–31. doi: 10.1038/426030b. [DOI] [PubMed] [Google Scholar]
- Christopoulos A, Kenakin T. G protein-coupled receptor allosterism and complexing. Pharmacol Rev. 2002;54:323–374. doi: 10.1124/pr.54.2.323. [DOI] [PubMed] [Google Scholar]
- Colquhoun D. The relationship between classical and cooperative models for drug action. In: Ran HP, editor. Drug receptors: a Symposium. Baltimore: University Park Press; 1973. pp. 149–182. [Google Scholar]
- Dalrymple MB, Pfleger KD, Eidne KA. G protein-coupled receptor dimers: functional consequences, disease states and drug targets. Pharmacol Ther. 2008;118:359–371. doi: 10.1016/j.pharmthera.2008.03.004. [DOI] [PubMed] [Google Scholar]
- Durroux T. Principles: a model for the allosteric interactions between ligand binding sites within a dimeric GPCR. Trends Pharmacol Sci. 2005;26:376–384. doi: 10.1016/j.tips.2005.05.006. [DOI] [PubMed] [Google Scholar]
- Fotiadis D, Liang Y, Filipek S, Saperstein DA, Engel A, Palczewski K. Atomic-force microscopy: rhodopsin dimers in native disc membranes. Nature. 2003;421:127–128. doi: 10.1038/421127a. [DOI] [PubMed] [Google Scholar]
- Franco R, Casadó V, Mallol J, Ferrada C, Ferré S, Fuxe K, et al. The two-state dimer receptor model: a general model for receptor dimers. Mol Pharmacol. 2006;69:1905–1912. doi: 10.1124/mol.105.020685. [DOI] [PubMed] [Google Scholar]
- Gandia J, Galino J, Amaral OB, Soriano A, Lluis C, Franco R, et al. Detection of higher-order G protein-coupled receptor oligomers by a combined BRET-BiFC technique. FEBS Lett. 2008;582:2979–2984. doi: 10.1016/j.febslet.2008.07.045. [DOI] [PubMed] [Google Scholar]
- Giraldo J. On the fitting of binding data when receptor dimerization is suspected. Br J Pharmacol. 2008;155:17–23. doi: 10.1038/bjp.2008.234. [DOI] [PMC free article] [PubMed] [Google Scholar]
- Guo W, Urizar E, Kralikova M, Mobarec JC, Shi L, Filizola M, et al. Dopamine D2 receptors form higher order oligomers at physiological expression levels. 2008. EMBO J doi: 10.1038/emboj.2008.153. [DOI] [PMC free article] [PubMed]
- Gurevich VV, Gurevich EV. GPCR monomers and oligomers: it takes all kinds. Trends Neurosci. 2008a;31:74–81. doi: 10.1016/j.tins.2007.11.007. [DOI] [PMC free article] [PubMed] [Google Scholar]
- Gurevich VV, Gurevich EV. How and why do GPCRs dimerize? Trends Pharmacol Sci. 2008b;29:234–240. doi: 10.1016/j.tips.2008.02.004. [DOI] [PMC free article] [PubMed] [Google Scholar]
- Hall H, Wedel I, Halldin C, Kopp J, Farde L. Comparison of the in vitro receptor binding properties of N-[3H]methylspiperone and [3H]raclopride to rat and human brain membranes. J Neurochem. 1990;55:2048–2057. doi: 10.1111/j.1471-4159.1990.tb05794.x. [DOI] [PubMed] [Google Scholar]
- James JR, Oliveira MI, Carmo AM, Iaboni A, Davis SJ. A rigorous experimental framework for detecting protein oligomerization using bioluminescence resonance energy transfer. Nat Methods. 2006;3:1001–1006. doi: 10.1038/nmeth978. [DOI] [PubMed] [Google Scholar]
- Kniazeff J, Bessis AS, Maurel D, Ansanay H, Prezeau L, Pin JP. Closed state of both binding domains of homodimeric mGlu receptors is required for full activity. Nat Struct Mol Biol. 2004;11:706–713. doi: 10.1038/nsmb794. [DOI] [PubMed] [Google Scholar]
- Kroeger KM, Hanyaloglu AC, Seeber RM, Miles LE, Eidne KA. Constitutive and agonist-dependent homo-oligomerization of the thyrotropin-releasing hormone receptor. Detection in living cells using bioluminescence resonance energy transfer. J Biol Chem. 2001;276:12736–12743. doi: 10.1074/jbc.M011311200. [DOI] [PubMed] [Google Scholar]
- Liang Y, Fotiadis D, Filipek S, Saperstein DA, Palczewski K, Engel A. Organization of the G protein-coupled receptors rhodopsin and opsin in native membranes. J Biol Chem. 2003;278:21655–21662. doi: 10.1074/jbc.M302536200. [DOI] [PMC free article] [PubMed] [Google Scholar]
- Ma AW, Redka DS, Pisterzi LF, Angers S, Wells JW. Recovery of oligomers and cooperativity when monomers of the m(2) muscarinic cholinergic receptor are reconstituted into phospholipid vesicles. Biochemistry. 2007;46:7907–7927. doi: 10.1021/bi6026105. [DOI] [PubMed] [Google Scholar]
- Macdonald JL, Pike LJ. Heterogeneity in EGF-binding affinities arises from negative cooperativity in an aggregating system. Proc Natl Acad Sci USA. 2008;105:112–117. doi: 10.1073/pnas.0707080105. [DOI] [PMC free article] [PubMed] [Google Scholar]
- Maurel D, Comps-Agrar L, Brock C, Rives ML, Bourrier E, Ayoub MA, et al. Cell-surface protein-protein interaction analysis with time-resolved FRET and snap-tag technologies: application to GPCR oligomerization. Nat Methods. 2008;5:561–567. doi: 10.1038/nmeth.1213. [DOI] [PMC free article] [PubMed] [Google Scholar]
- Mercier JF, Salahpour A, Angers S, Breit A, Bouvier M. Quantitative assessment of beta 1- and beta 2-adrenergic receptor homo- and heterodimerization by bioluminescence resonance energy transfer. J Biol Chem. 2002;277:44925–44931. doi: 10.1074/jbc.M205767200. [DOI] [PubMed] [Google Scholar]
- Meyer BH, Segura JM, Martinez KL, Hovius R, George N, Johnsson K, et al. FRET imaging reveals that functional neurokinin-1 receptors are monomeric and reside in membrane microdomains of live cells. Proc Natl Acad Sci USA. 2006;103:2138–2143. doi: 10.1073/pnas.0507686103. [DOI] [PMC free article] [PubMed] [Google Scholar]
- Milligan G. A day in the life of a G protein-coupled receptor: the contribution to function of G protein-coupled receptor dimerization. Br J Pharmacol. 2008;153:S216–S229. doi: 10.1038/sj.bjp.0707490. [DOI] [PMC free article] [PubMed] [Google Scholar]
- Milligan G, Smith NJ. Allosteric modulation of heterodimeric G-protein-coupled receptors. Trends Pharmacol Sci. 2007;28:615–620. doi: 10.1016/j.tips.2007.11.001. [DOI] [PubMed] [Google Scholar]
- Nickolls SA, Strange PG. Interaction of the D2short dopamine receptor with G proteins: analysis of receptor/G protein selectivity. Biochem Pharmacol. 2003;65:1139–1150. doi: 10.1016/s0006-2952(03)00040-6. [DOI] [PubMed] [Google Scholar]
- Park PS, Sum CS, Pawagi AB, Wells JW. Cooperativity and oligomeric status of cardiac muscarinic cholinergic receptors. Biochemistry. 2002;41:5588–5604. doi: 10.1021/bi011746s. [DOI] [PubMed] [Google Scholar]
- Potter LT, Ballesteros LA, Bichajian LH, Ferrendelli CA, Fisher A, Hanchett HE, et al. Evidence of paired M2 muscarinic receptors. Mol Pharmacol. 1991;39:211–221. [PubMed] [Google Scholar]
- Rovira X, Roche D, Serra J, Kniazeff J, Pin JP, Giraldo J. Modeling the binding and function of metabotropic glutamate receptors. J Pharmacol Exp Ther. 2008;325:443–456. doi: 10.1124/jpet.107.133967. [DOI] [PubMed] [Google Scholar]
- Sohy D, Parmentier M, Springael JY. Allosteric transinhibition by specific antagonists in CCR2/CXCR4 heterodimers. J Biol Chem. 2007;282:30062–30069. doi: 10.1074/jbc.M705302200. [DOI] [PubMed] [Google Scholar]
- Vidi PA, Chemel BR, Hu CD, Watts VJ. Ligand-dependant oligomerization of dopamine D2 and adenosine A2A receptors in living neuronal cells. Mol Pharmacol. 2008;74:544–551. doi: 10.1124/mol.108.047472. [DOI] [PubMed] [Google Scholar]
- Vivo M, Lin H, Strange PG. Investigation of cooperativity in the binding of ligands to the D(2) dopamine receptor. Mol Pharmacol. 2006;69:226–235. doi: 10.1124/mol.105.012443. [DOI] [PubMed] [Google Scholar]
- Wells JW. Analysis and interpretation of binding at equilibrium. Receptor-ligand interactions. In: Hulme EC, editor. A practical approach. Oxford: Oxford University Press; 1992. pp. 289–395. [Google Scholar]
- White JF, Grodnitzky J, Louis JM, Trinh LB, Shiloach J, Gutierrez J, et al. Dimerization of the class A G protein-coupled neurotensin receptor NTS1 alters G protein interaction. Proc Natl Acad Sci USA. 2007;104:12199–12204. doi: 10.1073/pnas.0705312104. [DOI] [PMC free article] [PubMed] [Google Scholar]
- Whorton MR, Bokoch MP, Rasmussen SG, Huang B, Zare RN, Kobilka B, et al. A monomeric G protein-coupled receptor isolated in a high-density lipoprotein particle efficiently activates its G protein. Proc Natl Acad Sci USA. 2007;104:7682–7687. doi: 10.1073/pnas.0611448104. [DOI] [PMC free article] [PubMed] [Google Scholar]
- Wreggett KA, Wells JW. Cooperativity manifest in the binding properties of purified cardiac muscarinic receptors. J Biol Chem. 1995;270:22488–22499. doi: 10.1074/jbc.270.38.22488. [DOI] [PubMed] [Google Scholar]
- Yarden Y, Schlessinger J. Epidermal growth factor induces rapid, reversible aggregation of the purified epidermal growth factor receptor. Biochemistry. 1987;26:1443–1451. doi: 10.1021/bi00379a035. [DOI] [PubMed] [Google Scholar]