

Abstract
Background and purpose:
The increased levels of extracellular adenosine in inflamed tissues down-regulate activated immune cells via the A2A adenosine receptor. This A2A adenosine receptor-mediated immunosuppression is a disqualifying obstacle in cancer immunotherapy as it protects cancerous tissues from adoptively transferred anti-tumour T cells. The aim of this study was to test whether the negative selection of T cells will produce T cells that are resistant to inhibition by extracellular adenosine.
Experimental approach:
Cytotoxic T lymphocytes (CTL) were developed by mixed lymphocyte culture in the presence or absence of the adenosine receptor agonist 5′-N-ethylcarboxamidoadenosine (NECA). The sensitivity of CTL to adenosine analogues was characterized by cAMP induction, interferon-γ production and cytotoxicity.
Key results:
CTL that could proliferate even in the presence of NECA were less susceptible to inhibition by A2A adenosine receptor agonists, as shown by a much smaller accumulation of cAMP and less inhibition of interferon-γ production compared with control CTL. The successful protocol to produce CTL that are both resistant to adenosine-mediated immunosuppression and maintain strong cytotoxicity and interferon-γ secretion required NECA to be added only during the expansion stage after the establishment of CTL. In contrast, the priming of resting T cells in the presence of NECA resulted in T cells with impaired effector functions.
Conclusions and implications:
Adenosine-resistant effector T cells were successfully obtained by exposure of activated T cells to NECA. These in vitro studies form the basis for future attempts to produce anti-tumour T cells that are more effective in adoptive immunotherapy.
Keywords: Cytotoxic T lymphocytes, cancer, adenosine, A2A adenosine receptor, adoptive immunotherapy, mouse
Introduction
The A2A adenosine receptor is highly expressed in the brain and immune cells (Fredholm et al., 2001; Linden, 2001). Binding of ligands to A2A adenosine receptors expressed on T cells strongly inhibits proliferation (Huang et al., 1997), cytotoxicity (Koshiba et al., 1997) and the production of cytokines (Koshiba et al., 1997; Erdmann et al., 2005; Lappas et al., 2005). A2B adenosine receptors are also expressed in macrophages, mast cells and activated T cells (Fredholm et al., 2001; Linden, 2001; Ohta et al., 2006). As both A2A and A2B adenosine receptors are Gαs-coupled receptors, the subsequent increase of intracellular cAMP by adenylate cyclase activates protein kinase A (PKA) (Fredholm et al., 2001; Linden, 2001). Phosphorylation by PKA of COOH-terminal Src kinase (Csk) results in the inhibition of Lck activation and interruption of T cell receptor signalling (Vang et al., 2001). It is also shown that the regulatory subunit of PKA plays a role in the inhibition of effector functions of activated T cells (Raskovalova et al., 2007). T cells also express other immunosuppressive Gαs protein-coupled receptors [i.e. β2-adrenoceptor, histamine H2 receptor, prostaglandin E2 (PGE2) receptor]; however, the A2A adenosine receptor has been found to have an essential role in the mechanism of physiological down-regulation of inflammatory responses (Ohta and Sitkovsky, 2001; Sitkovsky et al., 2004; Sitkovsky and Ohta, 2005; Ohta et al., 2007). Indeed, a deficiency of A2A adenosine receptors was demonstrated to exacerbate inflammatory tissue damage (Ohta and Sitkovsky, 2001; Day et al., 2004). A2B adenosine receptor-deficient mice were also found to have low levels of inflammation in the vascular endothelium (Yang et al., 2006). Thus, A2A/A2B adenosine receptors play an important role in the down-regulation of immune responses.
Tumours may use this adenosine-mediated immunosuppression to evade attack by anti-tumour T cells. Cancerous tissues are often hypoxic because of the aggressive growth of tumour cells and tumour geometry, and chronic hypoxia in tumours is known to correlate with poor prognosis (Harris, 2002; Shannon et al., 2003; Vaupel and Mayer, 2007). This hypoxia inside tumours results in the extracellular fluid in tumour tissues having higher levels of adenosine than in normal tissues (Ohta et al., 2006). Tissue hypoxia is conducive to accumulation of extracellular adenosine because of the inhibition of adenosine kinase (Decking et al., 1997; Kobayashi et al., 2000) and hypoxia-induced up-regulation of extracellular adenosine-generating enzymes CD39 and CD73 (Eltzschig et al., 2004; Kobie et al., 2006; Deaglio et al., 2007).
The much enhanced tumour destruction in A2A adenosine receptor-deficient mice demonstrates that intratumoural adenosine has a role in the self-protective mechanism of tumours by exerting immunosuppression through A2A adenosine receptors (Ohta et al., 2006). In agreement with this hypothesis, antagonists of the A2A adenosine receptor significantly improved tumour immunotherapy by T cell adoptive transfer (Ohta et al., 2006). These observations suggest the novel approach whereby more effective immunotherapy will be accomplished by preventing down-regulation of adoptively transferred T cell functions via A2A/A2B adenosine receptors. Accordingly, treatments that down-regulate A2A and A2B adenosine receptors in effector T cells are expected to improve adoptive immunotherapy.
In the present study, we developed cytotoxic T lymphocytes (CTL) that are insensitive to A2A/A2B adenosine receptor-mediated immunosuppression. This was done by culturing them with 5′-N-ethylcarboxamidoadenosine (NECA) that is an adenosine receptor agonist having high affinity for both A2A and A2B adenosine receptors (Kd = 10–20 nmol L−1) (Fredholm et al., 2001). We showed that NECA suppressed CTL expansion in vitro; however, a significant number of cells could still expand even in the presence of a high concentration of NECA. We found that these negatively selected CTL did not respond to A2A/A2B adenosine receptor stimulation induced by cAMP accumulation and that their effector functions were resistant to extracellular adenosine and A2A/A2B adenosine receptor-mediated immunosuppression.
Methods
Mice
C57BL/6 and DBA/2 mice were obtained from Charles River Laboratories (Wilmington, MA). The mice were housed in the animal facility of Northeastern University, and were used at 7–9 weeks of age in accordance with the institution's animal care guidelines.
Mixed lymphocyte culture
Antigen-specific cytotoxic T cells were induced by allogenic mixed lymphocyte culture using spleen cells from C57BL/6 (H-2b) and DBA/2 (H-2d) mice. Spleen cells from DBA/2 mice were pre-treated with 50 µg ml−1 mitomycin C for 30 min at 37°C. After being washed three times by centrifugation, 2 × 10⁶ DBA/2 spleen cells (stimulator) were mixed with 6 × 10⁶ C57BL/6 spleen cells (responder) in 2 ml of RPMI1640 medium containing 10% foetal calf serum. The cells were cultured for 5 days in a 12-well plastic plate. In some experiments, CTL (2 × 10⁶ cells) were re-stimulated on day 5 using mitomycin C-treated DBA/2 spleen cells (4 × 10⁶ cells). The re-stimulated cells were cultured for additional 2 days, and were analysed on day 7. NECA was added either at the beginning of mixed lymphocyte culture (0–120 h) or after re-stimulation (120–168 h).
Cytokine production and cell proliferation in mixed lymphocyte culture
Culture supernatant was collected 5 days after the set-up of mixed lymphocyte culture or 2 days after re-stimulation and was stored at 4°C for subsequent measurement of interferon-γ (IFN-γ) levels. IFN-γ was quantified by ELISA according to the manufacturer's instructions. Cells were incubated for an additional 4 h in the presence of 1 µCi [3H]-thymidine and radioactivity of incorporated thymidine was counted.
Cytotoxicity assay
Cytotoxicity of T cells against P815 mastocytoma (H-2d) was determined by 51Cr release assay. Initially, P815 cells (2 × 10⁶) were incubated with 100 µCi [51Cr]-sodium chromate for 1 h at 37°C. The cells were washed for three times by centrifugation to remove excess radioactivity. The labelled P815 cells (1 × 10⁴ cells) were mixed with the effector cells recovered from mixed lymphocyte culture in a volume of 150 µl. Effector–target ratio was between 5:1 and 1.25:1. Sedimentation of the cells in a v-bottom 96-well plate by brief centrifugation was followed by incubation at 37°C. After 4 h, 51Cr release in the supernatant from target cells was counted using a γ-radiation counter. Spontaneous 51Cr release was measured by culturing target cells alone. Maximum 51Cr release was measured by adding 1 N hydrochloric acid to the same number of target cells. Cytotoxicity was calculated as percentage cell lysis when spontaneous 51Cr release and maximum 51Cr release were set to 0% and 100% respectively.
cAMP assay
Stimulation of cAMP production and measurement of cAMP levels were performed as described previously (Apasov et al., 2000). After washing the cells twice with media to remove excess NECA, cAMP production from the cells (2 × 10⁵) was induced by addition of either NECA, CGS21680 (CGS, A2A adenosine receptor-specific agonist) or forskolin (adenylate cyclase activator). The concentration of cAMP inducers was 5 µmol L−1. The cells were incubated for 15 min at 37°C, and the reaction was stopped by addition of 1 N hydrochloric acid. cAMP levels were determined by ELISA.
Stimulation of IFN-γ production from CTL
The CTL (2 × 10⁵ cells) were washed twice with media and re-stimulated by plate-bound anti-CD3 and anti-CD28 monoclonal antibodies (mAb). Anti-CD3 mAb (2 µg ml−1) and anti-CD28 mAb (1 µg ml−1) diluted in PBS were immobilized in a flat-bottom 96-well plastic culture plate for 1 h at 37°C before use. In order to examine anti-tumour cellular responses, CTL (2 × 10⁵ cells) were also cultured with mitomycin C-treated P815 mastocytoma (2.5 × 10⁵ cells). Re-stimulation was performed in the presence of either NECA, CGS or forskolin (10 µmol L−1) in order to examine sensitivity of T cells to cAMP inducers. After 24–48 h, the culture supernatant was assayed for IFN-γ levels by ELISA.
Flowcytometric analysis
Cells recovered from the mixed lymphocyte culture were labelled with phycoerythrin-conjugated anti-CD8, allophycocyanin-conjugated anti-CD4 and fluorescein-conjugated anti-CD69 mAb, and were analysed by FACSCalibur. Cytokine production from CTL was analysed by intracellular staining as described previously (Nishimura et al., 1999). After being stimulated with immobilized anti-CD3 and anti-CD28 mAb for 24 h, the cells were further incubated in the presence of brefeldin A (10 µg ml−1) for 2 h. The cells were then fixed with 4% paraformaldehyde-PBS for 15 min, permeabilized with permeabilizing buffer (50 mmol L−1 NaCl, 5 mmol L−1 EDTA, 0.02% NaN3, 0.5% Triton X-100, 10 mmol L−1 Tris-HCl, pH 7.5) for 15 min, and stained with fluorescein-labelled anti-IFN-γ mAb. IFN-γ-producing CD8+ cells were identified by cell surface staining using phycoerythrin-conjugated anti-CD8 mAb.
For the cell proliferation assay, spleen cells from C57BL/6 mouse were labelled with carboxyfluorescein succinimidyl ester (CFSE) at 1 µmol L−1 for 8 min. Excess CFSE was removed by dilution with foetal calf serum and subsequent centrifugation. This washing step was repeated twice. The resulted CFSE-labelled cells were used as a responder in mixed lymphocyte culture. After 3 days, the cells were stained with phycoerythrin-conjugated anti-CD8 mAb, and cell division was analysed by a flowcytometer as indicated by the stepwise decrease of fluorescence intensity of CFSE.
Materials
Mitomycin C, forskolin and NECA were obtained from Sigma (St. Louis, MO, USA); ELISA for IFN-γ from R&D Systems (Minneapolis, MN, USA); ELISA for cAMP, Amersham Biosciences (Buckinghamshire, UK); [3H]-thymidine, American Radiolabeled Chemicals (St. Louis, MO, USA); [51Cr]-sodium chromate, Perkin Elmer (Boston, MA, USA); CGS (2-(4-[2-carboxyethyl]-phenethylamino)adenosine-5′-N-ethyluronamide), Tocris (Ellisville, MO, USA); all the antibodies used and FACS Calibur were obtained from BD Biosciences (San Diego, CA, USA); CFSE, Molecular Probes.
Statistics
Data represent mean ± s.d. Statistical calculations were performed using Student's t-test. Statistical significance was accepted for P-values less than 0.05.
Results
Development and expansion of CTL in the presence of the adenosine receptor agonist NECA
In order to examine the effect of NECA on the development of CTL, we started mixed lymphocyte culture with or without NECA using spleen cells from C57BL/6 mice (H-2b) as responders and those from DBA/2 mice (H-2d) as stimulators. After 5 days, NECA, as expected, significantly impaired CTL development in a concentration-dependent manner. Cell proliferation as indicated by [3H]-thymidine incorporation decreased to 30–40% in the presence of NECA (Fig. 1A). Correspondingly, there was a decrease in the cell numbers in a concentration-dependent manner. The cell number in the NECA-treated culture decreased to 78% (0.1 µmol L−1), 72% (1 µmol L−1) and 68% (10 µmol L−1) of control. IFN-γ levels in the culture supernatant decreased to 44% by 10−7 M NECA and it was only 18% when incubated with 10−5 M NECA (Fig. 1B). Cytotoxicity was also reduced to 33% of control when the cells were incubated with 10−5 M NECA (Fig. 1C). Interestingly, although a large part of CTL development was impaired, a significant number of clusters of proliferating cells formed even at the highest concentration of NECA. Flow cytometric analysis of the cells revealed the expansion of activated T cells in the presence of NECA. The majority of the expanded cells were CD8+ T cells and there were also a smaller number of CD4+ T cells. This profile was similar to that of CTL developed without NECA (Fig. 1D). Furthermore, a significant proliferation of CD8+ cells in the presence of NECA was demonstrated in the mixed lymphocyte culture after labelling with CFSE. Note that although the number of activated cells was decreased and this was dependent on the concentration of NECA, the NECA-treated culture still contained progressively proliferated CD8+ cells similar to those seen in the control culture (Fig. 1E). These results suggest that while NECA does strongly suppress T cell activation, some of the CTL can still be activated and expanded even in the presence of NECA.
Figure 1.
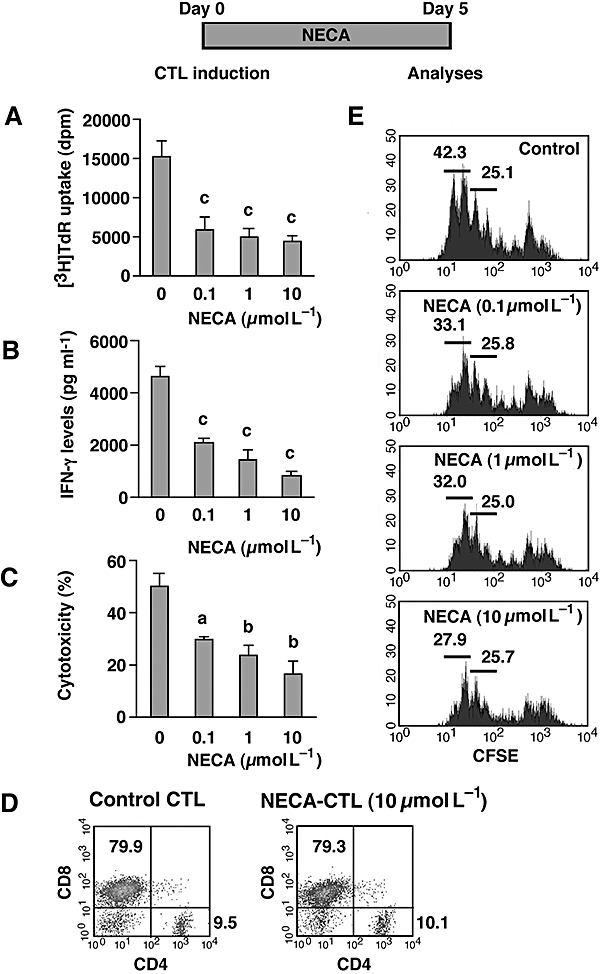
NECA suppressed the mixed lymphocyte reaction, but there was significant development of CTL. CTL were induced by mixed lymphocyte culture using spleen cells from C57BL/6 (H-2b) and DBA/2 (H-2d) mice. The cells were cultured for 5 days in the presence or absence of NECA (0.1–10 µmol L−1). Resulting cells were examined for their proliferative activity (A), IFN-γ levels in the culture supernatant (B) and cytotoxicity against P815 mastocytoma (C). Effector–target ratio for cytotoxicity assay was 5:1. D. Proportion of CD4 and CD8 cells after 5 days. Large (activated) cells were gated for the analysis. Data from CTL induced with 10 µmol L−1 NECA shown are representative results; there was no marked difference in CTL induced with other concentrations of NECA. E. CD8+ cell expansion during mixed lymphocyte culture. C57BL/6 cells were stimulated after being labelled with CFSE and its fluorescence in CD8+ cells was analysed after 3 days of culture. Large (activated) CD8-expressing cells were gated for the analysis. Numbers in the panels indicate percentage of population. Data shown here represent average ± s.d. of triplicate samples. The statistical significance was calculated by Student's t-test: a P < 0.05; b P < 0.01; c P < 0.001. CFSE, carboxyfluorescein succinimidyl ester; CTL, cytotoxic T lymphocytes; IFN-γ, interferon-γ; NECA, 5′-N-ethylcarboxamidoadenosine; NECA-CTL, CTL developed in the presence of NECA.
Selection of adenosine-resistant CTL with NECA present throughout the induction
We speculated that the CTL developed in the presence of NECA (named NECA-CTL) could survive because they were less sensitive to signalling by NECA via A2 adenosine receptors. If this is the case, then NECA-CTL may not respond to A2A/A2B adenosine receptor stimulation as much as CTL developed in the absence of NECA (control CTL). In order to test this, we measured the cAMP responses of the different preparations of CTL to a non-selective A2A/A2B adenosine receptor agonist NECA and A2A adenosine receptor-selective agonist CGS. Control CTL increased cAMP levels 7.4- and 11.1-fold in response to CGS and NECA respectively (Fig. 2). In contrast, the increase in cAMP levels in the NECA-CTL was only induced 1.3- to 2.4-fold by CGS and 2.2- to 3.1-fold by NECA. The basal cAMP levels were not different in these CTL. Direct activation of adenylate cyclase by forskolin induced high levels of cAMP in both control CTL and NECA-CTL, thereby providing an important internal control that shows that it is indeed a difference in the A2 adenosine receptors but not the intracellular cAMP-producing machinery that accounts for the differential susceptibility of NECA-CTL versus control CTL to the effects of adenosine receptor agonists (Fig. 2). This result indicates that NECA-CTL produce much smaller amounts of cAMP than control CTL in response to A2A/A2B adenosine receptor agonists, even though their cAMP-synthesizing mechanisms are intact.
Figure 2.
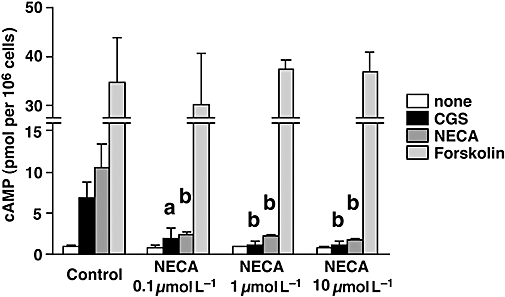
CTL developed with NECA show impaired response to A2A/A2B adenosine receptor agonists. CTL were induced as described in Figure 1. cAMP production from the CTL was determined after incubation with A2A/A2B adenosine receptor agonists (CGS and NECA) and adenylate cyclase activator (forskolin). The concentration of cAMP inducers was 10 µmol L−1. Data shown here represent average ± s.d. of triplicate samples. The statistical significance was calculated by Student's t-test: a P < 0.05; b P < 0.01 versus control CTL. CGS, CGS21680; CTL, cytotoxic T lymphocytes; NECA, 5′-N-ethylcarboxamidoadenosine.
The greatly diminished cAMP response of NECA-CTL to adenosine receptor agonists suggested that they would also be more resistant to adenosine-mediated immunosupression. To test this, we stimulated NECA-CTL and control CTL and compared their cytokine-producing activities in the presence of A2A/A2B adenosine receptor agonists. It is shown in Table 1 that negatively selected NECA-CTL retained up to 80% of their IFN-γ-producing capacity when tested for susceptibility to inhibition by CGS. In contrast, non-selected control CTL retained only 44% of their IFN-γ-producing capacity even though the absolute amounts of IFN-γ were originally higher in control CTL; the maximum IFN-γ producing activity of NECA-CTL was decreased compared with control CTL and this was dependent on the concentration of NECA used to induce NECA-CTL. Control CTL produced 9188 pg ml−1 IFN-γ, but the activities in NECA-CTL decreased to 3722 (0.1 µmol L−1), 2327 (1 µmol L−1) and 1089 (10 µmol L−1) pg ml−1 (Table 1). Forskolin strongly suppressed IFN-γ production from both control CTL and NECA-CTL (data not shown).
Table 1.
CTL developed with NECA were resistant to immunosuppression by A2A/A2B adenosine receptor agonists
|
IFN-γ levels (%) |
|||
|---|---|---|---|
| None | CGS | NECA | |
| Control | 100 ± 8 (9188) | 44 ± 11 | 28 ± 7 |
| NECA (0.1 µmol L−1) | 100 ± 23 (3722) | 57 ± 8** | 44 ± 12*** |
| NECA (1 µmol L−1) | 100 ± 19 (2327) | 67 ± 10* | 56 ± 8*** |
| NECA (10 µmol L−1) | 100 ± 5 (1089) | 80 ± 13** | 60 ± 8*** |
CTL induced as described in Figure 1 were stimulated with immobilized anti-CD3 and anti-CD28 mAbs for 24 h in the presence or absence of CGS or NECA (10 µmol L−1). Numbers in parentheses are IFN-γ levels (pg ml−1). The data represent the IFN-γ levels expressed as a % of those in corresponding CTL without CGS/NECA. The statistical significance was calculated by Student's t-test:
P < 0.05;
P < 0.01;
P < 0.001 versus control CTL.
CGS, CGS21680; CTL, cytotoxic T lymphocytes; IFN-γ, interferon-γ; NECA, 5′-N-ethylcarboxamidoadenosine.
We interpreted these results by assuming that T cell activation and expansion in the presence of NECA led to the selection of CTL that are resistant to the immunosuppressive mechanism induced via activation of the A2A/A2B adenosine receptors. A disadvantage of inducing NECA-CTL in this way is the impaired effector functions of these cells, as shown by their diminished cytotoxicity (Fig. 1C) and ability to produce IFN-γ (Table 1). As NECA was present during the ongoing CTL priming process, it might have interrupted T cell activation and hampered the production of fully functional CTL. To avoid this drawback, we performed the experiments described below.
Selection of adenosine-resistant CTL with NECA treatment after the development of CTL
In order to produce NECA-CTL that retain comparable effector functions to control CTL, we initially withheld NECA for 5 days to induce fully functional CTL, and re-stimulated these CTL with the same stimulator (DBA/2 cells) in the presence or absence of NECA. After the re-stimulation, NECA again was shown to inhibit proliferation of CTL (Fig. 3A) and IFN-γ levels in the culture supernatant (Fig. 3B). However, in contrast to the primary mixed lymphocyte culture (Fig. 1), the cytotoxicity was not impaired by NECA treatment (Fig. 3C). In addition, flowcytometric analysis revealed that the proportion of CD8+ T cells in the expanded cells was unchanged from control CTL (Fig. 3D). These CTL were re-stimulated with anti-CD3 mAb to compare their ability to produce IFN-γ. NECA-CTL were found to produce high levels of IFN-γ comparable to control CTL (Fig. 4A). Furthermore, the frequency of IFN-γ-producing CD8+ T cells was at the same level (approximately 60%) in both control and NECA-CTL (Fig. 4B). When added to pre-activated T cells, NECA may suppress their proliferation, but the resulting cells retain equivalent effector activities to those of control CTL.
Figure 3.
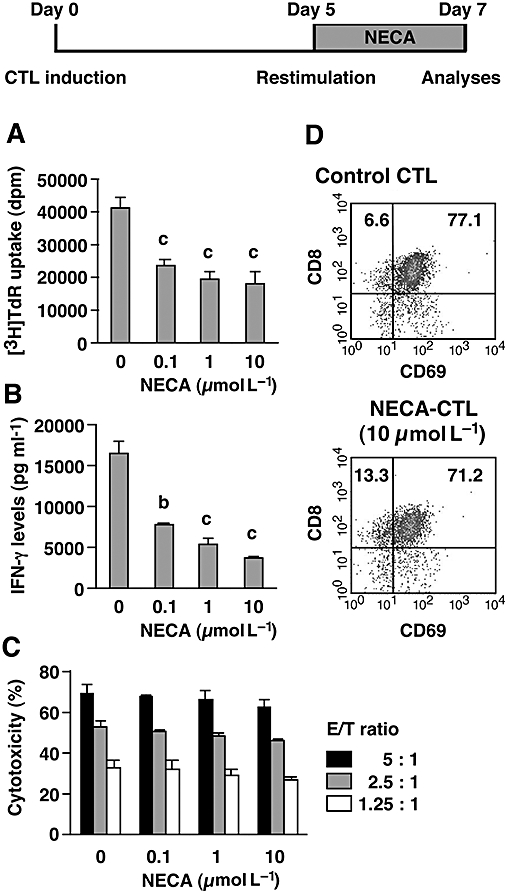
Cytotoxicity of NECA-CTL was maintained well when NECA was added only during the secondary mixed lymphocyte culture. Primary CTL were induced by mixed lymphocyte culture for 5 days. After extensive washing, the cells were re-stimulated with spleen cells from DBA/2 mice for 2 more days. NECA (0.1–1 µmol L−1) was withheld during the primary mixed lymphocyte culture and was added for 2 days after re-stimulation. The resulting cells were examined for their proliferative activity (A), IFN-γ levels in the culture supernatant (B), cytotoxicity against P815 mastocytoma (C) and flowcytometric analysis (D). Effector–target ratio for cytotoxicity assay was 5:1, 2.5:1 and 1.25:1. Data shown here represent average ± s.d. of triplicate samples. The statistical significance was calculated by Student's t-test: b P < 0.01; c P < 0.001. CTL, cytotoxic T lymphocytes; IFN-γ, interferon-γ; NECA, 5′-N-ethylcarboxamidoadenosine; NECA-CTL, CTL developed in the presence of NECA.
Figure 4.
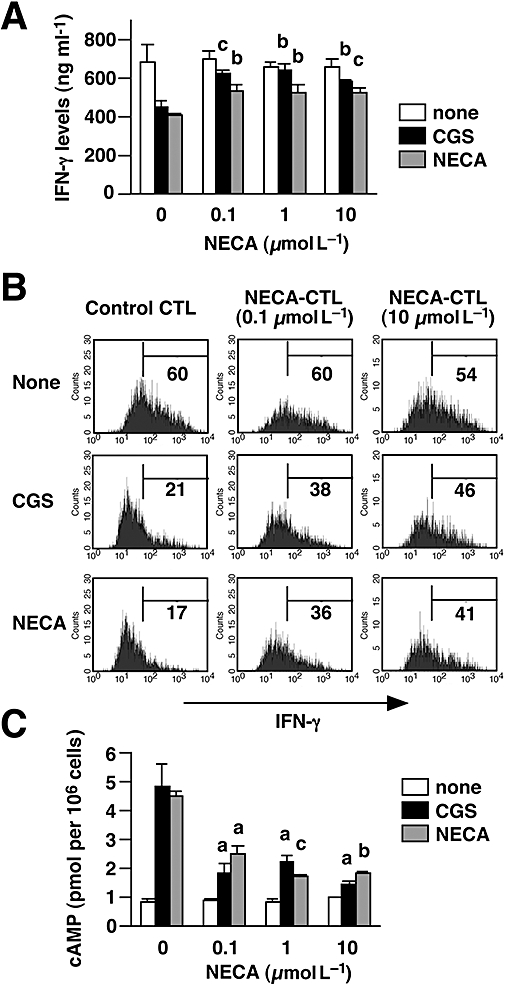
CTL treated with NECA for only the last 2 days were not only resistant to immunosuppression by A2A/A2B adenosine receptor agonists but also high IFN-γ producers comparable with control CTL. CTL were prepared as described for Figure 3. A and B. On day 7, the cells were re-stimulated by immobilized anti-CD3 and anti-CD28 mAbs for 24 h with CGS or NECA (10 µmol L−1). A. IFN-γ levels in the culture supernatant were quantified by ELISA. B. Intracellular IFN-γ expression in stimulated CTL was evaluated after further incubation with brefeldin A for 2 h. Numbers in each panel show the percentage of IFN-γ producers. The data shown here represent two separate experiments. C. NECA-CTL treated with NECA for only the last 2 days also showed an impaired cAMP response to A2A/A2B adenosine receptor agonists. Data shown here represent average ± s.d. of triplicate samples. The statistical significance was calculated by Student's t-test: a P < 0.05; b P < 0.01; c P < 0.001 versus control CTL. CTL, cytotoxic T lymphocytes; IFN-γ, interferon-γ; NECA, 5′-N-ethylcarboxamidoadenosine; NECA-CTL, CTL developed in the presence of NECA.
The NECA-CTL that were cultured with NECA only after the CTL had developed were then tested for their susceptibility to the A2A/A2B adenosine receptor agonists. When control CTL were re-stimulated with anti-CD3 mAb, NECA and CGS strongly inhibited IFN-γ production from these cells, whereas NECA-CTL were resistant to the suppressive effects of these NECA and CGS (Fig. 4A). The production of IFN-γ in the presence of the A2A/A2B adenosine receptor agonists was significantly higher in the NECA-CTL than in control CTL (Fig. 4A). Also the frequency of IFN-γ-producing CD8+ T cells was higher in the NECA-CTL. CGS and NECA markedly reduced IFN-γ-producing cells in control CTL (by 70%), but the reduction in NECA-CTL was much less (only 20–35%) (Fig. 4B). In accordance with the cytokine data, the cAMP assay demonstrated that the ability of NECA-CTL to respond to A2A/A2B adenosine receptor agonists was reduced compared with control CTL. In contrast to the high levels of cAMP produced in control CTL in response to CGS and NECA, NECA-CTL produced significantly less cAMP when incubated with CGS and NECA (Fig. 4C). Next, NECA-CTL were tested to determine how long they maintained their resistance to adenosine. When IFN-γ production was induced 24 h after removal of NECA, the resistance to the A2A adenosine receptor agonist persisted in NECA-CTL induced by 1 or 10 µmol L−1 NECA (Fig. 5). However, their sensitivity to A2A adenosine receptor stimulation had returned after 48 h. These results show that the culturing with NECA could induce adenosine-resistant CTL and those CTL that have been exposed to NECA only after the CTL induction could maintain strong effector functions. Although the resistance of NECA-CTL to adenosine was not permanent, these cells remained resistant for at least 24 h after the removal of NECA.
Figure 5.
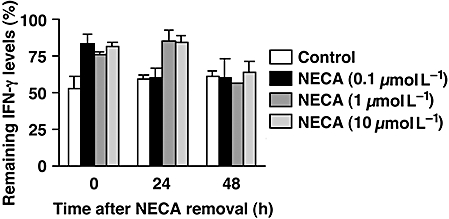
NECA-CTL maintained their resistance to A2A adenosine receptor stimulation at least for 24 h. NECA was removed by extensive washing 2 days after re-stimulation. Cells were re-cultured with IL-2 for 24–48 h, and then IFN-γ production was induced by immobilized anti-CD3 and anti-CD28 mAbs. The inhibitory effect of CGS (10 µmol L−1) is expressed as a percentage of IFN-γ levels remaining compared with control. Data shown represent average ± s.d. of triplicate samples. CTL, cytotoxic T lymphocytes; IFN-γ, interferon-γ; NECA, 5′-N-ethylcarboxamidoadenosine; NECA-CTL, CTL developed in the presence of NECA.
We further examined antigen-specific anti-tumour responses of the CTL by culturing them with P815 tumour cells. The CTL produced IFN-γ upon recognition of the tumour cells, and the amount of IFN-γ produced was almost equivalent in control and NECA-CTL (Fig. 6). It was again confirmed that NECA-CTL could produce significantly higher levels of IFN-γ than control CTL when they encountered tumour cells in the presence of A2A/A2B adenosine receptor agonists. Together with the strong cytotoxicity against the tumour cells (Fig. 3C), these results suggest that NECA-CTL may act more effectively than control CTL in an adenosine-rich microenvironment.
Figure 6.
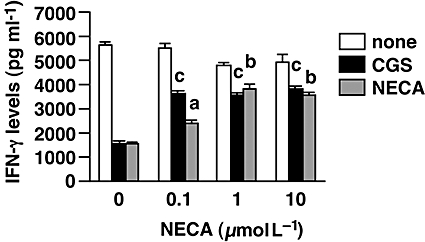
NECA-CTL could produce high levels of IFN-γ upon recognition of tumour cells even in the presence of A2A/A2B adenosine receptor agonists. CTL were induced as described for Figure 3. In order to activate antigen-specific anti-tumour responses, the same number of CTL was evaluated after co-culture with mitomycin C-treated P815 cells. The susceptibility of the CTL to A2A/A2B adenosine receptor activation was examined by stimulating them in the presence of CGS or NECA (10 µmol L−1). IFN-γ levels in the supernatant were determined after 2 days. Data shown here represent average ± s.d. of triplicate samples. The statistical significance was calculated by Student's t-test: a P < 0.05; b P < 0.01; c P < 0.001 versus control CTL. CGS, CGS21680; CTL, cytotoxic T lymphocytes; IFN-γ, interferon-γ; NECA, 5′-N-ethylcarboxamidoadenosine; NECA-CTL, CTL developed in the presence of NECA.
Discussion and conclusions
Adoptive transfer of anti-tumour CTL is a promising approach used to eradicate tumours (Dudley and Rosenberg, 2003; Gajewski et al., 2006; Gattinoni et al., 2006). CTL may be collected from a tumour-bearing host, expanded in vitro, and then a large number of anti-tumour effector cells will be returned to the host. However, in spite of their strong anti-tumour activities in vitro, the outcome of adoptive immunotherapy has not been satisfactory. Even after successful expansion of anti-tumour effector T cells, anti-tumour responses of adoptively transferred T cells appear to be disabled in the tumour micorenvironment. The immunosuppressive mechanisms in tumours include secretion of anti-inflammatory cytokines, that is, IL-10 (Steinbrink et al., 1999) and TGF-β (Gorelik and Flavell, 2001), induction of T cell apoptosis by programmed death ligand-1 (Iwai et al., 2002), nutrient deficiency by glucose deprivation (Cham and Gajewski, 2005), L-arginine metabolism by myeloid suppressor cells (Rodriguez et al., 2004) and the expression of indoleamine-2,3-dioxygenase (Uyttenhove et al., 2003; Puccetti and Grohmann, 2007). Regulatory T cells may also play a major role in the suppression of T cell activation in tumours (Sutmuller et al., 2001; Curiel et al., 2004; Turk et al., 2004; Antony et al., 2005). It is known that lymphodepletion before adoptive transfer improves T cell responses (Cheever et al., 1980; Gattinoni et al., 2006). This effect, at least in part, can be explained by the depletion of regulatory T cells. Regulatory T cells produce anti-inflammatory molecules such as IL-10 (Asseman et al., 1999; Annacker et al., 2001; von Boehmer, 2005), TGF-β (Powrie et al., 1996; von Boehmer, 2005; Chen et al., 2005) and galectin-1 (Garín et al., 2007; Rabinovich et al., 2007). If anti-tumour effectors resistant to such immunosuppressive mechanisms are available, these cells may improve the outcome of tumour immunotherapy.
Recently, we found that extracellular adenosine in the hypoxic tumour microenvironment represents a non-redundant and powerful defensive mechanism that protects tumours from anti-tumour T cells (Ohta et al., 2006). Although tissue hypoxia leads to the accumulation of extracellular adenosine, regulatory T cells may also be a potential source of adenosine, because they were found to express CD39 and CD73 (Kobie et al., 2006; Deaglio et al., 2007), which catalyse the degradation of ATP/AMP to adenosine. In experiments using A2A adenosine receptor-deficient mice, we demonstrated that the efficacy of anti-tumour T cells is restricted in the adenosine-rich tumour microenvironment (Ohta et al., 2006). When adoptive immunotherapy was combined with adenosine receptor antagonists including caffeine, there was a significant improvement in the inhibition of lung metastasis and growth retardation of subcutaneous tumours (Ohta et al., 2006). This previous study prompted us to develop anti-tumour T cells that lack functional A2A/A2B adenosine receptors.
In the present study, CTL development was strongly, but not completely, impaired in the presence of NECA (Fig. 1); a significant number of T cells managed to survive this hostile environment, and the cells surviving were insensitive to A2A/A2B adenosine receptor agonists. Importantly, A2A and A2B adenosine receptors are known to down-modulate upon treatment with agonists. This regulation involves desensitization by G protein-coupled receptor kinases and internalization of the receptors (Klaasse et al., 2008; Zezula and Freissmuth, 2008). After treatment with NECA, CTL might become insensitive to adenosine because of a temporal down-modulation of the receptors. This explanation corresponds well with the results depicted in Figure 5 that show the sensitivity of NECA-CTL to an A2A adenosine receptor agonist that is restored after 48 h.
Another possible explanation for the proliferation of CTL despite the presence of NECA is that A2A/A2B adenosine receptor expression in CD8+ T cells might be heterogeneous. T cells in general are known to express relatively high levels of A2A adenosine receptors (Fredholm et al., 2001; Linden, 2001), but the distribution of these receptors within T cell subsets are not known. The lack of adequate antibodies against A2A and A2B adenosine receptors is restricting the identification of heterogeneous expression of these receptors. If there are T cell subpopulations expressing different levels of A2A/A2B adenosine receptors, a certain fraction of CD8+ T cells may not respond well to A2A/A2B adenosine receptor stimulation, while most of the CD8+ T cells are high responders. NECA will strongly suppress activation of A2A/A2B adenosine receptors on high-responding CD8+ T cells but will have little effect on the population with low levels of receptors, resulting in the selective proliferation of adenosine-resistant CD8+ T cells. This hypothesis is consistent with the early proliferation of NECA-CTL (Fig. 1E) and their marginal response to A2A/A2B adenosine receptor agonists (Fig. 2 and Table 1).
These adenosine-resistant CTL are expected to be more effective in the tumour microenvironment; however, CTL developed in the presence of NECA had impaired anti-tumour effector activities as shown by the strong reduction of cytotoxicity (Fig. 1) and ability to produce IFN-γ (Table 1). Hence, such CTL may not have the ability to destroy tumours in vivo even though they are insensitive to adenosine. The interruption of the full activation of T cells by NECA in the priming stage might have caused the expansion of CTL with poor effector functions. Our results (shown in Fig. 1 and Table 1) are consistent with those in a recent publication showing the induction of ‘anergic’ T cells in the presence of an A2A adenosine receptor agonist (Zarek et al., 2008). While the precise mechanism of these poor effector functions is not clear, the results shown in Figure 2 suggest that changes in cAMP content of the cells are not responsible for the incomplete expression of the effector functions in NECA-CTL.
Although the immunosuppressive effects of A2A adenosine receptor agonists have been demonstrated using resting T cells (Huang et al., 1997; Lappas et al., 2005; Sevigny et al., 2007; Zarek et al., 2008), it is not clear whether the addition of NECA subsequent to the establishment of activated CTL, in which strong cytotoxicity and IFN-γ-producing activity were already induced, can down-regulate these effector functions. We re-stimulated control CTL in the presence of NECA and found that proliferative responses were still attenuated by NECA (Fig. 3A). IFN-γ levels in the supernatant were also decreased (Fig. 3B) corresponding to the inhibition of proliferation. This partial inhibition of re-stimulated T cells may reflect the presence of high responders to A2A/A2B adenosine receptor agonists in the established control CTL. The re-stimulated cells that survived NECA treatment were again shown to be resistant to A2A/A2B adenosine receptor agonists (Figs 4 and 6). Furthermore, in this treatment protocol, the resulting NECA-CTL retained equivalent cytotoxicity (Fig. 3C) and comparable IFN-γ-producing activity to control CTL (Figs 4 and 6). Therefore, the problem in NECA-CTL, that is, diminished effector functions, could be overcome by withholding NECA during the development of CTL.
The A2A adenosine receptor is up-regulated upon T cell activation and negatively regulates pro-inflammatory cytokines (Koshiba et al., 1999; Lappas et al., 2005). Although NECA is immunosuppressive to both resting (primary mixed lymphocyte culture) and activated T cells (re-stimulated CTL), the effector functions of activated T cells are relatively resistant to NECA compared with resting T cells (Fig. 1C vs Fig. 3C and Table 1 vs Fig. 4A). This result is in accordance with a study showing no CGS-mediated inhibition of cytotoxicity and only a minor decrease of IFN-γ production from activated CD8+ T cells (Erdmann et al., 2005). Activated T cells are less responsive than resting T cells to negative stimulation from PGE2 receptors and β2-adrenoceptors, both of which are coupled with Gs protein and induce cAMP (Heijink et al., 2003). This difference was correlated with the impairment of phosphorylation of cAMP responsive element binding protein in response to PGE2 or β2-agonist (Heijink et al., 2003), suggesting that signalling events downstream of A2A adenosine receptor might be different between resting and activated T cells.
In conclusion, we successfully established antigen-specific CTL, which are partially resistant to adenosine-mediated immunosuppression, after selection using NECA. These CTL retained strong effector functions when NECA treatment started after the development of activated CTL. The use of NECA-CTL for adoptive transfer may be useful to improve immunotherapy. However, the fate of these cells in vivo and how long they maintain their insensitivity to A2A/A2B adenosine receptor stimulation remain to be tested.
Acknowledgments
This work was supported by grants CA112561, CA111985 and AT002788 from the National Institutes of Health (to MS).
Glossary
Abbreviations:
- CFSE
carboxyfluorescein succinimidyl ester
- CGS
- CTL
cytotoxic T lymphocytes
- IFN-γ
interferon-γ
- mAb
monoclonal antibody
- NECA
5’-N-ethylcarboxamidoadenosine
- NECA-CTL
CTL developed in the presence of NECA
- PGE2
prostaglandin E2
Conflicts of interest
None.
References
- Annacker O, Pimenta-Araujo R, Burlen-Defranoux O, Barbosa TC, Cumano A, Bandeira A. CD25+ CD4+ T cells regulate the expansion of peripheral CD4 T cells through the production of IL-10. J Immunol. 2001;166:3008–3018. doi: 10.4049/jimmunol.166.5.3008. [DOI] [PubMed] [Google Scholar]
- Antony PA, Piccirillo CA, Akpinarli A, Finkelstein SE, Speiss PJ, Surman DR, et al. CD8+ T cell immunity against a tumor/self-antigen is augmented by CD4+ T helper cells and hindered by naturally occurring T regulatory cells. J Immunol. 2005;174:2591–2601. doi: 10.4049/jimmunol.174.5.2591. [DOI] [PMC free article] [PubMed] [Google Scholar]
- Apasov SG, Chen JF, Smith PT, Schwarzschild MA, Fink JS, Sitkovsky MV. Study of A(2A) adenosine receptor gene deficient mice reveals that adenosine analogue CGS 21680 possesses no A(2A) receptor-unrelated lymphotoxicity. Br J Pharmacol. 2000;131:43–50. doi: 10.1038/sj.bjp.0703532. [DOI] [PMC free article] [PubMed] [Google Scholar]
- Asseman C, Mauze S, Leach MW, Coffman RL, Powrie F. An essential role for interleukin 10 in the function of regulatory T cells that inhibit intestinal inflammation. J Exp Med. 1999;190:995–1004. doi: 10.1084/jem.190.7.995. [DOI] [PMC free article] [PubMed] [Google Scholar]
- von Boehmer H. Mechanisms of suppression by suppressor T cells. Nat Immunol. 2005;6:338–344. doi: 10.1038/ni1180. [DOI] [PubMed] [Google Scholar]
- Cham CM, Gajewski TF. Glucose availability regulates IFN-gamma production and p70S6 kinase activation in CD8+ effector T cells. J Immunol. 2005;174:4670–4677. doi: 10.4049/jimmunol.174.8.4670. [DOI] [PubMed] [Google Scholar]
- Cheever MA, Greenberg PD, Fefer A. Specificity of adoptive chemoimmunotherapy of established syngeneic tumors. J Immunol. 1980;125:711–714. [PubMed] [Google Scholar]
- Chen ML, Pittet MJ, Gorelik L, Flavell RA, Weissleder R, von Boehmer H, et al. Regulatory T cells suppress tumor-specific CD8 T cell cytotoxicity through TGF-beta signals in vivo. Proc Natl Acad Sci USA. 2005;102:419–424. doi: 10.1073/pnas.0408197102. [DOI] [PMC free article] [PubMed] [Google Scholar]
- Curiel TJ, Coukos G, Zou L, Alvarez X, Cheng P, Mottram P, et al. Specific recruitment of regulatory T cells in ovarian carcinoma fosters immune privilege and predicts reduced survival. Nat Med. 2004;10:942–949. doi: 10.1038/nm1093. [DOI] [PubMed] [Google Scholar]
- Day YJ, Marshall MA, Huang L, McDuffie MJ, Okusa MD, Linden J. Protection from ischemic liver injury by activation of A2A adenosine receptors during reperfusion: inhibition of chemokine induction. Am J Physiol Gastrointest Liver Physiol. 2004;286:G285–293. doi: 10.1152/ajpgi.00348.2003. [DOI] [PubMed] [Google Scholar]
- Deaglio S, Dwyer KM, Gao W, Friedman D, Usheva A, Erat A, et al. Adenosine generation catalyzed by CD39 and CD73 expressed on regulatory T cells mediates immune suppression. J Exp Med. 2007;204:1257–1265. doi: 10.1084/jem.20062512. [DOI] [PMC free article] [PubMed] [Google Scholar]
- Decking UK, Schlieper G, Kroll K, Schrader J. Hypoxia-induced inhibition of adenosine kinase potentiates cardiac adenosine release. Circ Res. 1997;81:154–164. doi: 10.1161/01.res.81.2.154. [DOI] [PubMed] [Google Scholar]
- Dudley ME, Rosenberg SA. Adoptive-cell-transfer therapy for the treatment of patients with cancer. Nat Rev Cancer. 2003;3:666–675. doi: 10.1038/nrc1167. [DOI] [PMC free article] [PubMed] [Google Scholar]
- Eltzschig HK, Thompson LF, Karhausen J, Cotta RJ, Ibla JC, Robson SC, et al. Endogenous adenosine produced during hypoxia attenuates neutrophil accumulation: coordination by extracellular nucleotide metabolism. Blood. 2004;104:3986–3992. doi: 10.1182/blood-2004-06-2066. [DOI] [PubMed] [Google Scholar]
- Erdmann AA, Gao ZG, Jung U, Foley J, Borenstein T, Jacobson KA, et al. Activation of Th1 and Tc1 cell adenosine A2A receptors directly inhibits IL-2 secretion in vitro and IL-2-driven expansion in vivo. Blood. 2005;105:4707–4714. doi: 10.1182/blood-2004-04-1407. [DOI] [PMC free article] [PubMed] [Google Scholar]
- Fredholm BB, IJzerman AP, Jacobson KA, Klotz KN, Linden J. International Union of Pharmacology. XXV. Nomenclature and classification of adenosine receptors. Pharmacol Rev. 2001;53:527–552. [PMC free article] [PubMed] [Google Scholar]
- Gajewski TF, Meng Y, Blank C, Brown I, Kacha A, Kline J, et al. Immune resistance orchestrated by the tumor microenvironment. Immunol Rev. 2006;213:131–145. doi: 10.1111/j.1600-065X.2006.00442.x. [DOI] [PubMed] [Google Scholar]
- Garín MI, Chu CC, Golshayan D, Cernuda-Morollón E, Wait R, Lechler RI. Galectin-1: a key effector of regulation mediated by CD4+CD25+ T cells. Blood. 2007;109:2058–2065. doi: 10.1182/blood-2006-04-016451. [DOI] [PubMed] [Google Scholar]
- Gattinoni L, Powell DJ, Jr, Rosenberg SA, Restifo NP. Adoptive immunotherapy for cancer: building on success. Nat Rev Immunol. 2006;6:383–393. doi: 10.1038/nri1842. [DOI] [PMC free article] [PubMed] [Google Scholar]
- Gorelik L, Flavell RA. Immune-mediated eradication of tumors through the blockade of transforming growth factor-beta signaling in T cells. Nat Med. 2001;7:1118–1122. doi: 10.1038/nm1001-1118. [DOI] [PubMed] [Google Scholar]
- Harris AL. Hypoxia – a key regulatory factor in tumour growth. Nat Rev Cancer. 2002;2:38–47. doi: 10.1038/nrc704. [DOI] [PubMed] [Google Scholar]
- Heijink IH, Vellenga E, Borger P, Postma DS, Monchy JG, Kauffman HF. Polarized Th1 and Th2 cells are less responsive to negative feedback by receptors coupled to the AC/cAMP system compared to freshly isolated T cells. Br J Pharmacol. 2003;138:1441–1450. doi: 10.1038/sj.bjp.0705193. [DOI] [PMC free article] [PubMed] [Google Scholar]
- Huang S, Apasov S, Koshiba M, Sitkovsky M. Role of A2a extracellular adenosine receptor-mediated signaling in adenosine-mediated inhibition of T-cell activation and expansion. Blood. 1997;90:1600–1610. [PubMed] [Google Scholar]
- Iwai Y, Ishida M, Tanaka Y, Okazaki T, Honjo T, Minato N. Involvement of PD-L1 on tumor cells in the escape from host immune system and tumor immunotherapy by PD-L1 blockade. Proc Natl Acad Sci USA. 2002;99:12293–12297. doi: 10.1073/pnas.192461099. [DOI] [PMC free article] [PubMed] [Google Scholar]
- Klaasse EC, Ijzerman AP, de Grip WJ, Beukers MW. Internalization and desensitization of adenosine receptors. Purinergic Signal. 2008;4:21–37. doi: 10.1007/s11302-007-9086-7. [DOI] [PMC free article] [PubMed] [Google Scholar]
- Kobayashi S, Zimmermann H, Millhorn DE. Chronic hypoxia enhances adenosine release in rat PC12 cells by altering adenosine metabolism and membrane transport. J Neurochem. 2000;74:621–632. doi: 10.1046/j.1471-4159.2000.740621.x. [DOI] [PubMed] [Google Scholar]
- Kobie JJ, Shah PR, Yang L, Rebhahn JA, Fowell DJ, Mosmann TR. T regulatory and primed uncommitted CD4 T cells express CD73, which suppresses effector CD4 T cells by converting 5′-adenosine monophosphate to adenosine. J Immunol. 2006;177:6780–6786. doi: 10.4049/jimmunol.177.10.6780. [DOI] [PubMed] [Google Scholar]
- Koshiba M, Kojima H, Huang S, Apasov S, Sitkovsky MV. Memory of extracellular adenosine A2A purinergic receptor-mediated signaling in murine T cells. J Biol Chem. 1997;272:25881–25889. doi: 10.1074/jbc.272.41.25881. [DOI] [PubMed] [Google Scholar]
- Koshiba M, Rosin DL, Hayashi N, Linden J, Sitkovsky MV. Patterns of A2A extracellular adenosine receptor expression in different functional subsets of human peripheral T cells. Flow cytometry studies with anti-A2A receptor monoclonal antibodies. Mol Pharmacol. 1999;55:614–624. [PubMed] [Google Scholar]
- Lappas CM, Rieger JM, Linden J. A2A adenosine receptor induction inhibits IFN-gamma production in murine CD4+ T cells. J Immunol. 2005;174:1073–1080. doi: 10.4049/jimmunol.174.2.1073. [DOI] [PubMed] [Google Scholar]
- Linden J. Molecular approach to adenosine receptors: receptor-mediated mechanisms of tissue protection. Annu Rev Pharmacol Toxicol. 2001;41:775–787. doi: 10.1146/annurev.pharmtox.41.1.775. [DOI] [PubMed] [Google Scholar]
- Nishimura T, Iwakabe K, Sekimoto M, Ohmi Y, Yahata T, Nakui M, et al. Distinct role of antigen-specific T helper type 1 (Th1) and Th2 cells in tumor eradication in vivo. J Exp Med. 1999;190:617–627. doi: 10.1084/jem.190.5.617. [DOI] [PMC free article] [PubMed] [Google Scholar]
- Ohta A, Sitkovsky M. Role of G-protein-coupled adenosine receptors in downregulation of inflammation and protection from tissue damage. Nature. 2001;414:916–920. doi: 10.1038/414916a. [DOI] [PubMed] [Google Scholar]
- Ohta A, Gorelik E, Prasad SJ, Ronchese F, Lukashev D, Wong MK, et al. A2A adenosine receptor protects tumors from antitumor T cells. Proc Natl Acad Sci USA. 2006;103:13132–13137. doi: 10.1073/pnas.0605251103. [DOI] [PMC free article] [PubMed] [Google Scholar]
- Ohta A, Lukashev D, Jackson EK, Fredholm BB, Sitkovsky M. 1,3,7-trimethylxanthine (caffeine) may exacerbate acute inflammatory liver injury by weakening the physiological immunosuppressive mechanism. J Immunol. 2007;179:7431–7438. doi: 10.4049/jimmunol.179.11.7431. [DOI] [PubMed] [Google Scholar]
- Powrie F, Carlino J, Leach MW, Mauze S, Coffman RL. A critical role for transforming growth factor-beta but not interleukin 4 in the suppression of T helper type 1-mediated colitis by CD45RB(low) CD4+ T cells. J Exp Med. 1996;183:2669–2674. doi: 10.1084/jem.183.6.2669. [DOI] [PMC free article] [PubMed] [Google Scholar]
- Puccetti P, Grohmann U. IDO and regulatory T cells: a role for reverse signalling and non-canonical NF-kappaB activation. Nat Rev Immunol. 2007;7:817–823. doi: 10.1038/nri2163. [DOI] [PubMed] [Google Scholar]
- Rabinovich GA, Liu FT, Hirashima M, Anderson A. An emerging role for galectins in tuning the immune response: lessons from experimental models of inflammatory disease, autoimmunity and cancer. Scand J Immunol. 2007;66:143–158. doi: 10.1111/j.1365-3083.2007.01986.x. [DOI] [PubMed] [Google Scholar]
- Raskovalova T, Lokshin A, Huang X, Su Y, Mandic M, Zarour HM, et al. Inhibition of cytokine production and cytotoxic activity of human antimelanoma specific CD8+ and CD4+ T lymphocytes by adenosine-protein kinase A type I signaling. Cancer Res. 2007;67:5949–5956. doi: 10.1158/0008-5472.CAN-06-4249. [DOI] [PubMed] [Google Scholar]
- Rodriguez PC, Quiceno DG, Zabaleta J, Ortiz B, Zea AH, Piazuelo MB, et al. Arginase I production in the tumor microenvironment by mature myeloid cells inhibits T-cell receptor expression and antigen-specific T-cell responses. Cancer Res. 2004;64:5839–5849. doi: 10.1158/0008-5472.CAN-04-0465. [DOI] [PubMed] [Google Scholar]
- Sevigny CP, Li L, Awad AS, Huang L, McDuffie M, Linden J, et al. Activation of adenosine 2A receptors attenuates allograft rejection and alloantigen recognition. J Immunol. 2007;178:4240–4249. doi: 10.4049/jimmunol.178.7.4240. [DOI] [PubMed] [Google Scholar]
- Shannon AM, Bouchier-Hayes DJ, Condron CM, Toomey D. Tumour hypoxia, chemotherapeutic resistance and hypoxia-related therapies. Cancer Treat Rev. 2003;29:297–307. doi: 10.1016/s0305-7372(03)00003-3. [DOI] [PubMed] [Google Scholar]
- Sitkovsky MV, Ohta A. The ‘danger’ sensors that stop the immune response: the A2 adenosine receptors? Trends Immunol. 2005;26:299–304. doi: 10.1016/j.it.2005.04.004. [DOI] [PubMed] [Google Scholar]
- Sitkovsky MV, Lukashev D, Apasov S, Kojima H, Koshiba M, Caldwell C, et al. Physiological control of immune response and inflammatory tissue damage by hypoxia-inducible factors and adenosine A2A receptors. Annu Rev Immunol. 2004;22:657–682. doi: 10.1146/annurev.immunol.22.012703.104731. [DOI] [PubMed] [Google Scholar]
- Steinbrink K, Jonuleit H, Müller G, Schuler G, Knop J, Enk AH. Interleukin-10-treated human dendritic cells induce a melanoma-antigen-specific anergy in CD8(+) T cells resulting in a failure to lyse tumor cells. Blood. 1999;93:1634–1642. [PubMed] [Google Scholar]
- Sutmuller RP, van Duivenvoorde LM, van Elsas A, Schumacher TN, Wildenberg ME, Allison JP, et al. Synergism of cytotoxic T lymphocyte-associated antigen 4 blockade and depletion of CD25(+) regulatory T cells in antitumor therapy reveals alternative pathways for suppression of autoreactive cytotoxic T lymphocyte responses. J Exp Med. 2001;194:823–832. doi: 10.1084/jem.194.6.823. [DOI] [PMC free article] [PubMed] [Google Scholar]
- Turk MJ, Guevara-Patiño JA, Rizzuto GA, Engelhorn ME, Sakaguchi S, Houghton AN. Concomitant tumor immunity to a poorly immunogenic melanoma is prevented by regulatory T cells. J Exp Med. 2004;200:771–782. doi: 10.1084/jem.20041130. [DOI] [PMC free article] [PubMed] [Google Scholar]
- Uyttenhove C, Pilotte L, Théate I, Stroobant V, Colau D, Parmentier N, et al. Evidence for a tumoral immune resistance mechanism based on tryptophan degradation by indoleamine 2,3-dioxygenase. Nat Med. 2003;9:1269–1274. doi: 10.1038/nm934. [DOI] [PubMed] [Google Scholar]
- Vang T, Torgersen KM, Sundvold V, Saxena M, Levy FO, Skalhegg BS, et al. Activation of the COOH-terminal Src kinase (Csk) by cAMP-dependent protein kinase inhibits signaling through the T cell receptor. J Exp Med. 2001;193:497–507. doi: 10.1084/jem.193.4.497. [DOI] [PMC free article] [PubMed] [Google Scholar]
- Vaupel P, Mayer A. Hypoxia in cancer: significance and impact on clinical outcome. Cancer Metastasis Rev. 2007;26:225–239. doi: 10.1007/s10555-007-9055-1. [DOI] [PubMed] [Google Scholar]
- Yang D, Zhang Y, Nguyen HG, Koupenova M, Chauhan AK, Makitalo M, et al. The A2B adenosine receptor protects against inflammation and excessive vascular adhesion. J Clin Invest. 2006;116:1913–1923. doi: 10.1172/JCI27933. [DOI] [PMC free article] [PubMed] [Google Scholar]
- Zarek PE, Huang CT, Lutz ER, Kowalski J, Horton MR, Linden J, et al. A2A receptor signaling promotes peripheral tolerance by inducing T-cell anergy and the generation of adaptive regulatory T cells. Blood. 2008;111:251–259. doi: 10.1182/blood-2007-03-081646. [DOI] [PMC free article] [PubMed] [Google Scholar]
- Zezula J, Freissmuth M. The A(2A)-adenosine receptor: a GPCR with unique features? Br J Pharmacol. 2008;153:S184–190. doi: 10.1038/sj.bjp.0707674. [DOI] [PMC free article] [PubMed] [Google Scholar]