Abstract
This paper considers the propagation of a liquid plug driven by a constant pressure within a rigid axisymmetric tube whose inner surface is coated by a thin liquid film. The Navier–Stokes equations are solved using the finite-volume method and the SIMPLEST algorithm. The effects of precursor film thickness, initial plug length, pressure drop across the plug, and constant surface tension on the plug behavior and tube wall mechanical stresses are investigated. As a plug propagates through a liquid-lined tube, the plug gains liquid from the leading front film, and it deposits liquid into the trailing film. If the trailing film is thicker (thinner) than the precursor film, the plug volume decreases (increases) as it propagates. For a decreasing volume, eventually the plug ruptures. Under a specific set of conditions, the trailing film thickness equals the precursor film thickness, which leads to steady state results. The plug speed decreases as the precursor film thins because the resistance to the moving front meniscus increases. As the pressure drop across the plug decreases, the plug speed decreases resulting in thinning of the trailing film. As the plug length becomes longer, the viscous resistance in the plug core region increases, which slows the plug and causes the trailing film to become even thinner. The magnitude of the pressure and shear stress at the tube inner wall is maximum in the front meniscus region, and it increases with a thinner precursor film. As the surface tension increases, the plug propagation speed decreases, the strength of the wall pressure in the front meniscus region increases, and the pressure gradient around the peak pressure becomes steeper.
INTRODUCTION
Liquid plugs form in pulmonary airways due to both internal and external liquid sources. Internally, the inner airway surfaces of the lung are covered by a thin liquid layer. This liquid layer is unstable and forms a plug due to a capillary instability1, 2, 3 if the film thickness is sufficiently large. When lung-surfactant availability is reduced, this tendency to form liquid plugs can be increased.4 This occurs particularly near the end of expiration in distal airways, causing the airways to close due to plug formation. Once formed, the liquid plug propagates driven by inhaled air and can rupture under certain conditions or persist under others. During the airway-reopening process, pulmonary epithelial cells may be damaged by mechanical stresses associated with fluid motion5, 6 and plug rupture.7
Externally, liquid is instilled into the pulmonary airways in some medical treatments such as surfactant replacement therapy (SRT),8, 9, 10, 11, 12 partial liquid ventilation (PLV),13, 14, 15, 16, 17, 18, 19 and drug delivery.20, 21, 22, 23, 24, 25, 26, 27, 28, 29 The formation of a liquid plug in the trachea, before inspiration, is important in creating a more uniform liquid distribution throughout the lung.30
Bilek et al.5 investigated surface-tension-induced lung epithelial cell damage in a model of airway reopening, consisting of a semi-infinite bubble (air finger) propagating in a narrow fluid-filled channel lined with pulmonary epithelial cells. They showed that cell damage increased with decreasing reopening velocity and that the presence of pulmonary surfactant prevented this injury. Based on a computational model, they concluded that the steep pressure gradient near the finger front was the most likely cause of the observed cellular damage. Kay et al.6 showed that cell damage was directly correlated with the pressure gradient, not the duration of stress exposure (period for a pressure wave to pass over a cell). Repeated reopening and closure caused the cell layer to be damaged, even under conditions that would not lead to extensive damage from a single reopening event.
Huh et al.7 investigated mechanical injury of primary human small airway epithelial cells (SAECs) caused by reopening stresses and respiratory crackles in compartmentalized microfluidic systems that can produce polarized and differentiated small airway epithelium in vitro. The microfluidic channel was lined with SAECs and a thin liquid film. Dynamic propagation and rupture of liquid plugs through the channel were generated by a microfluidic component. Exposure of the SAECs to physiological fluid mechanical stresses associated with surfactant-deficient airway reopening led to significant cellular damage whose severity was elevated with increasing frequency of plug propagation and rupture. Furthermore, plug rupture that generates explosive pressure and shear stress waves imposed a higher risk of cellular injury than plug propagation alone.
Most theoretical studies on plug propagation in liquid-lined channels or tubes, with or without surfactant, have been carried out in the Stokes flow regime, neglecting the effects of fluid inertia, that is, in the limit of zero Reynolds number. Howell et al.31 analyzed surfactant-free liquid plug propagation in a prewetted flexible tube in the asymptotic limit of Ca→0, where Ca=μU∕σ is the capillary number, μ is the fluid viscosity, σ is the surface tension, and U is the fluid speed. Since the viscous dissipation in the plug core region is negligibly small as Ca→0, they assumed a uniform pressure in the plug core. They identified a critical imposed pressure drop above which the liquid plug would eventually rupture. Waters and Grotberg32 asymptotically investigated the effects of soluble surfactant on liquid plug propagation. They showed that the driving pressure difference ΔP for a given Ca increased with increasing surface elasticity but decreased with the precursor film thickness. The trailing film thickness increased with ΔP, but at a slower rate when the surface elasticity was large.
Fujioka and Grotberg33 numerically investigated steady propagation of a liquid plug with a surfactant-free interface. They showed that the trailing film thickness decreased as the plug length decreases below the channel width. A capillary wave developed in the precursor film near the front meniscus as the Reynolds number increases. In this region, both wall pressure and shear stress have sharp peaks in the capillary wave located at the front interface. Particularly, with finite Reynolds number, these peak stresses are significantly larger than those at the rear. In addition, the single finger of air has a trailing film, which increases in thickness as Ca increases. Therefore, as the finger speed increases, the thickening trailing film moderates the increase of the wall shear stress in the transition region. These facts suggest that there is a higher risk of pulmonary epithelial cell damage in the front of the liquid plug than in the rear.
Subsequently, Fujioka and Grotberg numerically investigated the effect of surfactant on the steady propagation of a liquid plug within a two-dimensional channel.34 The Marangoni stress due to the gradient in the surface tension rigidifies the interface, which causes the precursor film thickness near the meniscus to be thicker than the leading film thickness and reduces the peaks of wall pressure and wall shear stress.
In our previous analysis,33 the precursor film thickness needed to equal the trailing film thickness due to the steady flow limit. Since the wall pressure and shear stress are strongly influenced by the film thickness, it is important to investigate the effect of precursor film thickness on these stresses. In this study, we perform a numerical analysis for time-dependent liquid plug propagation in a tube. The plug is driven by a constant pressure drop between the front and rear air phases. A constant surface tension is assumed. The effects of precursor film thickness, initial plug length, pressure drop, and surface tension on the fluid dynamics of liquid plugs are investigated.
METHOD
Model description
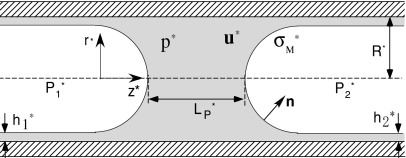
In this paper, we investigate the propagation of a liquid plug inside a circular rigid tube of radius R, as shown in Fig. 1. A pressure difference between the front and rear air fingers, , drives the liquid plug consisting of an incompressible Newtonian fluid. The gas-phase viscosity is assumed negligible, so only fluid dynamics in the liquid phase is considered. A constant surface tension is assumed. The plug is assumed to be axisymmetric about the center line of the tube, so that all quantities are uniform in the circumferential direction and the circumferential velocity is zero. Dimensionless forms of the Navier–Stokes equations and the continuity equation are
| (1) |
| (2) |
| (3) |
where u=(uz,ur,0)=u*∕(σM∕μ) is the dimensionless fluid velocity vector: μ is the liquid viscosity and σM is the surface tension of the air-liquid interface. p=p*∕(σM∕R) is the dimensionless pressure, R is the tube radius, t=t*∕(μR∕σM) is the time, z=z*∕R, and r=r*∕R. The dimensionless parameter λ=ρσMR∕μ2, where λ−1∕2 is called the Ohnesorge number, is determined by only the tube geometry and the properties of the fluid; thus, it characterizes the fluid and tube size. ρ is the liquid density. The subscript x in the time derivative indicates that the derivative follows a fixed (z,r) point.
Figure 1.
Liquid plug model.
The no-slip condition is applied on the tube wall, which is u=0 at r=1. For the axisymmetric condition, at the tube center r=0, the radial component of the velocity is zero,ur=0, and the gradient of the axial velocity in the r-direction is zero, ∂uz∕∂r=0. At the end boundaries in both the precursor and trailing films, a stationary condition is applied:u=0 and ∂p∕∂z=0. At each air-liquid interface, we apply a kinematic boundary condition,
| (4) |
where is the velocity of the interface node point and n is the unit vector normal to the interface. A balance of normal forces which accounts for the jump in stress due to surface tension is
| (5) |
where Pa is the air pressure (a=1 or 2), κ=κ*R is the dimensionless interface curvature, and ∇=ez(∂∕∂z)+er(∂∕∂r)+eθ(∂∕∂θ)∕r.
Coordinate transformation
The grid nodes were generated using the elliptic generation system35 where a uniform computational domain (ξ,η) is mapped inside a plug domain (z,r) that is determined by the solution of the two-dimensional Poisson’s equations. Local grid adjustment is done to satisfy a local orthogonal grid at the free surface:36 taking a vertex on the free surface, the local normal direction is taken into the interior and its first intersection with an interior cell face is selected as a new interior vertex. In terms of the transformed variables, the momentum equation is written as
| (6) |
where
| (7) |
| (8) |
| (9) |
| (10) |
and ∇ξ=eξ(∂∕∂ξ)+eη(∂∕∂η). Here A is the transformation matrix that represents the projected area of a control surface normal to the ith axis (representing ξ, η) onto the jth plane (representing z, r). The control volume is J=r−1∣A∣, the Jacobian of the transformation. The components of F are the mass flow rates through the control surface normal to the ξ and η axes and are defined as the velocities in the computational space. The primary diffusion terms, which include the Bij (i=j) components, represent the diffusive fluxes through the control surfaces normal to the ξ and η axes. The secondary diffusion terms, which include the Bij (i≠j) components which are zero if the mesh lines are orthogonal, represent artifacts from the geometric transformation and are treated as source terms in the computational model.
The transformed continuity equation is
| (11) |
Assuming that the interface corresponds to the η axis, the unit normal on the η axis can then be described by
| (12) |
and the kinematic boundary condition on the interface (η grid line) [Eq. 4] is modified to
| (13) |
Numerical procedure
The transformed equations [Eqs. 6, 11] are solved using the SIMPLEST algorithm (SIMPLE with splitting technique).37 A kinematic update scheme is employed to update the interface location.38 The velocity field is computed according to the following algorithm.
-
(1)
The calculation starts from the initial condition described in Sec. 2D.
-
(2)
The interface shapes are approximated using cubic splines39 as functions of the arc length along each interface. The normal and tangential vectors are calculated using the first derivative of the interpolated functions.
-
(3)
Poisson’s equations are solved using the SOR (successive over-relaxation method) scheme to generate the grid inside the domain.35 The geometric quantities such as the transformed matrix can then be calculated.
-
(4)The grid velocity is computed. In this study, the predicted grid velocity GP is defined by
where t1 is the current time, t0 is the previous time, Δt=t1−t0 is the time step, and XP(ξ,t1) is the grid point at the current time, which is updated during iteration steps.(14) -
(5)
The pressure is solved using the known temporary mass flux rates , which are computed from the discrete form of the momentum equation without the pressure term. The SUPERLU solver40 is used to solve the sparse linear system.
-
(6)
The momentum equations are solved using the pressure field pP obtained in step (5).
-
(7)
The pressure correction equation is solved using the predicted velocity field FP, which is the solution of the momentum equations obtained in step (6).
-
(8)
The velocity field is corrected by FPP=FP+F′. The correction is determined by the pressure correction values, p′, obtained in step (7) as F′=−B∇ξp′∕aP, where aP is a diagonal element of the linear system matrix for the momentum equations. The fluid velocity on the interface, , is not corrected at this step.
-
(9)The position of the interface is updated using the kinematic condition [Eq. 13]. Assuming G=GP+G′ and F=FP+F′, the correction for the grid velocity on the interface is
The interface grid position is updated by(15)
where RX is an under-relaxation factor, 0<RX⩽1, and n is a unit normal.(16) -
(10)
The pressure is solved again using the temporary mass flux rates , which are computed using FPP.
-
(11)
The second correction for the velocity field is made by applying , where pPPP is the solution in step (10).
-
(12)
Reset FPPP→F, X→XP. Steps (2)–(11) are repeated until F and G converge, which is defined by the differences from the previous iteration satisfying the convergence criteria.33
-
(13)
Increment time step and go to step (2).
Initial conditions
In this study, the course of liquid plug propagation in an axisymmetric tube is investigated. Initially, a liquid plug of length LP0 begins to move by a constant driving pressure, ΔP=P1−P2, which is the pressure difference between the front and rear air phases. The plug length LP is defined as the distance between the front and rear meniscus tips, where the tips are always located at r=0 on both interfaces for the axisymmetric plug. The initial plug shape is approximated by a hemisphere of radius 1−h2 for front and rear menisci, the length between both meniscus tips LP0, and a uniform film thickness of h2 on both sides of the plug. The initial liquid velocity is set to be zero uniformly. The precursor and trailing films are extended eight times the tube radius.
Dimensionless parameters
The dimensionless parameters are λ=ρσMR∕μ2, the initial plug length , the pressure drop across the plug ΔP=ΔP*∕(σM∕R), and the precursor film thickness . Since the properties of Survanta (Ross Labs, Columbus, OH), which is a highly surface-active and biologically derived pulmonary surfactant used in SRT, are ρ=0.94 g∕cm3, μ=42 cP, and σM=25 dyn∕cm,41 λ for SRT has a range of 1<λ<20 for airway generations from 0 to 13 in an infant lung. In PLV or airway closure, the values of λ are larger than those in SRT, and inertial effects cannot be neglected. For example, for perfluorocarborn Peflubron (Alliance Pharmaceuticals, San Diego, CA), ρ=1.93 g∕cm3, μ=2.1 cP, and σM=18 dyn∕cm.41 Thus, the range of λ is approximately 103<λ<104. For plugs created by an internal source in a surfactant-reduced lung, assuming ρ=1 g∕cm3, μ=10 cP, and σM=50 dyn∕cm, λ has a range of 102<λ<5×10³ for airway generations from 0 to 16 in an adult lung. In the present study, since we focus on a compromised lung, higher surface tension is assumed and hence λ=1000 is used.
The inspiratory positive airway pressure typically used for conventional mechanical ventilators is approximately 10 cm H2O. If this pressure acts on one side of a liquid plug in airways (ΔP*∼10×980 dyn∕cm2), the dimensionless pressure drop ΔP is O(10) at the airway of R∼0.1 cm and surface tension of 50 dyn∕cm. However, the actual ΔP will be smaller than this value due to pressure dissipation in the upper airways. In this study, for most of the computations, ΔP=1 is used.
The liquid film thickness in the small airways in the lung is approximately 0.02 of the airway radius according to measurements on guinea pig lungs by Yager et al.42 Unhealthy lungs commonly produce excessive bronchial secretions, which increase the film thickness to 0.2 of the airway radius.43 The precursor film thickness employed in the present study ranges from 0.01 to 0.13, and 0.05 is used as a base value.
According to a linear stability analysis for a thin film that coats the inner surface of a circular tube, the wavelength that maximizes the film growth rate is 23∕2π of the tube radius. Assuming an airway lined by a liquid film with thickness of 0.1–0.2 of the radius, if a plug forms, the length of the plug will be approximately 1. In this study, the initial plug length, LP0=1, is used as a base value.
Definition of plug rupture
When a liquid plug propagates, if the mass deposited to the trailing film is greater than the mass gained from the precursor film, the plug becomes shorter and shorter and eventually ruptures. At the time of plug rupture, the front and rear interfaces contact with each other, but the current numerical method cannot resolve this situation. When the interfaces become close, the inner iteration step [see Sec. 2C, step (12)] does not converge. In this study, we assume that the plug ruptures at this moment. For the present study, the inner iteration failed when LP becomes below 5×10⁻³.
Numerical mesh and time step
Since we employ a boundary fitted mesh, the mesh changes as the interface deforms. The grid structure is the same as our previous papers.33, 34 The number of node points is determined based on the previous studies. For the initial plug length LP0=1 case, 6201 total node points, 9 node points in film depth, 241 node points on each free surface, and 41 node points between the front and rear menisci tips is employed. The number of node points is fixed during each computation.
A time step of Δt=0.0982 (∼2π∕64) is used for all computations and is considered sufficiently small for the present problem since the range of the dimensionless velocity is small (Ca<0.05). We have examined the LP and Ca behaviors for three different time steps, Δt=2π∕32, 2π∕64, and 2π∕128, for h2=0.05, ΔP=1, λ=1000, and LP0=1. Att=100, LP=0.852, 0.858, and 0.860, and Ca=0.0283, 0.0283, and 0.0283; at t=200, LP=0.524, 0.554, and 0.558, and Ca=0.0360, 0.0356, and 0.0353; at t=270, LP=0.230, 0.279, and 0.281, and Ca=0.0414, 0.0401, and 0.0401, for Δt=2π∕32, 2π∕64, and 2π∕128. The difference between 2π∕64 and 2π∕128 was insignificant.
RESULTS
Effect of precursor film thickness
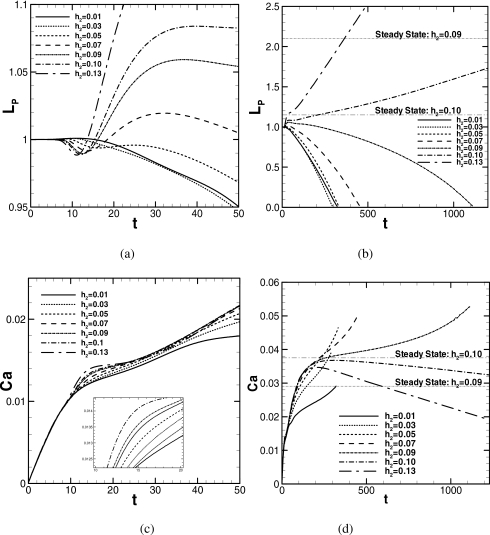
Figure 2 demonstrates how the plug length and speed change as the plug propagates for the various precursor film thicknesses h2 at λ=1000 for an initial plug length of LP0=1 and other initial conditions, as described in Sec. 2D. The course of LP is plotted in Figs. 2a, 2b, where (a) is a magnified plot for 0<t<50 of (b). The course of Ca is plotted in (c) and (d) in the same manner. At t=0, a constant pressure drop across the plug, ΔP=1, is prescribed and the plug begins to propagate. The dimensionless plug speed is Ca=μU∕σM, where U is defined as the average of at both meniscus tips. Here we examine the plug propagation for seven different values of the precursor film thickness h2. When the trailing film thickness is thicker than h2, the plug loses mass and LP decreases. On the other hand, when the trailing film thickness is thinner than h2, the plug gains mass and LP increases.
Figure 2.
Course of plug length and speed for different precursor film thicknesses. ΔP=1, LP0=1, and λ=1000. When LP→0, zP→7.24, 8.17, 10.5, 16.1, and 44.4 for h2=0.01, 0.03, 0.05, 0.07, and 0.09.
According to the steady plug propagation analysis, the trailing film thickness is mainly a function of the capillary number Ca.33 The steady solutions for h2=0.09 and 0.10 are plotted in Figs. 2b, 2d, which are obtained by applying the procedure described in Ref. 33. At t=0, the plug is accelerated by the pressure difference across it, and Ca increases. Figure 2a shows that, for 0<t<8, LP for all h2 (except for h2=0.13) remains almost unchanged; then LP for h2⩾0.05 is locally minimum between 10<t<20 and maximum in between 20<t<40. For h2⩽0.03, LP is maximum in between 10<t<15. Up to t∼100, the initial disturbance in LP decays. For t>100, LP increases for h2⩾0.10 or decreases for h2⩽0.09 [Fig. 2b]. Figure 2c shows that, until t∼10, Ca for all h2 increases similarly. For 10<t<20, the slope of the increasing Ca becomes gentle in turn from smaller h2, and then Ca increases with similar slope until t∼40. Figure 2d shows that, until t∼50, Ca increases almost similarly. For t>50, the slope of Ca for h2⩽0.05 becomes gentle compared to the slope for h2⩾0.07. Ca for h2⩾0.07 increases similarly until t∼150. For h2⩾0.10, Ca begins to decrease for t>150 because the total viscous resistance within the plug core increases due to the rising LP, as Fig. 2b shows.
Compared with the steady solution for h2=0.10, where h1=0.10, ΔP=1.0, λ=1000, LP,S=1.15, and CaS=0.0375 shown in Figs. 2b, 2d, the unsteady solution of Ca for h2=0.10 increases close to CaS but decreases without attaining to CaS after LP becomes greater than LP,S. For h2⩽0.09, after the initial disturbance, for t>100, LP decreases since the trailing film thickness becomes thicker than h2 as Ca increases. For these cases, LP decreases toward zero resulting in plug rupture. In this computational model, however, the moment of plug rupture cannot be resolved. We stopped the computation when it meets the condition described in Sec. 2F. For h2=0.01, 0.03, 0.05, 0.07, and 0.09, this happened when LP=2.97×10⁻³, 4.04×10⁻³, 4.23×10⁻³, 4.85×10⁻³, and 4.75×10⁻³. The decreasing rate of LP can be determined by the difference between the precursor and trailing film thicknesses multiplied by the plug speed, Ca. So, basically, the plug ruptures earlier for smaller h2. However, since Ca at a fixed t decreases as h2 decrease, the rate of mass loss for h2=0.01 is smaller than that for h2=0.03. Thus, the time to rupture for h2=0.01 is longer than for h2=0.03. Compared with the steady solution for h2=0.09, where h1=0.09, ΔP=1.0, λ=1000, LP,S=2.1, and CaS=0.0291, the unsteady solution of Ca for h2=0.09 increases and becomes larger than CaS; therefore, LP decreases without reaching LP,S.
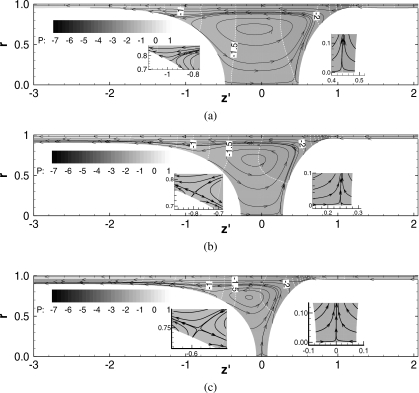
Figure 3 shows snapshots of the streamlines and pressure fields at (a) t=50, (b) t=200, and (c) t=300 for h2=0.05 of which LP and Ca are shown in Fig. 2. The horizontal axis for each plot, z′=z−zP, is a relative coordinate, where zP is at the middle of both meniscus tips. The streamlines are drawn in the velocity field relative to the plug speed, Ca; the relative flow field is (uz−Ca,ur), where Ca is the average of uz at both meniscus tips. In the film far ahead or behind the plug, since the liquid is static, the relative velocity is (−Ca,0). Thus, the streamlines in these static regions distribute corresponding to uniform flow. In the core, the streamline pattern shows a recirculation. Some streamlines that start from the meniscus interface are directed toward the trailing film, which indicates that the plug is losing mass.
Figure 3.
Flow and pressure field for h2=0.05. ΔP=1, LP0=1, λ=1000. (a) t=50; LP=0.97; Ca=0.021, zP=0.70. (b) t=200; LP=0.55, Ca=0.036, zP=5.18, and (c) t=300; LP=0.15, Ca=0.043, and zP=9.06.
At t=50, some of the streamlines end on the rear interface (see close-up plot). This indicates that this region of the rear interface is moving outward and the rear meniscus is elongating toward the tube axis. On the tube center axis, an inner stagnation point appears near the front interface tip (see close-up plot). A saddle point appears in the rear transition region at t=200 and 300 [see close-up plots in Figs. 3b, 3c]. When the plug length becomes very short, at t=300, LP=0.15 [Fig. 3c], the inner stagnation point on the tube centerline is located at the middle of both tips.
In this study, since the pressure in the front air phase is set to zero as a reference pressure, the pressure in the precursor film far ahead of the plug is −(1−h2)−1. The pressure in the rear air phase is P1=1, so the pressure in the trailing film is approximately 1−(1−h1)−1. In the plug core, the pressure is lower due to the surface tension on the curved interface. The pressure is lowest at the front transition region between the front meniscus and the precursor film. From the core near the rear meniscus to the trailing film, the liquid pressure increases in the transition region. Because at t=50 both meniscus shapes are still deforming from the initial hemisphere shape, the pressure profile in both transition regions changes between t=50 and 200. Between t=200 and 300, the pressure fields in both transition regions are almost the same.
If the trailing film thickness matches exactly the precursor film thickness, LP remains constant with time. Figure 4 shows the streamlines and pressure fields for the steady plug propagation of h2=0.10. There are four stagnation points appearing on the interface in the half plug domain, which are at the meniscus tips and off the tips.33
Figure 4.
Flow and pressure field for the steady propagation of plug. h1=h2=0.10, ΔP=1, λ=1000, LP,S=1.15, and CaS=0.0375.
Figure 5 shows the instantaneous streamline and pressure fields at t=300 for h2=0.13. For this case, LP increases as the plug propagates since the trailing film thickness is much thinner than h2 [Fig. 2b]. Since LP increases, some of the streamlines intercept on the interfaces, but the streamline pattern is different from the case shown in Fig. 3 in which LP is decreasing. Figure 5 shows a saddle point that appears near the front meniscus interface and an inner stagnation point that appears on the centerline near the rear meniscus. The locations of the saddle and stagnation points are on the opposite side, as compared to those in Figs. 3b, 3c.
Figure 5.
Streamline and pressure field at t=300 for h2=0.13. ΔP=1, LP0=1, LP=1.90, Ca=0.034, and zP=8.87.
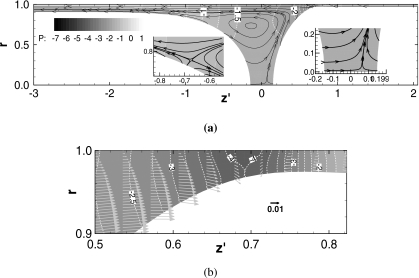
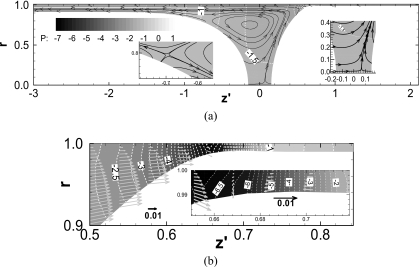
Figure 6 shows an instantaneous profile of (a) the streamlines and pressure field and (b) the velocity and pressure field in the precursor film near the front meniscus for h2=0.03 at t=232. The plug length is LP=0.3. In the core, a recirculation is observed in the streamline pattern. Some streamlines that start at the meniscus interface are directed toward the trailing film, indicating that the plug is losing mass. The pressure is lowest where the front meniscus interface contacts to the precursor film. The details for this are shown in Fig. 6b, where the velocity profiles (uz,ur) and the pressure field within 0.5<z′<0.82 are plotted. The velocity is zero at r=1.0 due to the no-slip condition. For z′<0.68, the velocity vectors are directed toward the z′-positive direction since the pressure gradient for z′,∂p∕∂z′, is negative. The pressure is minimum at z′=0.69, and ∂p∕∂z′ for z>0.71 is positive. This induces the flow to be directed toward the z′-negative direction. Since the fluid in this region is drained by this reverse flow, the film is aminimum thickness at z′=0.76 where the reverse flow velocity is maximum.
Figure 6.
Flow and pressure field for h2=0.03 when LP=0.3. t=232, h2=0.03, ΔP=1, LP0=1, λ=1000, and Ca=0.034. (a) The relative flow streamline and pressure field. (b) The velocity profiles and pressure field in the precursor film near the front meniscus.
For h2=0.01, as shown in Fig. 7a, the streamline pattern and the pressure profiles are similar to those for the h2=0.03 case. In this case, the plug length becomes LP=0.3 at t=245. The pressure is smallest at z′=0.66. Figure 7b shows that the minimum pressure value is even smaller than that for h2=0.03. The flow pattern is similar to that for h2=0.03, but the velocity gradient in r is much steeper because of the thinner precursor film thickness.
Figure 7.
Flow and pressure field for h2=0.01 when LP=0.3. t=245, h2=0.01, ΔP=1, LP0=1, λ=1000, and Ca=0.026. (a) The relative flow streamlines and pressure field. (b) The velocity profiles and pressure field in the precursor film near the front meniscus.
Wall pressure and shear stress
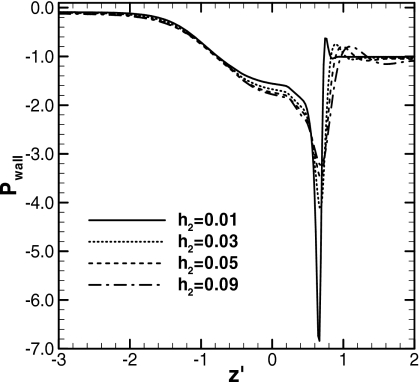
Figure 8 shows the pressure distributions along the wall for h2=0.01, 0.03, 0.05, and 0.09 at t=245, 232, 263, and 959, respectively. At these times, the plug length for each becomes LP=0.3. The plug speeds at these times are Ca=0.026, 0.034, 0.040, and 0.047. Pwall is minimum in the front transition region around z′=0.63–0.65. The absolute value of this negative peak in Pwall increases as h2 decreases. The pressure gradient around the peak becomes steeper as well.
Figure 8.
Wall pressure distributions when LP=0.3. ΔP=1, LP0=1, and λ=1000. For h2=0.01, t=245, Ca=0.026, and zP=5.05; for h2=0.03, t=232, Ca=0.034, and zP=5.82; for h2=0.05, t=263, Ca=0.040, and zP=7.54; for h2=0.09, t=959, Ca=0.047, and zP=36.5.
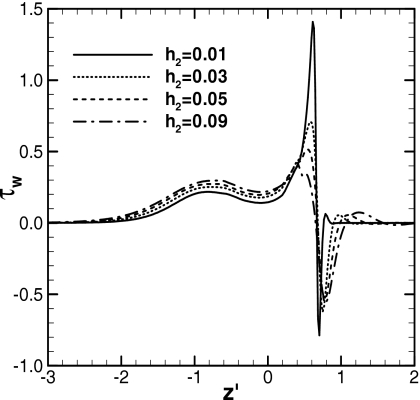
Figure 9 shows the dimensionless wall shear stress distributions for the cases shown in Fig. 8. The wall shear stress, τw=∂uz∕∂r, in both ends is zero because both films are static at the far ends. In the front meniscus region,z′=0.5–0.7, τw has peaks for both positive and negative directions because the direction of uz changes in this region, as shown in Figs. 67. The sign of τw changes at the point where the pressure is lowest. The absolute values of the positive and negative peaks increase as h2 decreases. The positive peaks appear at z′=0.6 for h2=0.03 and 0.01. At this location, Figs. 6b, 7b show that the distance between the meniscus surface and the tube wall is narrower for h2=0.01 than for h2=0.03. Since the gap between the moving front meniscus surface and the tube wall is narrower for smaller h2, the positive peak of τw increases. The plug speeds decrease as h2 decreases, but the narrowing gap increases the shear rate at these points. The drag force is the integration of τw; thus, the flow resistance increases in this region significantly as h2 decreases. In the rear meniscus transition region and the plug core, z′=−2.0–0.2, the difference in τw for h2 is insignificant. As h2 increases, Ca increases but τw increases weakly because the trailing film thickness increases with Ca and the wall shear rate does not increase as much as Ca.
Figure 9.
Wall shear stress distributions when LP=0.3. ΔP=1, LP0=1, and λ=1000. For h2=0.01, t=245, Ca=0.026, and zP=5.05; for h2=0.03, t=232, Ca=0.034, and zP=5.82; for h2=0.05, t=263, Ca=0.040, and zP=7.54; for h2=0.09, t=959, Ca=0.047, and zP=36.5.
Initial plug length
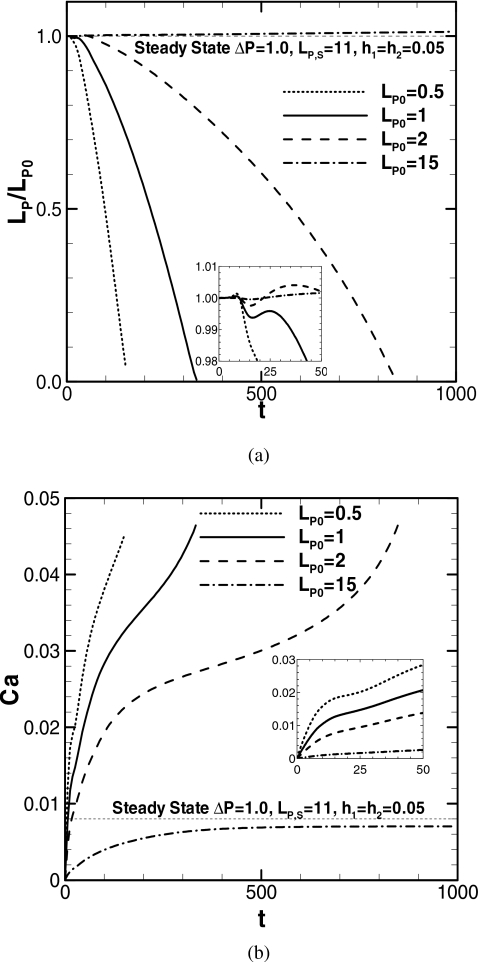
Figure 10 shows the effect of the initial plug length LP0 on plug length and speed as a function of time for LP0=0.5, 1, 2, and 15. The remaining parameters are fixed as ΔP=1, λ=1000, and h2=0.05. The steady solution of LP,S=11, λ=1000, h2=0.05, ΔP=1, and Cas=0.0093 is plotted for comparison. As LP0 increases, since the total mass of the plug and the viscous resistance in the core region also increase, the initial acceleration decreases. The plug speed at the time of rupture is almost independent of LP0. The time to rupture is not a simple linear function of LP0. Comparing LP0=1 and 2, the rupture time for LP0=2 is more than twice that for LP0=1. For LP0=0.5, 1, and 2, the times that the decreasing LP becomes 0.25 (corresponding LP∕LP0=0.5, 0.25, and 0.125) are t=97.8, 277, and 792, respectively. The corresponding Ca are 0.0377, 0.0406, and 0.0407, respectively. Since the plugs with LP0=1 and 2 propagate with almost the same speed, the influence of the initial condition can be considered to be diminished by this time. If LP0 is sufficiently long, there will not be a sufficiently large value of Ca at which the trailing film becomes thicker than the precursor film. A critical value of LP0 can exist at which the plug may not rupture under fixed ΔP and h2. If Ca is maintained below the steady solution value, which is Cas=0.008 under the condition in Fig. 10, the trailing film thickness is always less than h2=0.05. The steady solution is achieved when LP,S=11. Therefore, if LP>11, LP increases as the plug propagates. For LP0=15, Ca increases, then decreases for t>900 without attaining 0.008 because of the large viscous resistance in the core.
Figure 10.
Course of plug length (LP∕LP0) and speed for three different initial plug lengths. ΔP=1, λ=1000, and h2=0.05. When LP→0, zP→4.78, 10.5, and 24.2 for LP0=0.5, 1, and 2.
Pressure drop
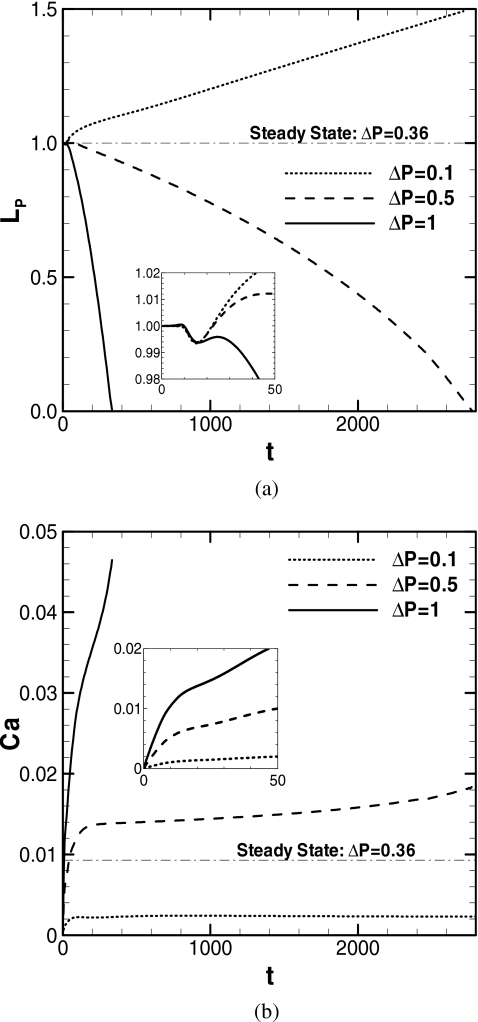
Figure 11 shows the plug length and speed versus time for three different values of the pressure drop across the plug, ΔP=1, 0.5, and 0.1. The remaining parameters are fixed as LP0=1, λ=1000, and h2=0.05. The steady solution of LP,S=1, λ=1000, h2=0.05, ΔP=0.36, and CaS=0.0093 is plotted for comparison. For all cases, LP decreases then increases initially, then it decreases (or increases) monotonically [see close-up in Fig. 11a]. For ΔP=1, the plug speed, Ca, increases with the steepest slope among these three cases. So the plug length LP decreases toward zero with the shortest time among them. For ΔP=0.5, LP goes to zero, but it takes a longer time than for ΔP=1. For ΔP=0.5, the Ca curve is quite different from that for ΔP=1; Ca increases initially, and then remains almost unchanged, indicating that ΔP balances with the viscous dissipation across the plug. For ΔP=0.5, LP continues to decrease since the trailing film is thicker than the precursor film of h2=0.05 for this level of Ca∼0.015. Since the plug shortens, the viscous resistance in the core decreases gradually and Ca gently increases as the plug propagates. For the steady solution, CaS=0.0093, the trailing film thickness equals h2. Thus, for Ca<CaS, the trailing film thickness is smaller than h2 and the plug persists propagating without rupture. For ΔP=0.1, LP increases and Ca plateaus at an even smaller value than for ΔP=0.5. For this plateau level of Ca which is less than CaS, the trailing film thickness is thinner than the precursor film thickness, h2=0.05. Since this plug elongates, the viscous resistance in the core increases and Ca gently decreases as it propagates. For a fixed LP0 and h2, a critical value of ΔP can exist, above which the plug will rupture.
Figure 11.
Course of plug length and its speed for different pressure drop across the plug. LP0=1, λ=1000, and h2=0.05. When LP→0, zP→10.5 and 41.5 for ΔP=1 and 0.5.
Effect of surface tension
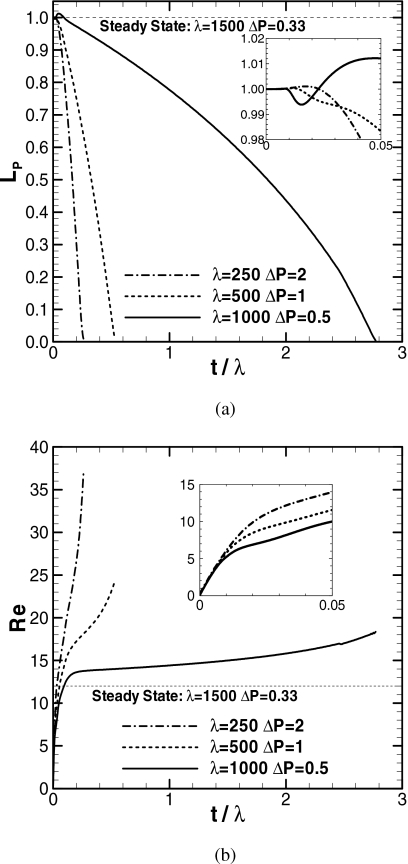
The effect of surface tension on plug propagation is examined for a fixed pressure drop and precursor film thickness. Since the dimensionless parameters, λ and ΔP, depend on the surface tension, these parameters are chosen at a fixed ΔPλ=ΔP*(ρR2∕μ2) so that ΔP*, ρ, R, and μ are fixed. Figure 12 shows the plug length and speed versus time for three different surface tension cases at a fixed pressure drop, ΔP λ=500, h2=0.05, and LP0=1. As λ increases, the surface tension on the interface increases. The time is rescaled as t∕λ=t*[μ∕(ρR2)]; the dimensionless plug speed is redefined as Re=Caλ=ρRU∕μ, which is the Reynolds number. The steady solution of LP,S=1, λ=1500, h2=0.05, ΔP=0.33, and ReS=12 is plotted for comparison. For all cases, after the initial transition in LP [see close-up in Fig. 12a], LP decreases with time and eventually the plug ruptures. The time to plug rupture is longer for larger λ, which indicates that a larger surface tension delays plug rupture. Since the plug speed, Re, at a fixed time is larger for smaller λ [Fig. 12b], LP decreases more rapidly for the smaller surface tension case. Also, since the capillary number, Ca=Re∕λ, is larger for smaller λ, the trailing film thickness is thicker for the smaller surface tension case. The total distances that the plug propagates are zP=5.45, 8.02, and 41.5 for λ=250, 500, and 1000, respectively. The plug propagation length increases with λ because the smaller rate of mass loss results in a longer time for plug propagation. If the surface tension is larger than the steady solution as λ>1500 and ΔP<0.33, the trailing film thickness is smaller than h2 and the plug will persist in propagation without rupture, which is similar to the ΔP=0.1 case shown in Fig. 11.
Figure 12.
Course of plug length and its speed for surface tensions. LP0=1, ΔPλ=500, and h2=0.05. When LP→0, zP→5.45, 8.02, and 41.5 for λ=250, 500, and 1000.
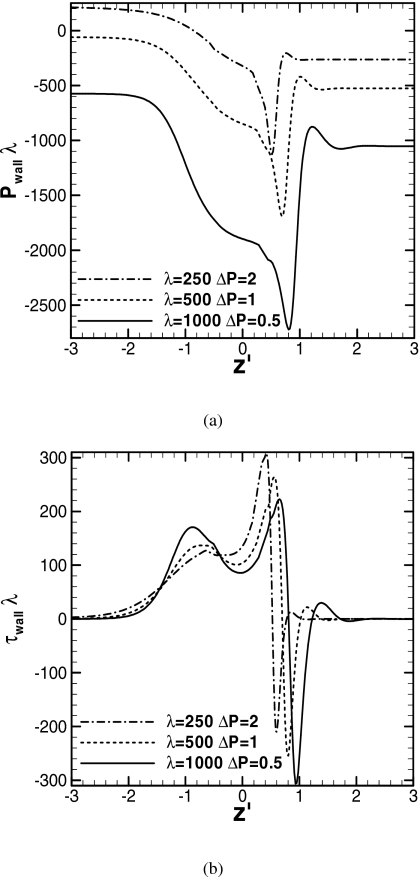
Figure 13 shows the wall pressure and shear stress distributions when LP=0.3 for three different surface tension cases. The plug speeds are Re=26, 21, and 17 at t∕λ=0.20, 0.42, and 2.3 for λ=250, 500, and 1000, respectively. The dimensionless pressure and shear stress are rescaled as and . As the surface tension increases, the pressures in both the precursor and trailing films decrease because the net force of the circumferential component of the surface tension reduces the liquid pressure. As the surface tension increases, the negative peak in pressure that appears in the front transition region decreases (more negative), and the steep pressure gradient around the peak becomes even greater. In the rear transition region, the pressure gradient becomes steeper with λ. For the wall shear stress, since the plug speed decreases as the surface tension increases, the positive peak in wall shear stress in the front region decreases. The capillary numbers for these cases are Ca=0.11, 0.041, and 0.017 for λ=250, 500, and 1000. Since the minimum film thickness in the front transition region decreases as Ca decreases,33, 44, 45 the negative peak in wall shear stress decreases (more negative) as the surface tension increases. In the rear transition region, the positive peak and the wall shear stress gradient increase with surface tension.
Figure 13.
Wall pressure and shear stress distributions for different surface tensions. LP0=1, ΔPλ=500, and h2=0.05. LP=0.3 for all, Re=26, 21, and 17 at t∕λ=0.20, 0.42, and 2.3 for λ=250, 500, and 1000.
DISCUSSION
When a liquid plug propagates through lung airways, airway epithelial cells are damaged by excessive mechanical stresses induced by the motion of fluid and surface tension.5, 6, 7 In this study, we have shown that the strength of the wall pressure and shear stress in the front transition region of the plug increases as the precursor film thins. The magnitude of these stresses is much larger than those in the rear transition region. Assuming an airway of R∼0.2 cm and σM∼50 dyn∕cm in a surfactant-reduced lung, the dimensional shear stresses for h2=0.01 and Ca=0.026 shown in Fig. 9 are about 50 dyn∕cm2 at z′=−0.8 in the rear transition region and 350 dyn∕cm2 at z′=0.6 in the front transition region where τw attains a positive peak. The pressure gradient in the front transition region is extremely large; the maximum ∂Pwall∕∂z is 104 with a dimensional value of 13 dyn cm−2∕μm. These values are large enough to induce lung epithelial cell damage.5, 6
As the surface tension increases, since the total resistance across the plug increases, the plug propagation speed decreases for a constant pressure drop across the plug, but the plug propagates a longer distance (see Fig. 12) since the trailing film is thinner. The wall pressure within the plug varies significantly and the variation increases as the surface tension increases (see Fig. 13). The wall pressure peaks in the front transition region. The magnitude of the peak wall pressure increases and the pressure gradient around the peak becomes even steeper as the surface tension increases. In the rear transition region, the pressure gradient also becomes steeper as the surface tension increases. When lung-surfactant availability is reduced, liquid plugs form and propagate more frequently.4 Therefore, airway epithelial cell damage may occur with higher probability for a larger region of an airway in surfactant-reduced lungs due to diseases such as respiratory distress syndrome (RDS). Lung airway length is approximately four to eight times the airway radius.46 For most of the cases investigated in this study, the distance that plugs propagate until rupture is longer than the airway length. Hence, the plug will split at bifurcations into two shorter plugs and continue propagating into the two daughter tubes.47, 48
The plug gains fluid from the leading front film and deposits fluid into the trailing film. If the trailing film is thicker than the precursor film, the plug volume decreases as it propagates and the plug will finally rupture. Although the trailing film thickness varies as functions of Ca, Re, and LP, it is primarily dependent on Ca.33 In this study, since we investigate unsteady plug propagation driven by a constant pressure drop across the plug, Ca varies with time, and it depends on the inertia and the resistance in the plug. The resistance across the plug can roughly be divided into three regional contributions; the front transition region, the core region, and the rear transition region. The resistance in the front transition region varies depending on the precursor film thickness. As Fig. 8 shows, the positive peak in wall shear stress within the front transition region increases as h2 decreases, indicating an increase in the resistance. The resistance in the core region depends on the plug length LP. Assuming Poiseuille flow in the core, the resistance is a linear function of LP. In the rear transition region, although the wall shear stress increases as Ca increases, the resistance decreases because the trailing film thickness increases with Ca.
When a plug propagates in a steady state under a given ΔP, h2, and λ, the plug length LP,S must be a definite length so that there is enough resistance in the core region to maintain the plug speed to be CaS, which causes the trailing film thickness to equal h2. When ΔP increases (decreases) slightly from a steady state, Ca increases (decreases) and consequently h1 increases (decreases), and hence LP decreases (increases) as the plug propagates. Since the resistance in the core decreases (increases) as LP decreases (increases), Ca increases (decreases) further. This may be similar when h2 increases (decreases) slightly from a steady state. Since h1 is less (greater) than h2, LP increases (decreases). Ca decreases (increases) as LP increases (decreases), which causes h1 to decrease (increase). So h1 becomes even smaller (larger) than h2. To clarify a stability criterion, further analysis is required.49
ACKNOWLEDGMENTS
The authors would like to thank Dr. Zierenberg and Dr. Bian for reading the manuscript. This work is supported by NIH Grant Nos. HL84370, HL64373, and HL85156, and NASA Grant No. NBEI-NNC04AA21A.
References
- Hughes J. M. B., Rosenzweig D. Y., and Kivitz P. B., “Site of airway closure in excised dog lungs: Histologic demonstration,” J. Appl. Physiol. 29, 340 (1970). [DOI] [PubMed] [Google Scholar]
- Macklem P. T., Proctor D. F., and Hogg J. C., “The stability of peripheral airways,” Respir. Physiol. 10.1016/0034-5687(70)90015-0 8, 191 (1970). [DOI] [PubMed] [Google Scholar]
- Kamm R. D. and Schroter R. C., “Is airway closure caused by a thin liquid instability?” Respir. Physiol. 10.1016/0034-5687(89)90059-5 75, 141 (1989). [DOI] [PubMed] [Google Scholar]
- Halpern D. and Grotberg J. B., “Fluid-elastic instabilities of liquid-lined flexible tubes,” J. Fluid Mech. 10.1017/S0022112092003227 244, 615 (1992). [DOI] [Google Scholar]
- Bilek A. M., Dee K. C., and Gaver D. P., “Mechanisms of surface-tension-induced epithelial cell damage in a model of pulmonary airway reopening,” J. Appl. Physiol. 10.1063/1.1582234 94, 770 (2003). [DOI] [PubMed] [Google Scholar]
- Kay S. S., Bilek A. M., Dee K. C., and Gaver D. P., “Pressure gradient, not exposure duration, determines the extent of epithelial cell damage in a model of pulmonary airway reopening,” J. Appl. Physiol. 10.1152/japplphysiol.01288.2003 97, 269 (2004). [DOI] [PubMed] [Google Scholar]
- Huh D., Fujioka H., Tung Y. C., Futai N., R.PaineIII, Grotberg J. B., and Takayama S., “Acoustically detectable cellular-level lung injury induced by fluid mechanical stresses in microfluidic airway systems,” Proc. Natl. Acad. Sci. U.S.A. 104, 18886 (2007). [DOI] [PMC free article] [PubMed] [Google Scholar]
- Robertson B., “Surfactant replacement therapy for severe neonatal respiratory distress syndrome: An international randomized clinical trial,” Pediatrics 82, 683 (1988). [PubMed] [Google Scholar]
- Long W., Thompson T., Sundell H., Schumacher R., Volberg F., and Guthrie R., “Effects of two rescue doses of a synthetic surfactant on mortality rate and survival without bronchopulmonary dysplasia in 700- to 1350-gram infants with respiratory distress syndrome. The American Exosurf Neonatal Study Group I,” J. Pediatr. (St. Louis) 10.1016/S0022-3476(05)83388-8 118, 595 (1991). [DOI] [PubMed] [Google Scholar]
- Zola E. M., Gunkel J. H., Chan R. K., Lim M. O., Knox I., Feldman B. H., Denson S. E., Stonestreet B. S., Mitchell B. R., Wyza M. M., Bennett K. J., and Gold A. J., “Comparison of 3 dosing procedures for administration of bovine surfactant to neonates with respiratory-distress syndrome,” J. Pediatr. (St. Louis) 10.1016/S0022-3476(05)83440-7 122, 453 (1993). [DOI] [PubMed] [Google Scholar]
- Yapicioglu H., Yildizdas D., Bayram I., Sertdemir Y., and Yilmaz H. L., “The use of surfactant in children with acute respiratory distress syndrome: Efficacy in terms of oxygenation, ventilation and mortality,” Pulm. Pharmacol. Ther. 10.1016/S1094-5539(03)00088-9 16, 327 (2003). [DOI] [PubMed] [Google Scholar]
- Salvia-Roiges M. D., Carbonell-Estrany X., Figueras-Aloy J., and Rodriguez-Miguelez J. M., “Efficacy of three treatment schedules in severe meconium aspiration syndrome,” Acta Paediatr. 93, 60 (2004). [PubMed] [Google Scholar]
- Hirschl R. B., Tooley R., Parent A. C., Johnson K., and Bartlett R. H., “Improvement of gas exchange, pulmonary function, and lung injury with partial liquid ventilation. A study model in a setting of severe respiratory failure,” Chest 10.1378/chest.108.2.500 108, 500 (1995). [DOI] [PubMed] [Google Scholar]
- Shaffer T. H. and Wolfson M. R., “Liquid ventilation: An alternative ventilation strategy for management of neonatal respiratory distress,” Eur. J. Pediatr. 155, S30 (1996). [DOI] [PubMed] [Google Scholar]
- Baden H. P., Mellema J. D., Bratton S. L., O’Rourke P. P., and Jackson J. C., “High-frequency oscillatory ventilation with partial liquid ventilation in a model of acute respiratory failure,” Crit. Care Med. 25, 299 (1997). [DOI] [PubMed] [Google Scholar]
- Leach C. L., Greenspan J. S., Rubenstein S. D., Shaffer T. H., Wolfson M. R., Jackson J. C., DeLemos R., and Fuhrman B. P., “Partial liquid ventilation with perflubron in premature infants with severe respiratory distress syndrome. The LiquiVent Study Group,” N. Engl. J. Med. 10.1056/NEJM199609123351101 335, 761 (1996). [DOI] [PubMed] [Google Scholar]
- Mikawa K., Nishina K., Takao Y., and Obara H., “Efficacy of partial liquid ventilation in improving acute lung injury induced by intratracheal acidified infant formula: Determination of optimal dose and positive end-expiratory pressure level,” Crit. Care Med. 32, 209 (2004). [DOI] [PubMed] [Google Scholar]
- Choi C. W., Hwang J. H., Chang Y. S., and Park W. S., “Combined effect of low-dose nitric oxide gas inhalation with partial liquid ventilation on hemodynamics, pulmonary function, and gas exchange in acute lung injury of newborn piglets,” J. Korean Med. Sci. 18, 813 (2003). [DOI] [PMC free article] [PubMed] [Google Scholar]
- Cox P. N., Frndova H., Karlsson O., Holowka S., and Bryan C. A., “Fluorocarbons facilitate lung recruitment,” Intensive Care Med. 10.1007/s00134-003-1881-1 29, 2297 (2003). [DOI] [PubMed] [Google Scholar]
- Weiss D. J., Bonneau L., and Liggitt D., “Use of perfluorochemical liquid allows earlier detection of gene expression and use of less vector in normal lung and enhances gene expression in acutely injured lung,” Molecular Therapy 3, 734 (2001). [DOI] [PubMed] [Google Scholar]
- Nakazawa K., Yokoyama K., Matsuzawa Y., Makita K., and Amaha K., “Pulmonary administration of prostacyclin (PGI(2)) during partial liquid ventilation in an oleic acid-induced lung injury: inhalation of aerosol or intratracheal instillation?” Intensive Care Med. 10.1007/s001340000756 27, 243 (2001). [DOI] [PubMed] [Google Scholar]
- Dickson E. W., Heard S. O., Tarara T. E., Weers J. G., Brueggemann A. B., and Doern G. V., “Liquid ventilation with perflubron in the treatment of rats with pneumococcal pneumonia,” Crit. Care Med. 30, 393 (2002). [DOI] [PubMed] [Google Scholar]
- Yu J. and Chien Y. W., “Pulmonary drug delivery: Physiologic and mechanistic aspects,” Crit. Rev. Ther. Drug Carrier Syst. 14, 395 (1997). [PubMed] [Google Scholar]
- Raczka E., Kukowska-Latallo J. F., Rymaszewski M., Chen C., and Baker J. R., “The effect of synthetic surfactant Exosurf on gene transfer in mouse lung in vivo,” Gene Ther. 10.1038/sj.gt.3300752 5, 1333 (1998). [DOI] [PubMed] [Google Scholar]
- Jobe A. H., Ueda T., Whitsett J. A., Trapnell B. C., and Ikegami M., “Surfactant enhances adenovirus-mediated gene expression in rabbit lungs,” Gene Ther. 3, 775 (1996). [PubMed] [Google Scholar]
- Jensen O. E., Halpern D., and Grotberg J. B., “Transport of a passive solute by surfactant-driven flows,” Chem. Eng. Sci. 10.1016/0009-2509(94)85083-6 49, 1107 (1994). [DOI] [Google Scholar]
- Zhang Y. L., Matar O. K., and Craster R. V., “A theoretical study of chemical delivery within the lung using exogenous surfactant,” Med. Eng. Phys. 10.1016/S1350-4533(02)00190-X 25, 115 (2003). [DOI] [PubMed] [Google Scholar]
- Iqbal S., Ritson S., Prince I., Denyer J., and Everard M. L., “Drug delivery and adherence in young children,” Pediatr. Pulmonol. 37, 311 (2004). [DOI] [PubMed] [Google Scholar]
- Myrdal P. B., Karlage K. L., Stein S. W., Brown B. A., and Haynes A., “Optimized dose delivery of the peptide cyclosporine using hydrofluoroalkane-based metered dose inhalers,” J. Pharm. Sci. 10.1002/jps.20025 93, 1054 (2004). [DOI] [PubMed] [Google Scholar]
- Cassidy K. J., Bull J. L., Glucksberg M. R., Dawson C. A., Haworth S. T., Hirschl R. B., Gavriely N., and Grotberg J. B., “A rat lung model of instilled liquid transport in the pulmonary airways,” J. Appl. Physiol. 10.1063/1.1381556 90, 1955 (2001). [DOI] [PubMed] [Google Scholar]
- Howell P. D., Waters S. L., and Grotberg J. B., “The propagation of a liquid bolus along a liquid-lined flexible tube,” J. Fluid Mech. 10.1017/S0022112099007417 406, 309 (2000). [DOI] [Google Scholar]
- Waters S. L. and Grotberg J. B., “The propagation of a surfactant laden liquid plug in a capillary tube,” Phys. Fluids 10.1063/1.1416496 14, 471 (2002). [DOI] [Google Scholar]
- Fujioka H. and Grotberg J. B., “Steady propagation of a liquid plug in a two-dimensional channel,” J. Biomech. Eng. 10.1115/1.1798051 126, 567 (2004). [DOI] [PubMed] [Google Scholar]
- Fujioka H. and Grotberg J. B., “The steady propagation of a surfactant-laden liquid plug in a two dimensional channel,” Phys. Fluids 10.1063/1.1948907 17, 082102 (2005). [DOI] [Google Scholar]
- Thompson J. F., Soni B. K., and Weatherill N. P., Handbook of Grid Generation (CRC, Boca Raton, 1999). [Google Scholar]
- Wesseling P., Segal A., Kassels C. G. M., and Bijl H., “Computing flows on general two-dimensional nonsmooth staggered grids,” J. Eng. Math. 10.1023/A:1004341115180 34, 21 (1998). [DOI] [Google Scholar]
- Xue S. C., Phanthien N., and Tanner R. I., “Numerical study of secondary flows of viscoelastic fluid in straight pipes by an implicit finite-volume method,” J. Non-Newtonian Fluid Mech. 10.1016/0377-0257(95)01365-3 59, 191 (1995). [DOI] [Google Scholar]
- Muzaferija S. and Peric M., “Computation of free-surface flows using the finite-volume method and moving grids,” Numer. Heat Transfer, Part B 10.1080/10407799708915014 32, 369 (1997). [DOI] [Google Scholar]
- Press W. H., Teukolsky S. A., Vellerling W. T., and Flannery B. P., Numerical Recipes in C, 2nd ed. (Cambridge University Press, Cambridge, 1992). [Google Scholar]
- Demmel J. W., Eisenstat S. C., Gilbert J. R., Li X. Y. S., and Liu J. W. H., “A supernodal approach to sparse partial pivoting,” SIAM J. Matrix Anal. Appl. 10.1137/S0895479895291765 20, 720 (1999). [DOI] [Google Scholar]
- Cassidy K. J., Gavriely N., and Grotberg J. B., “Liquid plug flow in straight and bifurcating tubes,” J. Biomech. Eng. 10.1115/1.1406949 123, 580 (2001). [DOI] [PubMed] [Google Scholar]
- Yager D., Cloutier T., Feldman H., Bastacky J., Drazen J. M., and Kamm R. D., “Airway surface liquid thickness as a function of lung volume in small airways of the guinea pig,” J. Appl. Physiol. 77, 2333 (1994). [DOI] [PubMed] [Google Scholar]
- Sackner M. A. and Kim C. S., “Phasic flow mechanisms of mucus clearance,” Eur. J. Respir. Dis. Suppl. 153, 159 (1987). [PubMed] [Google Scholar]
- Bretherton F. P., “The motion of long bubbles in tubes,” J. Fluid Mech. 10.1017/S0022112061000160 10, 166 (1961). [DOI] [Google Scholar]
- Giavedoni M. D. and Saita F. A., “The rear meniscus of a long bubble steadily displacing a Newtonian liquid in a capillary tube,” Phys. Fluids 10.1063/1.869951 11, 786 (1999). [DOI] [Google Scholar]
- Weibel E. R. and Gomez D. M., “Architecture of the human lung,” Science 10.1126/science.137.3530.577 137, 577 (1962). [DOI] [PubMed] [Google Scholar]
- Zheng Y., Anderson J. C., Suresh V., and Grotberg J. B., “Effect of gravity on liquid plug transport through an airway bifurcation model,” J. Biomech. Eng. 10.1115/1.1992529 127, 798 (2005). [DOI] [PubMed] [Google Scholar]
- Zheng Y., Fujioka H., Grotberg J. C., and Grotberg J. B., “Effects of inertia and gravity on liquid plug splitting at a bifurcation,” J. Biomech. Eng. 10.1115/1.2246235 128, 707 (2006). [DOI] [PubMed] [Google Scholar]
- Campana D. M., Ubal S., Giavdoni M. D., and Saita F. A., “Stability of the steady motion of a liquid plug in a capillary tube,” Ind. Eng. Chem. Res. 10.1021/ie0612414 46, 1803 (2007). [DOI] [Google Scholar]


