Abstract
The maximum area of complete spatial summation (i.e., Ricco’s area) for human short-wavelength-sensitive-(S-) and long-wavelength-sensitive- (L-) cone mechanisms was measured psychophysically at the fovea and at 1.5°, 4°, 8°, and 20° along the vertical meridian in the superior retina. Increment thresholds were measured for three observers by a temporal two-alternative forced-choice procedure. Test stimuli ranging from −0.36 to 4.61 log area (min2) were presented on concentric 12.3° adapting and auxiliary fields, which isolated either an S- or an L-cone mechanism on the plateau of its respective threshold versus intensity function. Test flash durations were 50 and 10 ms for the S- and L-cone mechanisms, respectively. The data indicate that, from 0° to 20°, Ricco’s area increases monotonically for the L-cone mechanism, is variable for the S-cone mechanism, and is larger for the S-cone mechanism than for the L-cone mechanism for essentially all retinal locations. This pattern of results most likely reflects differences in ganglion cell density and changes in neural convergence with retinal eccentricity.
1. INTRODUCTION
The ability of humans to resolve objects is limited by spatial summation or neural convergence. As defined by Ricco’s law, complete spatial summation occurs when the product of stimulus area and threshold intensity is constant.1 The term Ricco’s area refers to the largest area at which Ricco’s law is preserved. It has been proposed that Ricco’s area represents the center size of ganglion cell receptive fields2–4 or is related to ganglion cell density.5,6 DaVila and Geisler,7 though, have suggested that under photopic conditions preneural factors rather than neural factors account for the size of Ricco’s area in the fovea.
Ricco’s law has been measured under both scotopic (e.g., Refs. 6 and 8–12) and photopic (e.g., Refs. 2, 3, 9, 10, and 13–18; cf. Refs. 14 and 19) conditions. Photopic studies of Ricco’s area have differed, though, in the experimental conditions that were employed, including variations in retinal eccentricity, stimulus duration, background intensity, and spectral composition. These factors alone or in combination may have influenced the mechanism(s) responsible for visual detection and, therefore, the size of Ricco’s area. When stimulus duration and background conditions were held constant across retinal eccentricity, it was found that Ricco’s area increased with increasing retinal eccentricity.2,3,16–18 Likewise, investigating only one retinal eccentricity, Barlow10 demonstrated under mesopic and photopic conditions that shorter stimulus durations resulted in larger areal summation but that, as both the background intensity and the stimulus duration increased, summation areas decreased in size. It is unclear from these studies which cone, or even possibly rod, pathways influenced the size of Ricco’s area. None of these studies, except Brindley’s,15 attempted to isolate the contribution of each cone type within or across retinal eccentricity.
Particularly relevant to understanding the possible physiological constraints that define Ricco’s area are the changes in the distribution of the cone types across retinal eccentricity. Anatomical and psychophysical studies of the human retina have shown that the distribution of short-wavelength-sensitive (S) cones differs from that of the middle-wavelength-sensitive (M) and the long-wavelength-sensitive (L) cones.20–23 Whereas the density of M and L cones peaks in the fovea and decreases exponentially until approximately 7°–8° retinal eccentricity, there are few, if any, S cones in the center of the fovea. The density of S cones is greatest along the foveal slope between 0.5° and 1.5° retinal eccentricity and declines until 7°–8° retinal eccentricity. The density of S cones is less than that of the M and L cones at all retinal locations and represents approximately 0–15% of the total cone population at a given eccentricity. For many observers the estimated ratio of L to M cones is approximately 2:1 across the retina24,25 (cf. Refs. 26–28); thus, at a given retinal location, there will be more L cones than M cones and more M cones than S cones. If Ricco’s area is related to cone density, then the size of Ricco’s area will vary depending on which cone mechanism is mediating the detection of the test stimulus.
As mentioned above, the size of Ricco’s area may be related to ganglion cell density. It is now known that the blue/yellow (B/Y) bistratified ganglion cells29 receive excitatory input from the S cones and represent approximately 1–3% of the ganglion cells in the central retina, increasing to 6–10% in the far periphery.30–32 M and L cones send their input to the on- and off-center midget ganglion cells and the on- and off-center parasol ganglion cells. The midget ganglion cells represent 90% of the human ganglion cells in the central retina, decreasing to 40–50% in the peripheral retina, whereas the parasol ganglion cells represent 5–6% of the human ganglion cells in the central retina and then increase to 10% in the peripheral retina.31 In the foveal center, the ratio of ganglion cells to photoreceptors is more than 3:1 in the macaque monkey.33 As retinal eccentricity increases from the foveal slope, the number of ganglion cells becomes less than the number of cones, so that there is a convergence of cone signals onto ganglion cells.31,34,35 Thus, although the density of the ganglion cells changes from 8° retinal eccentricity and beyond, the density of cones remains relatively constant over the same retinal eccentricities.
The primary purposes of this study were to measure areas of complete spatial summation in S- and L-cone mechanisms and to evaluate the relation between various retinal units and the size of Ricco’s area across eccentricity. Retinal locations were selected to include the peak density for the two cone types (0° for L cones, 1.5° for S cones) as well as the area of low density for each (8° and 20° for L cones, 0° for S cones). Retinal regions were also chosen to represent the least convergence of cone signals onto ganglion cells (0°–4°) and the greatest convergence (20°). Measurements were made in the superior quadrant because the decline in total number of cones and ganglion cells across eccentricity is greatest along the vertical meridian22,34 and the density of S cones is slightly greater in the superior quadrant than in the other retinal quadrants.23 One predicted result was that for each of the isolated cone mechanisms the size of Ricco’s area would vary with changes in cone density. The smallest Ricco’s area would correspond to retinal eccentricities that had peak cone density, and, conversely, the largest Ricco’s area would be located at retinal eccentricities of lowest cone density. Furthermore, if the density of cones mediated the size of Ricco’s area from 8° to 20° retinal eccentricity, there would be no increase in Ricco’s area from 8° to 20° retinal eccentricity. In contrast, if the density of ganglion cells was the primary determinant of Ricco’s area, there would be an increase in its size from 8° to 20° retinal eccentricity.
2. METHODS
A. Observers
Two females, 21 and 41 years of age, and one male, 43 years of age, served as observers for this study. All were color normal as assessed by the Farnsworth Panel D-15 test, the Neitz anomaloscope, the F2 tritan plate, and H-R-R pseudoisochromatic plates; all were free of retinal disease and other ocular abnormalities. All observers were corrected for optical infinity. The right pupil of each observer was dilated with one drop of tropicamide (1%) for testing at 20° retinal eccentricity.
B. Apparatus
Three channels of a standard five-channel Maxwellian-view optical system were used. The light source for channels 1 and 2 was a 1000-W xenon lamp and for channel 3 was a 300-W xenon lamp. Light from all three channels was collimated and passed through water baths to attenuate the infrared radiation. In channels 1 and 3, light was focused onto a grating monochromator (Instruments SA, 5-nm half-bandpass) to define the spectral composition of the test stimulus and the auxiliary field, respectively. An interference filter (Ditric, 8-nm bandpass at half-power) placed in a collimated portion of channel 2 determined the spectral composition of the background field. A liquid-crystal shutter (Displaytech Model LV1300AC) placed in a collimated portion of channel 1 controlled the test light duration. Light intensity in all three channels was controlled by neutral-density filters and neutral-density wedges. Channels 1 and 2 were combined by a beam splitter and were then combined with channel 3 by another beam splitter. The beam from the combined channels was focused onto an artificial pupil. Light leaving the artificial pupil passed through the final pair of Maxwellian lenses to focus a 1.5-mm-diameter image onto the plane of the observer’s pupil.
All the mirrors were front surfaced, and all the lenses were achromatic doublets. The wedge positions and the shutter were controlled by computer. The computer also controlled the staircase procedure for data collection.
An auxiliary optical channel permitted the experimenter to align the observer with respect to the optic axis of the Maxwellian-view system. A dental-impression bite bar mounted to a milling table maintained the observer’s head position. This system allowed the experimenter to adjust the position of the observer’s eye in three orthogonal directions to achieve alignment to the optic axis.
C. Stimuli
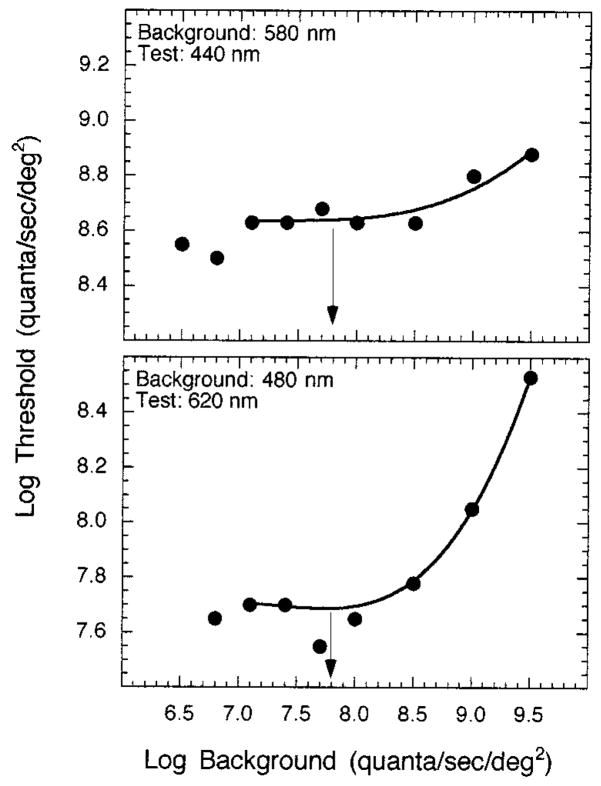
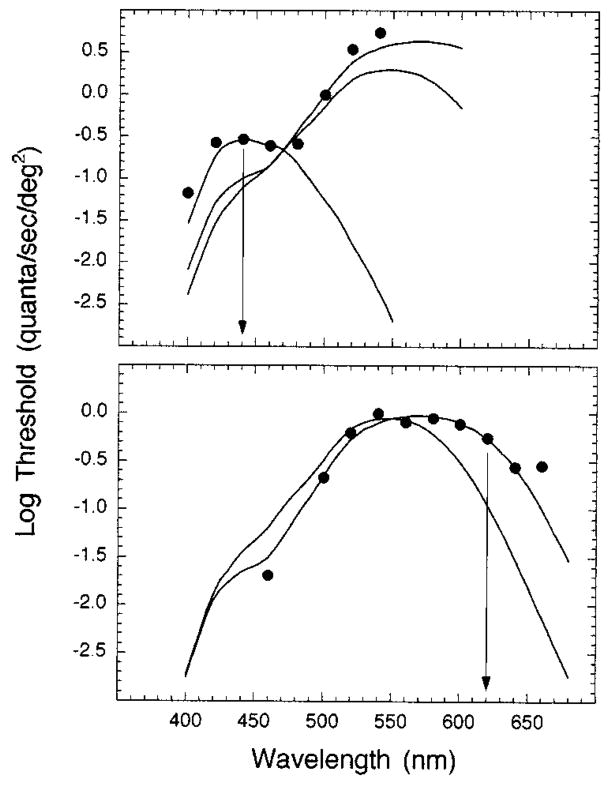
The stimuli consisted of a series of circular test stimuli (−0.36 to 4.61 log min2) concentric with superposed 12.3° background and auxiliary fields. Stimuli were centered along the vertical meridian of the superior retina at five eccentricities (0°, 1.5°, 4.0°, 8.0°, and 20.0°). The wavelength and the duration of the test stimuli and the intensity of the background fields were selected to isolate Sand L-cone mechanisms, while the wavelength and the intensity of the auxiliary fields were chosen to minimize rod contribution. These stimulus conditions were based on the results of increment threshold and test sensitivity experiments as well as on a previous study by Bieber et al.36 As shown in Fig. 1 for the fovea, threshold-versus-intensity (t.v.i.) curves were obtained under conditions that isolated the S- (top) and the L- (bottom) cone mechanisms. Background intensity was selected from the plateau of each function (arrows), and test sensitivity functions were measured at this background intensity (7.8 log quanta/s/deg2) to verify the mechanism responsible for detection. Figure 2 shows the test sensitivity functions measured at the fovea for one observer. The arrows denote the test wavelengths used in the main experiments.38 Thus the conditions for isolating an S-cone mechanism were a 50-ms, 440-nm test light concentric with a 580-nm, 7.8-log quanta/s/deg2 background field and a 520-nm, 7.2-log quanta/s/deg2 auxiliary field. Isolation of an L-cone mechanism was achieved by use of a 10-ms, 620-nm test light concentric with a 480-nm, 7.8-log quanta/s/deg2 background field and a 450-nm, 7.4-log quanta/s/deg2 auxiliary field. The fixation points for retinal eccentricities <8° were produced by four opaque, pin-sized points on a glass coverslip interposed in a collimated beam that formed the background channel. At 8° and 20° a red LED was used as a fixation point.
Fig. 1.
T.v.i. functions measured in the fovea, shown for conditions that isolated an S-cone mechanism (top) and an L-cone mechanism (bottom) for one observer. Arrows denote the background intensity levels chosen to measure test sensitivities and Ricco’s area.
Fig. 2.
Test sensitivities under conditions that isolated S-cone (top) and L-cone (bottom) mechanisms in the fovea for one observer. Arrows denote the wavelength of the test stimuli chosen to measure Ricco’s area. Solid curves are the fundamentals of DeMarco et al.37
D. Calibration
Radiometric measurements and calibration of neutral-density wedges and filters were made with a silicon photodiode and a linear readout system (United Detector Technology 81 optometer). Photometric measurements were made at 550 nm with a Minolta (LS-100) photometer, and Westheimer’s39 method was used to compute retinal illuminance. Monochromators were calibrated with a He–Ne laser (632.8 nm).
E. Procedure
All observers dark adapted for 10 min before data collection. Three minutes of chromatic adaptation followed, during which observers were asked to view the appropriate fixation point for the retinal region to be tested. Subsequently, the observer continued fixation and a test stimulus was superimposed upon the background and auxiliary fields during one of two temporal intervals preceded by a warning tone and separated by 3.5 s. The observer indicated the interval in which the test stimulus was detected by pressing a button. The staircase procedure was combined with a temporal, two-alternative forced-choice, transformed up–down method.40 Three correct answers were needed for the intensity of the stimulus to be decreased, and one incorrect answer resulted in an increase in the intensity of the stimulus. The initial step size of the staircase was 0.3 log unit and was decreased to 0.1 log unit after the second reversal. The staircase continued until there were four reversals at the smallest step size. The geometric mean of the last four intensity values defined the increment threshold for each test size. This criterion corresponded to 79% detection of the test stimulus at threshold. Increment thresholds for one cone mechanism at one retinal eccentricity were collected in a single test session. Each session lasted approximately 1.5–2 h, and each observer participated in one or two sessions per retinal eccentricity for each cone mechanism.
3. RESULTS
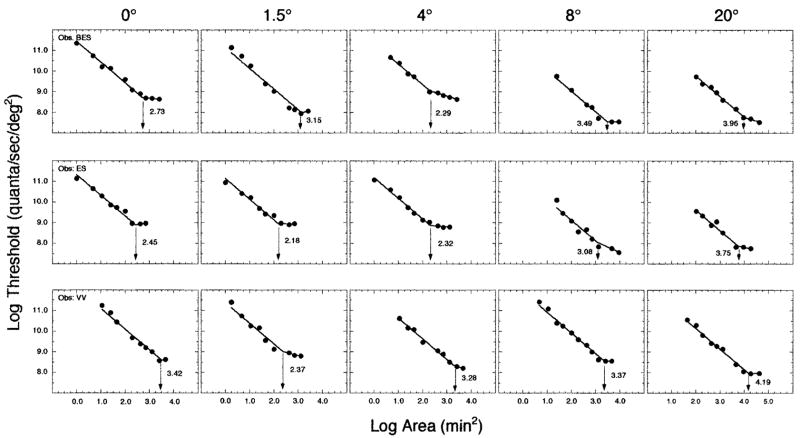
Figure 3 presents the results from experiments that isolated an S-cone mechanism. Log threshold is plotted as a function of log area. Each column denotes a different retinal eccentricity; each row is a different observer. The solid lines represent the best-fitting bilinear functions obtained with a Marquardt least-squares algorithm in the KaleidaGraph v. 3.08d computer program. Following Ricco’s law, the first limb of the function was constrained to have a slope of −1.0, while the slope and intercept of the other limb of the function were allowed to vary. The intersection of the two limbs of the function (arrow) denotes Ricco’s area, and the value associated with Ricco’s area is specified in each panel. The mean R2 value for the bilinear fits in the S-cone condition was 0.98 (range, 0.951–0.996). A deviation of the second slope from −1.0 indicates partial summation. The mean slope of the second limb of the function was −0.11 ± 0.26 standard deviation, deviating from a slope of −0.5 expected from Piper’s law.
Fig. 3.
Log threshold plotted as a function of log area for the experimental condition that isolated an S-cone mechanism. Each row denotes a different observer; each column depicts a different superior retinal eccentricity. The best-fitting bilinear function is shown in each panel, and the arrow specifies Ricco’s area for that experimental condition.
As shown in Fig. 3, for two of the three observers (ES and VV) the smallest Ricco’s area is obtained at 1.5° superior retinal eccentricity. The relative sizes of Ricco’s area within the central 8° for these two observers is what might be predicted based on the densities of S cones at these various retinal locations. The largest Ricco’s area for all three observers is at 20° retinal eccentricity. If the 20° retinal location is excluded, the largest Ricco’s area for two of the observers (BES and ES) is at 8.0° superior eccentricity, whereas for the third observer (VV) it is at the fovea.
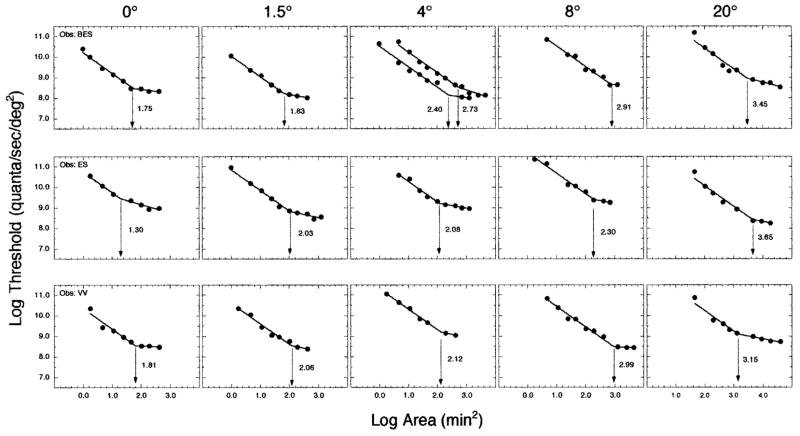
The results for the conditions that isolate an L-cone mechanism are shown in Fig. 4. For BES, at 4° retinal eccentricity, two increment threshold functions were obtained, and the mean of the two determinations of Ricco’s area was used in further analyses. The mean R2 value for the bilinear functions fitted to the L-cone data was 0.98 (range, 0.960–0.996). The mean slope of the second limb of the function was −0.24 ± 0.13 standard deviation. All three observers demonstrated monotonic increases in Ricco’s area with increasing retinal eccentricity.
Fig. 4.
Same as Fig. 3, but for an L-cone mechanism.
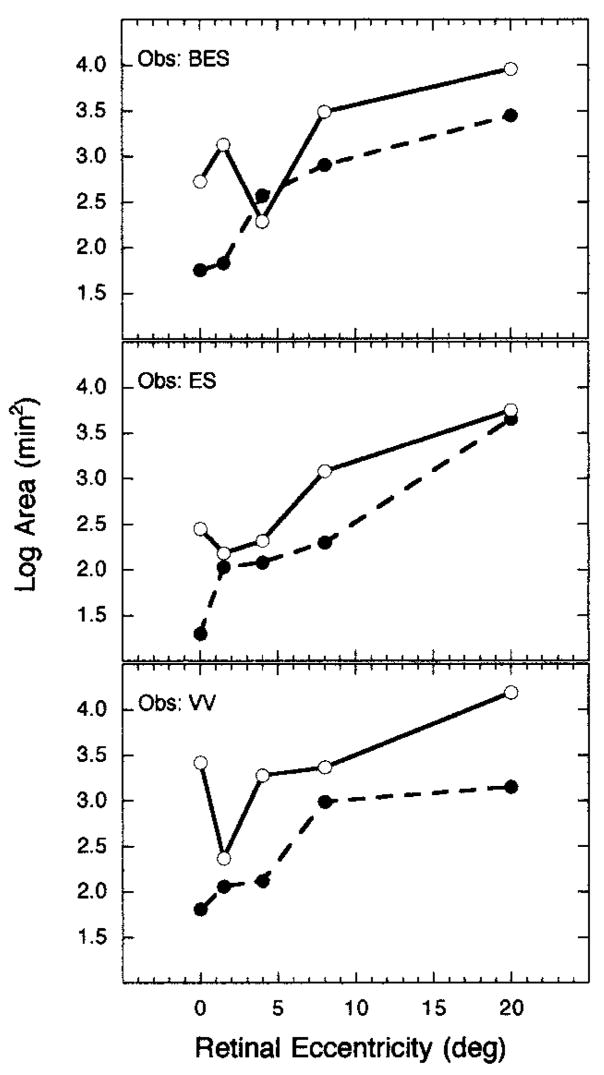
A comparison of the sizes of Ricco’s area obtained for the two cone mechanisms at all tested retinal eccentricities is presented in Fig. 5. Log area is plotted as a function of retinal eccentricity, and each panel denotes a different observer. Open and filled circles represent Ricco’s areas for the S-cone and L-cone mechanisms, respectively. With only one exception, Ricco’s area is smaller for the L-cone mechanism than for the S-cone mechanism at all retinal eccentricities for all three observers. Figure 5 clarifies the relation described above, i.e., that Ricco’s area for an L-cone mechanism increases monotonically with retinal eccentricity. The data associated with an S-cone mechanism are slightly more complex and variable among observers, especially within the central 4°. Differences in the pattern of results measured at the more central eccentricities may reflect variations among observers in the distribution of S cones over this retinal region. Support for this interpretation comes from a study of rhesus monkeys that demonstrated individual variation in the eccentric retinal locus corresponding to the maximal density of S cones.41 All three observers demonstrated monotonic enlargements of Ricco’s area for an S-cone mechanism for retinal eccentricities from 4° to 20°.
Fig. 5.
Log Ricco’s area plotted as a function of superior retinal eccentricity for an S-cone mechanism (open circles) and an L-cone mechanism (filled circles) for three observers.
4. DISCUSSION
The goal of this experiment was to determine whether Ricco’s area is closely correlated with changes in the density of cones, ganglion cells, or both that occur with changes in retinal eccentricity. Fischer5 (see Ref. 6) proposed that Ricco’s area is determined by ganglion cell density, whereas others suggested it is the psychophysical manifestation of dendritic and receptive field size.2–4 DaVila and Geisler7 argued, based on an ideal observer model and empirical data, that under photopic conditions the size of Ricco’s area at the fovea is determined primarily by preneural factors and that neural summation is likely to occur over no more than two cone photoreceptors. The data in this study, in the fovea as well as in the peripheral retina, require substantially greater neural convergence than two photoreceptors to account for Ricco’s area. The same conclusion was reached for measurements of areal summation in the parafovea under scotopic conditions.6 Thus, whereas we evaluate the role of optical factors in altering the estimated area of complete spatial summation, we focus this discussion on neural factors that are more likely to be responsible for Ricco’s area under our conditions.
A. Optical Considerations
The roles of several optical factors that may influence the size of Ricco’s area specified at the retina were considered. We first evaluated, empirically, whether the inherent chromatic aberration of the eye explains the larger Ricco’s area obtained for an S-cone mechanism than an L-cone mechanism. Notably, the dioptric difference between the test and the background wavelengths was greater in the S-cone condition than in the L-cone condition.42,43 The influence of chromatic aberration, however, also depends on the size of the test stimulus, and, because the L-mechanism summation areas are relatively small, the effect may be important in these measurements, too. Therefore foveal areal summation functions were measured with and without an achromatizing lens44 for the Sand L-cone mechanisms. The results showed that the mean thresholds obtained with the achromatizing lens were −0.03 log unit lower for the S-cone mechanism and 0.05 log unit higher for the L-cone mechanism. The shapes of the areal functions were, however, the same with and without the achromatizing lens, and Ricco’s area was the same regardless of lens condition. Thus, in this study, the differences in the size of Ricco’s area between the two cone mechanisms (see Fig. 5) cannot be attributed to chromatic aberration.
Next, we corrected the experimental values of Ricco’s area using optical point-spread functions to specify the stimulus area at the retina. It was assumed for this computation that (1) each observer had optimal refraction for test stimulus wavelengths at all retinal eccentricities, (2) the 1.5-mm diameter of the final Maxwellian image was less than the diameter of the observer’s pupil, and (3) the point-spread function was not wavelength dependent.45,46 Given these assumptions, we corrected the experimental value of the diameter of Ricco’s area at each retinal eccentricity and for each cone mechanism, using Gubisch’s47 foveal point-spread functions for a 2.4-mm pupil. Only those diameters less than 17.5′required a correction. Inasmuch as a pupil size of less than 2.4 mm produces a slightly wider point-spread function, all areas were adjusted to reflect an increase of 0.5′.48 Finally, an additional correction was made for variations in the point-spread function with retinal eccentricity.49,50 A conservative adjustment was made to the optically corrected values: 0.5′was added to the stimulus size at 1.5° retinal eccentricity, 1.0′to stimuli at 4° and 8° retinal eccentricities, and 4.0′to stimuli at 20° retinal eccentricity. All corrections were made based on the half-height of the reported point-spread functions. These optical corrections had a negligible effect on Ricco’s area specified at the retina for the S-cone mechanism because Ricco’s area at all retinal eccentricities is rather large. Corrections for the point-spread function had a small effect on the retinal subtense of Ricco’s areas measured under the L-cone isolating condition. These corrected values are used in the remaining discussion and analyses.
B. Cell Densities and Possible Relations to the Size of Ricco’s Area
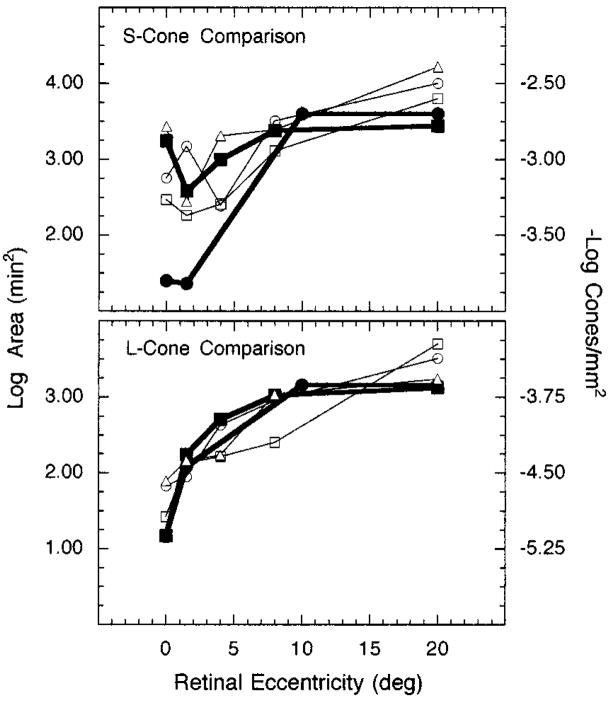
At the bottom of Fig. 6 L-cone Ricco’s areas at the retina are compared for the three observers (open symbols) with estimates of the reciprocal log density of L cones obtained from anatomical studies (filled symbols; see Ref. 51). This comparison suggests that, within the central 8° of the retina, a decrease in L-cone density coincides with a proportional increase in Ricco’s area. This inverse relation, however, breaks down from 8° to 20° retinal eccentricity, where L-cone density remains essentially constant and Ricco’s area becomes larger.
Fig. 6.
Log Ricco’s area at the retina and reciprocal log cone density plotted as a function of retinal eccentricity: Top, Ricco’s areas for an S-cone mechanism compared with S-cone density; bottom, Ricco’s areas for an L-cone mechanism compared with L-cone density. Each set of open symbols denotes a different observer. Filled squares and circles represent density values from Curcio et al.22,23 and Ahnelt et al.21, respectively.
Figure 6, top, shows the relation between S-cone density and complete areal summation for an S-cone mechanism. This complex relation can be explained, at least in part, by psychophysical and anatomical data that reveal a great deal of individual variability in S-cone density, especially along the foveal slope.20,21,23,41 For example, localized peak densities for S cones range from 0.36° to 1.79° retinal eccentricity for individual eyes.23 From 8° to 20°, however, there is more consistency in both the psychophysical and the anatomical data. As with the L-cone comparison, it appears that there is an increase of Ricco’s area for an S-cone mechanism from 8° to 20° retinal eccentricity, whereas over the same retinal expanse the density of S cones remains essentially constant.
If cone density is the sole mediator of complete areal summation, three predictions should be supported by the data. First, Ricco’s areas associated with an S-cone mechanism should be larger than those associated with an L-cone mechanism at each tested retinal locus. With one exception, this is the case, as illustrated in Fig. 5. Second, Ricco’s areas should be smallest at the fovea and at 1.5° retinal eccentricity for the L- and S-cone mechanisms, respectively. This prediction is largely consistent with the data obtained from all three observers. The only exception is that the area of complete spatial summation is smaller at 4° than at 1.5° retinal eccentricity for subject BES (Fig. 5). Once again, the data for this subject may be explained by the fact that the retinal loci tested in this experiment do not coincide with his locus of maximal S-cone density. Third, there should be little change in the size of Ricco’s area from 8° to 20° because S-cone and L-cone densities are relatively unchanged over this region of the retina. As noted, an increase in Ricco’s area occurs for both the S-cone and the L-cone mechanisms over this range of eccentricities. Thus the cone density hypothesis is not supported by data collected at 8° and 20° retinal eccentricities.
In Fig. 7, top, Ricco’s areas associated with an S-cone mechanism (open symbols) are compared with the reciprocal log density of B/Y bistratified ganglion cell densities (filled symbols). This particular ganglion cell type was picked for comparison because our control conditions indicated that an S-cone mechanism was indeed isolated by our experimental conditions and the S-cone signal is known to feed into the S-cone bipolar cell and ultimately the B/Y bistratified ganglion cell.32 There is little evidence to indicate possible S-cone contributions to other types of ganglion cells. In Fig. 7, bottom, areas of complete spatial summation associated with an L-cone mechanism are compared with the reciprocal log density of total number of midget and parasol ganglion cells. These two ganglion cell types were chosen because both receive input into the centers of their receptive fields from L cones. In both panels of the figure, estimates of ganglion cell density at 0° and 1.5° retinal eccentricities were derived from cone density estimates made by Curcio and colleagues22 and from the assumption of one S cone per one B/Y bistratified ganglion cell32 and one L cone per two midget ganglion cells (i.e., one on center and one off center).52 The density values for the parasol ganglion cells were assumed to represent 6% of the total number of ganglion cells at 0° and 1.5°.31 Beyond 1.5° retinal eccentricity, estimates of ganglion cell density were taken from Dacey31 (see Ref. 53).
Fig. 7.
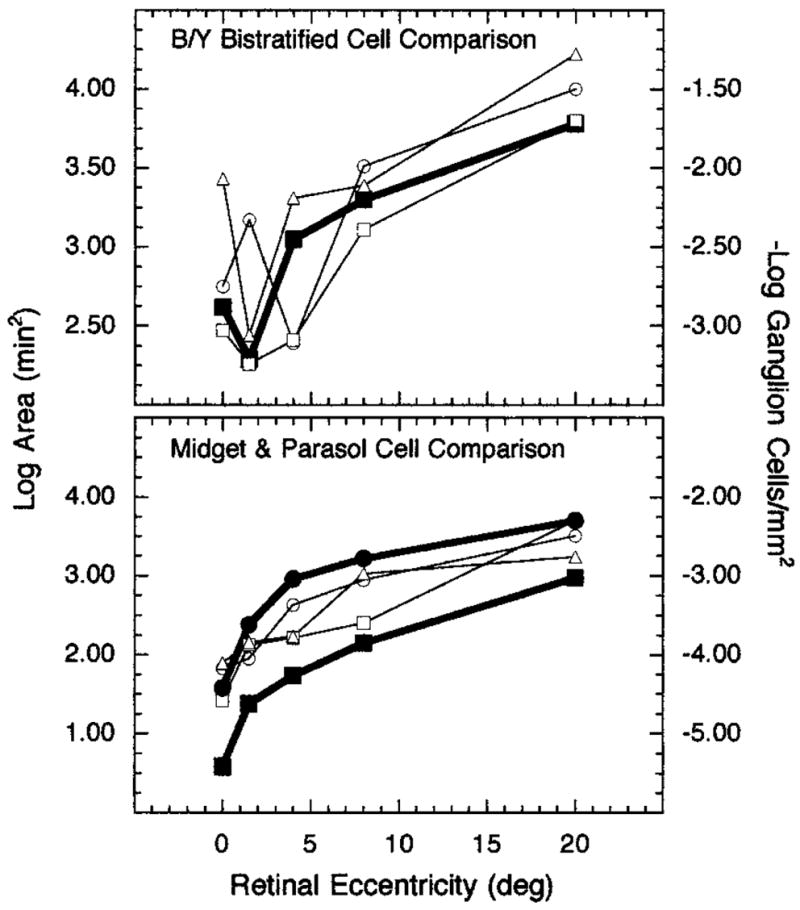
Log Ricco’s area at the retina and reciprocal log ganglion cell density plotted as a function of retinal eccentricity: Top, Ricco’s areas for an S-cone mechanism compared with density of the B/Y bistratified ganglion cells; bottom, Ricco’s areas for an L-cone mechanism compared with density of midget (filled squares) and parasol (filled circles) ganglion cells. Open symbols denote the different observers.
Interestingly, the size of Ricco’s area associated with an L-cone mechanism is directly related to the reciprocal of midget and parasol ganglion cell density from 0° to 20° retinal eccentricity. As Ricco’s area increases with retinal eccentricity, the density of midget and parasol ganglion cells decreases. Unlike the comparison between Ricco’s area and cone density, this relationship extends to 20°. A similar pattern of results is observed for experimental conditions that isolated an S-cone mechanism. From approximately 4° retinal eccentricity and beyond, proportional decreases in the density of bistratified ganglion cells coincide with proportional increases in the sizes of Ricco’s area.
The comparisons made in Figs. 6 and 7 indicate that there is a stronger relation between Ricco’s area and ganglion cell density than between Ricco’s area and receptor density. The data in Fig. 7 do not, however, permit a clear distinction between midget and parasol cells in relation to Ricco’s area for an L-cone mechanism because the cells’ densities change in parallel fashion between the fovea and 20° retinal eccentricity. It should be noted, however, that the conditions of measurement (small and brief test flashes) in our L-cone condition are thought to favor detection by a nonopponent,55 parasol (magnocellular) pathway. By contrast, psychophysical studies have shown that stimuli with long durations are more likely to be detected through a chromatic-opponent pathway,56,57 or midget (parvocellular) system.
Linear regressions of log cell density to log Ricco’s area at the retina also confirm the comparisons in Figs. 6 and 7. As Table 1 illustrates, the linear fits of the sizes of Ricco’s areas for the L-cone mechanism are better for ganglion cell density than for cone density but are not clearly different between the two types of ganglion cells, midget and parasol. Table 2, also, shows that the sizes of Ricco’s area for the S-cone mechanism correlate better with bi-stratified ganglion cell density than with S-cone density. The r2 values across all retinal eccentricities (0°–20°) for the S-cone condition are, however, less than those in Table 1 for the L-cone data. Because of the greater individual variability in the S-cone distribution along the foveal slope,20,21,23,41 the linear fits were recomputed for retinal eccentricities from 4° to 20°. The fits of Ricco’s areas to S-cone and bistratified ganglion cell densities improved, and for two of the three observers the fit was better to bistratified ganglion cell density than to S-cone density.
Table 1.
Linear Regressions of Log Cell Density and Log Ricco’s Area for the L-Cone Mechanisma
| Observer | Cell Type | Slope | Intercept | r2 |
|---|---|---|---|---|
| BES | L cone | −1.03 | 6.84 | 0.76 |
| Midget | −0.76 | 5.77 | 0.92 | |
| Parasol | −0.82 | 5.21 | 0.90 | |
| ES | L cone | −1.13 | 7.06 | 0.66 |
| Midget | −0.90 | 6.17 | 0.92 | |
| Parasol | −0.91 | 5.33 | 0.81 | |
| W | L cone | −0.84 | 5.99 | 0.72 |
| Midget | −0.62 | 5.13 | 0.86 | |
| Parasol | −0.65 | 4.61 | 0.81 |
Table 2.
Linear Regressions of Log Cell Density and Log Ricco’s Area for the S-Cone Mechanisma
| Observer | Cell Type | Eccentricity (°) | Slope | Intercept | r2 |
|---|---|---|---|---|---|
| BES | S cone | 0–20 | −1.62 | 7.93 | 0.20 |
| 4–20 | −6.81 | 22.80 | 0.96 | ||
| Bistratified | 0–20 | −0.65 | 4.77 | 0.36 | |
| 4–20 | −2.05 | 7.65 | 0.85 | ||
| ES | S Cone | 0–20 | −2.85 | 11.19 | 0.61 |
| 4–20 | −5.38 | 18.50 | 0.85 | ||
| Bistratified | 0–20 | −1.01 | 5.33 | 0.83 | |
| 4–20 | −1.84 | 7.02 | 0.96 | ||
| W | S Cone | 0–20 | −3.24 | 12.88 | 0.81 |
| 4–20 | −2.81 | 11.69 | 0.45 | ||
| Bistratified | 0–20 | −0.97 | 5.77 | 0.81 | |
| 4–20 | −1.31 | 6.42 | 0.94 |
S-cone density values are based on data reported by Curcio et al.23
This inverse relation between cell density and the size of Ricco’s area suggests that Ricco’s area increases in size across retinal eccentricity to stimulate a constant number of ganglion cells with increasing retinal eccentricity.5 To evaluate this premise, we computed the number of ganglion cells that underlie Ricco’s areas for each observer at each of the tested retinal eccentricities. The results are presented in Fig. 8. In the top panel the number of B/Y bistratified ganglion cells that underlie Ricco’s areas for the S-cone mechanism are shown; the number of midget and parasol ganglion cells that underlie Ricco’s areas for the L-cone mechanism are shown in the middle and bottom panels, respectively. It should be noted that the scale for the midget ganglion cells is different from that of the B/Y bistratified and parasol ganglion cells. Each type of symbol in the figure denotes a different observer. Except for one retinal eccentricity for each observer, the number of bistratified ganglion cells that underlie Ricco’s areas for each observer at each retinal eccentricity is relatively constant. Likewise, the same pattern is present for the number of parasol ganglion cells that underlie Ricco’s areas for the L-cone mechanism; however, the number of midget ganglion cells that underlie Ricco’s areas for the L-cone mechanism is more variable and shows relatively little consistency across retinal eccentricity. Overall, the data from both the B/Y bistratified ganglion cells and the parasol ganglion cells suggest that similar numbers of cells underlie Ricco’s areas across retinal eccentricity.
Fig. 8.
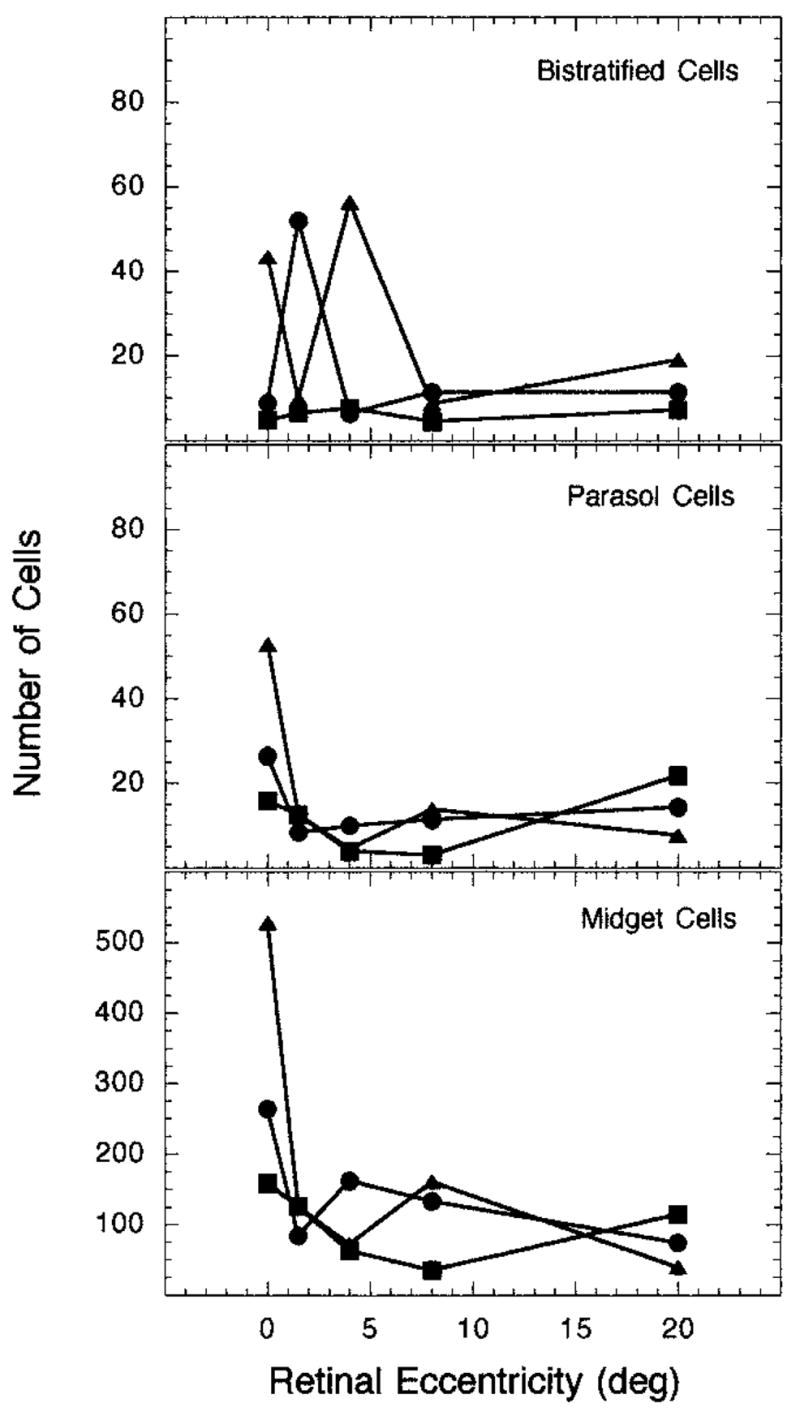
Number of ganglion cells that underlie Ricco’s areas across the retina: Top, number of bistratified ganglion cells that underlie Ricco’s areas for an S-cone mechanism; middle (bottom), number of midget (parasol) ganglion cells that underlie Ricco’s areas for an L-cone mechanism. Each set of symbols represents data from a different observer.
C. Dendritic Field Sizes
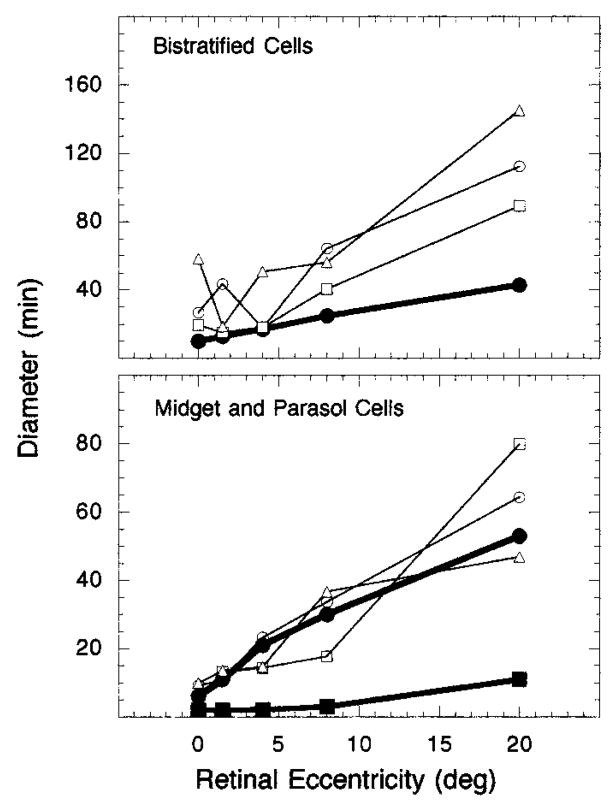
Some research (e.g., Refs. 2, 13, and 15) suggests that Ricco’s area reflects the neural summation of cone signals at or beyond the ganglion cell level. One way to assess this hypothesis is to examine the size of dendritic field centers across retinal eccentricity. The bottom panel of Fig. 9 presents a comparison of the diameter of Ricco’s area at the retina (open symbols) for the L-cone mechanism with the dendritic field size of human midget (filled squares) and parasol (filled circles) ganglion cells as a function of retinal eccentricity. Dendritic field sizes for these cells were estimated from the findings of Dacey and Peterson.58 Likewise, the top panel of Fig. 9 compares the diameter of Ricco’s area at the retina (open symbols) for the S-cone mechanism with the dendritic field size of human B/Y bistratified ganglion cells (filled circles). Dendritic field sizes for these cells were determined from results reported by Dacey.54
Fig. 9.
Diameter of Ricco’s area at the retina and dendritic field size plotted as a function of retinal eccentricity: Top, diameter of Ricco’s areas (open symbols) for an S-cone mechanism compared with dendritic field size of B/Y bistratified ganglion cells (filled circles); bottom, diameter of Ricco’s areas (open symbols) for an L-cone mechanism compared with dendritic field sizes of midget (filled squares) and parasol (filled circles) ganglion cells. Each set of open symbols represents data from a different observer.
As the bottom panel of Fig. 9 demonstrates, the dendritic field size of the midget ganglion cells is much smaller than the diameter of Ricco’s area for the L-cone mechanism, and it shows little, if any, change from 0° to 8° retinal eccentricity. However, the diameter of the dendritic field of the parasol ganglion cells follows a scale similar to that of Ricco’s area for an L-cone mechanism. Furthermore, there appears to be a greater one-to-one correspondence between the diameter of Ricco’s area and the diameter of the parasol dendritic field size than with the diameter of midget ganglion cells. This analysis suggests that under our experimental conditions Ricco’s area for an L-cone mechanism is mediated by the parasol system. It also suggests that, as neural convergence increases, the size of Ricco’s area also increases for the L-cone mechanism.
The top panel of Fig. 9 illustrates that the diameter of the B/Y bistratified ganglion cells is, in general, smaller than the diameter of Ricco’s area, particularly at 8° and 20° retinal eccentricity. The dendritic field size of these cells continues to increase in a monotonic fashion with retinal eccentricity and, unlike S-cone and ganglion cell density, does not show a deviation from this monotonic function in the area of peak density. It is difficult to conclude whether Ricco’s area for the S-cone mechanism is directly related to dendritic field size. Whereas neural convergence is increasing with retinal eccentricity, it is not obvious what form the relation between neural convergence and the size of Ricco’s area for an S-cone mechanism is.
5. CONCLUSIONS
Ricco’s area was measured under conditions chosen to isolate S-cone and L-cone mechanisms. Areas of complete spatial summation were larger for the S-cone than for the L-cone mechanism along the vertical meridian up to 20° retinal eccentricity in the superior retina. For the S-cone mechanism, the retinal locus associated with the smallest area of complete spatial summation varied across observers; however, all observers demonstrated monotonic increases of Ricco’s area at and beyond 4° retinal eccentricity. In contrast, the data for the L-cone mechanism were more orderly, indicating that Ricco’s area increased monotonically with increasing retinal eccentricity. Our analysis of the data suggests that the sizes of Ricco’s area for both cone mechanisms are more likely mediated by ganglion cell density. This interpretation is supported by the earlier study of Schefrin et al.6 that measured the size of Ricco’s area under scotopic conditions. It is also perhaps the case that Ricco’s area for the L-cone mechanism represents the increase in neural convergence with increasing retinal eccentricity.
Acknowledgments
National Science Foundation grant IBN-9603613 (to V. J. Volbrecht) and National Institutes of Health grant NIA AG04058 (to J. S. Werner) supported this study. We thank David Calkins for his helpful comments.
REFERENCES AND NOTES
- 1.Ricco A. Relazione fra il minimo angolo visuale l’intensita luminosa. Mem R Accad Sci Lett Arti Modena. 1877;17:47–160. [Google Scholar]
- 2.Wilson ME. Invariant features of spatial summation with changing locus in the visual field. J Physiol (London) 1970;207:611–622. doi: 10.1113/jphysiol.1970.sp009083. [DOI] [PMC free article] [PubMed] [Google Scholar]
- 3.Lie I. Visual detection and resolution as a function of retina locus. Vision Res. 1980;20:967–974. doi: 10.1016/0042-6989(80)90079-6. [DOI] [PubMed] [Google Scholar]
- 4.Spillmann L, Ransom-Hogg A, Oehler R. A comparison of perceptive and receptive fields in man and monkey. Human Neurobiol. 1987;6:51–62. [PubMed] [Google Scholar]
- 5.Fischer B. Overlap of receptive field centers and representation of the visual field in the cat’s optic tract. Vision Res. 1973;13:2113–2120. doi: 10.1016/0042-6989(73)90188-0. [DOI] [PubMed] [Google Scholar]
- 6.Schefrin BE, Bieber ML, McLean R, Werner JS. The area of complete scotopic spatial summation enlarges with age. J Opt Soc Am A. 1998;15:340–348. doi: 10.1364/josaa.15.000340. [DOI] [PubMed] [Google Scholar]
- 7.DaVila KD, Geisler WS. The relative contributions of pre-neural and neural factors to areal summation in the fovea. Vision Res. 1991;31:1369–1380. doi: 10.1016/0042-6989(91)90058-d. [DOI] [PubMed] [Google Scholar]
- 8.Wald G. Area and visual threshold. J Gen Physiol. 1938;21:269–287. doi: 10.1085/jgp.21.3.269. [DOI] [PMC free article] [PubMed] [Google Scholar]
- 9.Graham CH, Brown RH, Mote FA. The relation of size of stimulus and intensity in the human eye. I. Intensity thresholds for white light. J Exp Psychol. 1939;24:555–573. [Google Scholar]
- 10.Barlow HB. Temporal and spatial summation in human vision at different background intensities. J Physiol (London) 1958;141:337–350. doi: 10.1113/jphysiol.1958.sp005978. [DOI] [PMC free article] [PubMed] [Google Scholar]
- 11.Baumgardt E, Hillmann B. Duration and size as determinants of peripheral retinal response. J Opt Soc Am. 1961;51:340–344. doi: 10.1364/josa.51.000340. [DOI] [PubMed] [Google Scholar]
- 12.Hallett PE, Marriott FHC, Rodger FC. The relationship of visual threshold to retinal position and area. J Physiol (London) 1962;160:364–373. doi: 10.1113/jphysiol.1962.sp006851. [DOI] [PMC free article] [PubMed] [Google Scholar]
- 13.Glezer VD. The receptive fields of the retina. Vision Res. 1965;5:497–525. doi: 10.1016/0042-6989(65)90084-2. [DOI] [PubMed] [Google Scholar]
- 14.Scholtes AMW, Bouman MA. Psychophysical experiments on spatial summation at threshold level of the human peripheral retina. Vision Res. 1977;17:867–873. doi: 10.1016/0042-6989(77)90131-6. [DOI] [PubMed] [Google Scholar]
- 15.Brindley GS. The summation areas of human colour-receptive mechanisms at increment threshold. J Physiol (London) 1954;124:400–408. doi: 10.1113/jphysiol.1954.sp005116. [DOI] [PMC free article] [PubMed] [Google Scholar]
- 16.Dannheim F, Drance SM. Studies of spatial summation of central retinal areas in normal people of all ages. Can J Ophthalmol. 1971;6:311–319. [PubMed] [Google Scholar]
- 17.Inui T, Mimura O, Kani K. Retinal sensitivity and spatial summation in the foveal and parafoveal regions. J Opt Soc Am. 1981;71:151–154. doi: 10.1364/josa.71.000151. [DOI] [PubMed] [Google Scholar]
- 18.Johnson MA. Color vision in the peripheral retina. Am J Optom Physiol Opt. 1986;63:97–103. doi: 10.1097/00006324-198602000-00003. [DOI] [PubMed] [Google Scholar]
- 19.Sakitt B. Configuration dependence of scotopic spatial summation. J Physiol (London) 1971;216:513–529. doi: 10.1113/jphysiol.1971.sp009538. [DOI] [PMC free article] [PubMed] [Google Scholar]
- 20.Williams DR, MacLeod DIA, Hayhoe MM. Punctate sensitivity of the blue-sensitive mechanism. Vision Res. 1981;21:1357–1375. doi: 10.1016/0042-6989(81)90242-x. [DOI] [PubMed] [Google Scholar]
- 21.Ahnelt PK, Kolb H, Pflug R. Identification of a subtype of cone photoreceptor, likely to be blue sensitive, in the human retina. J Comp Neurol. 1987;255:18–34. doi: 10.1002/cne.902550103. [DOI] [PubMed] [Google Scholar]
- 22.Curcio CA, Sloan KR, Kalina RE, Hendrickson AE. Human photoreceptor topography. J Comp Neurol. 1990;292:497–523. doi: 10.1002/cne.902920402. [DOI] [PubMed] [Google Scholar]
- 23.Curcio CA, Allen KA, Sloan KR, Lerea CL, Hurley JB, Klock IB, Milam AH. Distribution and morphology of human cone photoreceptors stained with anti-blue opsin. J Comp Neurol. 1991;312:610–624. doi: 10.1002/cne.903120411. [DOI] [PubMed] [Google Scholar]
- 24.Cicerone CM, Nerger JL. The relative numbers of long-wavelength-sensitive to middle-wavelength-sensitive cones in the human fovea centralis. Vision Res. 1989;29:115–128. doi: 10.1016/0042-6989(89)90178-8. [DOI] [PubMed] [Google Scholar]
- 25.Nerger JL, Cicerone CM. The ratio of L cones to M cones in the human parafoveal retina. Vision Res. 1992;32:879–888. doi: 10.1016/0042-6989(92)90030-m. [DOI] [PubMed] [Google Scholar]
- 26.Vimal RLP, Pokorny J, Smith VC, Shevell SK. Foveal cone thresholds. Vision Res. 1989;29:61–78. doi: 10.1016/0042-6989(89)90174-0. [DOI] [PubMed] [Google Scholar]
- 27.Hagstrom SA, Neitz J, Neitz M. Variations in cone populations for red–green color vision examined by analysis of mRNA. NeuroReport. 1998;9:1963–1967. doi: 10.1097/00001756-199806220-00009. [DOI] [PubMed] [Google Scholar]
- 28.Roorda A, Williams DR. The arrangement of the three cone classes in the living human eye. Nature. 1999;397:520–522. doi: 10.1038/17383. [DOI] [PubMed] [Google Scholar]
- 29.The term B/Y bistratified ganglion cell is used throughout the paper because it is convenient in anatomy. This nomenclature does not imply that these ganglion cells are responsible for the perception of blue and yellow hues.
- 30.Dacey DM, Lee BB. The ‘blue-on’ opponent pathway in primate retina originates from a distinct bistratified ganglion cell type. Nature. 1994;367:731–735. doi: 10.1038/367731a0. [DOI] [PubMed] [Google Scholar]
- 31.Dacey DM. Physiology, morphology and spatial densities of identified ganglion cells types in primate retina. In: Bock GR, Goode JA, editors. Higher-Order Processing in the Visual System. Wiley; New York: 1994. pp. 12–34. [DOI] [PubMed] [Google Scholar]
- 32.Calkins DJ, Tsukamoto Y, Sterling P. Microcircuitry and mosaic of a blue–yellow ganglion cell in the primate retina. J Neurosci. 1998;18:3373–3385. doi: 10.1523/JNEUROSCI.18-09-03373.1998. [DOI] [PMC free article] [PubMed] [Google Scholar]
- 33.Wässle H, Grünert U, Röhrenbeck J, Boycott BB. Cortical magnification factor and the ganglion cell density of the primate retina. Nature. 1989;341:643–646. doi: 10.1038/341643a0. [DOI] [PubMed] [Google Scholar]
- 34.Curcio CA, Allen KA. Topography of ganglion cells in human retina. J Comp Neurol. 1990;300:5–25. doi: 10.1002/cne.903000103. [DOI] [PubMed] [Google Scholar]
- 35.Calkins DJ, Sterling P. Evidence that circuits for spatial and color vision segregate at the first retinal synapse. Neuron. 1999;24:313–321. doi: 10.1016/s0896-6273(00)80846-6. [DOI] [PubMed] [Google Scholar]
- 36.Bieber ML, Schefrin BE, Werner JS. The senescence of cone photoreceptor sensitivity at 0°, 4°, and 8° retinal eccentricity and the possible relation to macular pigment density. Invest Ophthalmol Visual Sci Suppl. 1998;39:S163. [Google Scholar]
- 37.DeMarco P, Pokorny J, Smith VC. Full-spectrum cone sensitivity functions for X-chromosome-linked anomalous trichromats. J Opt Soc Am A. 1992;9:1465–1476. doi: 10.1364/josaa.9.001465. [DOI] [PubMed] [Google Scholar]
- 38.T.v.i. functions were also measured at 4°, 8°, and 20° retinal eccentricities. The peripheral functions confirmed that the thresholds measured at the selected background intensity were on the plateau of the t.v.i. function. Test sensitivity functions were also measured at 20° retinal eccentricity under conditions that isolated the S-cone and L-cone mechanisms. As in the fovea, the 20° test sensitivity functions verified the isolation of S- and L-cone mechanisms.
- 39.Westheimer G. The Maxwellian view. Vision Res. 1966;6:669–682. doi: 10.1016/0042-6989(66)90078-2. [DOI] [PubMed] [Google Scholar]
- 40.Levitt H. Transformed up–down methods in psychoacoustics. J Acoust Soc Am. 1970;49:467–477. [PubMed] [Google Scholar]
- 41.de Monasterio FM, McCrane EP, Newlander JK, Schein SJ. Density profile of blue-sensitive cones along the horizontal meridian of macaque retina. Invest Ophthalmol. 1985;26:289–302. [PubMed] [Google Scholar]
- 42.Bedford RE, Wyszecki G. Axial chromatic aberration of the human eye. J Opt Soc Am. 1957;47:564–565. doi: 10.1364/josa.47.0564_1. [DOI] [PubMed] [Google Scholar]
- 43.Howarth PA, Bradley A. The longitudinal chromatic aberration of the human eye, and its correction. Vision Res. 1986;26:361–366. doi: 10.1016/0042-6989(86)90034-9. [DOI] [PubMed] [Google Scholar]
- 44.Powell I. Lenses for correcting chromatic aberration of the eye. Appl Opt. 1981;20:4152–4155. doi: 10.1364/AO.20.004152. [DOI] [PubMed] [Google Scholar]
- 45.Krauskopf J. Further measurements of human retinal images. J Opt Soc Am. 1964;54:715–716. [Google Scholar]
- 46.Charman WN, Jennings JAM. The optical quality of the monochromatic retinal image as a function of focus. Br J Physiol Opt. 1976;31:119–134. [PubMed] [Google Scholar]
- 47.Gubisch RW. Optical performance of the human eye. J Opt Soc Am. 1967;57:407–415. [Google Scholar]
- 48.Campbell FW, Gubisch RW. Optical quality of the human eye. J Physiol (London) 1966;186:558–578. doi: 10.1113/jphysiol.1966.sp008056. [DOI] [PMC free article] [PubMed] [Google Scholar]
- 49.Jennings JAM, Charman WN. Optical image quality in the peripheral retina. Am J Optom Physiol Opt. 1978;55:582–590. doi: 10.1097/00006324-197808000-00008. [DOI] [PubMed] [Google Scholar]
- 50.Navarro R, Artal P, Williams DR. Modulation transfer of the human eye as a function of retinal eccentricity. J Opt Soc Am A. 1993;10:201–212. doi: 10.1364/josaa.10.000201. [DOI] [PubMed] [Google Scholar]
- 51.Ahnelt and colleagues (Ref. 21) did not provide an estimate of cone density at 4° and 8° retinal eccentricities. The 10° estimate for S and L cones has been included to show that the density of cones does not change from 10° to 20° retinal eccentricity. Although Curcio et al.23 did not extend their S-cone measurements beyond 8°, in an earlier paper Curcio et al.22 showed that total cone density remained relatively constant from 8° and beyond. Based on this finding, the 20° values were assumed to be the same as the density values at 8° retinal eccentricity. The mean cone density values across retinal quadrants from Curcio et al.22, 23 were used in Fig. 6. Ahnelt et al.21 investigated only the temporal quadrant. The numbers of L cones from both studies were derived with the assumption of an L:M cone ratio of 2:1.24,25 If other estimates (e.g., Refs. 26–28) of the L:M cone ratio had been used, the L-cone density function would have shifted only along the y axis. This scalar shift would not affect the analyses presented in Fig. 6 and Table 1.
- 52.Lee BB. Receptive field structure in the primate retina. Vision Res. 1996;36:631–644. doi: 10.1016/0042-6989(95)00167-0. [DOI] [PubMed] [Google Scholar]
- 53.Retinal eccentricity values were obtained for ganglion cell density values within 8° of the fovea by use of the correction factor for ganglion cell displacement.54 The ganglion cell density values represent mean values across retinal quadrants. The 0° and 1.5° midget ganglion cell density values were derived from L-cone density values with the assumption of a 2:1 L:M cone ratio. If a different L:M ratio were used, the conclusions drawn from Fig. 7 would not change.
- 54.Dacey DM. Morphology of a small-field bistratified ganglion cells type in the macaque and human retina. Visual Neurosci. 1993;10:1081–1098. doi: 10.1017/s0952523800010191. [DOI] [PubMed] [Google Scholar]
- 55.Wandell BA, Pugh EN., Jr A field-additive pathway detects brief-duration, long-wavelength incremental flashes. Vision Res. 1980;20:613–624. doi: 10.1016/0042-6989(80)90118-2. [DOI] [PubMed] [Google Scholar]
- 56.King-Smith PE, Carden D. Luminance and opponent-color contributions to visual detection and adaptation and to temporal and spatial integration. J Opt Soc Am. 1976;66:709–717. doi: 10.1364/josa.66.000709. [DOI] [PubMed] [Google Scholar]
- 57.Wandell BA, Pugh EN., Jr Detection of long-duration, long wavelength incremental flashes by a chromatically coded pathway. Vision Res. 1980;20:625–636. doi: 10.1016/0042-6989(80)90119-4. [DOI] [PubMed] [Google Scholar]
- 58.Dacey DM, Petersen MR. Dendritic field size and morphology of midget and parasol ganglion cells of the human retina. Proc Natl Acad Sci USA. 1992;89:9666–9670. doi: 10.1073/pnas.89.20.9666. [DOI] [PMC free article] [PubMed] [Google Scholar]


