

Abstract
Infection of inbred mice with murine gammaherpesvirus 68 (MHV68) has proven to be a powerful tool to study gammaherpesvirus pathogenesis. However, one of the limitations of this system has been the inability to directly detect infected cells harvested from infected animals. To address this issue, we generated a transgenic virus that expresses the enhanced yellow fluorescent protein (YFP), driven by the human cytomegalovirus immediate-early promoter and enhancer, from a neutral locus within the viral genome. This virus, MHV68-YFP, replicated and established latency as efficiently as did the wild-type virus. During the early phase of viral latency, MHV68-YFP efficiently marked latently infected cells in the spleen after intranasal inoculation. Staining splenocytes for expression of various surface markers demonstrated the presence of MHV68 in distinct populations of splenic B cells harboring MHV68. Notably, these analyses also revealed that markers used to discriminate between newly formed, follicular and marginal zone B cells may not be reliable for phenotyping B cells harboring MHV68 since virus infection appears to modulate cell surface expression levels of CD21 and CD23. However, as expected, we observed that the overwhelming majority of latently infected B cells at the peak of latency exhibited a germinal center phenotype. These analyses also demonstrated that a significant percentage of MHV68-infected splenocytes at the peak of viral latency are plasma cells (ca. 15% at day 14 and ca. 8% at day 18). Notably, the frequency of virus-infected plasma cells correlated well with the frequency of splenocytes that spontaneously reactivate virus upon explant. Finally, we observed that the efficiency of marking latently infected B cells with the MHV68-YFP recombinant virus declined at later times postinfection, likely due to shut down of transgene expression, and indicating that the utility of this marking strategy is currently limited to the early stages of virus infection.
Gammaherpesviruses are characterized by their ability to establish life-long infection in lymphocytes of their host as well as their oncogenic potential. The human gammaherpesviruses, Epstein-Barr virus (EBV) and human herpesvirus 8 (HHV-8; also known as Kaposi's sarcoma-associated herpesvirus [KSHV]), are associated with a variety of neoplasms. EBV has been implicated in Burkitt's lymphoma, nasopharyngeal carcinoma, and non-Hodgkin's lymphoma (15, 27, 33). HHV-8 has been associated with Kaposi's sarcoma, primary effusion lymphoma, and multicentric Castleman's disease (4, 5, 7, 24).
Research on the human gammaherpesvirus is hindered by their strict species specificity, and thus has been limited mostly to in vitro analyses. Murine gammaherpesvirus 68 (MHV68) is a closely related gammaherpesvirus that naturally infects rodents and provides a useful small animal model to study aspects of gammaherpesvirus pathogenesis that cannot be addressed for the human herpesviruses (3, 22, 25). In addition, the viral genome has been cloned as a bacterial artificial chromosome (BAC) and can readily be manipulated in Escherichia coli (1) and, coupled with the availability of numerous transgenic and knockout strains of mice, MHV68 infection of laboratory mice has provided a powerful small animal model for characterizing basic aspects of gammaherpesvirus pathogenesis in vivo.
Like the human gammaherpesviruses, MHV68 establishes long-term latency in B cells, although at early time points after infection latency can also be detected in macrophages and dendritic cells (11, 26, 30). Acute infection is cleared around 2 to 3 weeks postinfection, and by days 16 to 18 postinfection the frequency of viral genome-positive cells in the spleen is ca. 1 in 100 splenocytes (19, 31). This is the peak of splenic latency, and the frequency of infected cells begins to decline significantly until it reaches a steady-state level of ca. 1 in 10,000 splenocytes by 3 months postinfection. Previous analyses have shown that latency is mainly established in germinal center (GC) and memory B cells (12, 19, 31). At early time points during the establishment of latency, the GC fraction has been shown to have the highest percentage of infected cells (ca. 60 to 80% of MHV68-infected B cells) (12). However, even in this population, only around 10% of total GC cells are infected (12). This low frequency limits detailed molecular analyses that can be performed on infected cells (e.g., analysis of virus-induced changes in cellular gene expression).
Until now, there has not been an efficient way to directly detect or purify/enrich for MHV68-infected cells harvested from the spleens of infected mice. Because of these issues, we sought to develop a method to efficiently mark infected cells that would allow easy detection, as well as isolation, of infected cells. To this end, we created a transgenic virus that expresses the enhanced yellow fluorescent protein (YFP) from a neutral locus in the viral genome located between open reading frames (ORFs) 27 and 29b. We have previously used this locus to introduce other transgenes (Cre-recombinase and IκBαM expression cassettes) and have shown that this locus tolerates the insertion of transgene expression cassettes (14, 20). We show here that the MHV68-YFP recombinant virus is capable of efficiently marking infected cells, that highly enriched populations of infected cells can easily be isolated based of YFP expression, and that direct detection of infected cells provides a powerful tool for phenotypic analysis of infected cell populations.
MATERIALS AND METHODS
Cell lines and viruses.
All infections utilizing wild-type virus (not BAC derived) were performed with MHV68 strain WUMS (ATCC VR-1465). Virus propagation, maintenance, and titer determination were performed as previously described (8). NIH3T12 cells, murine embryonic fibroblasts (MEFs) and Vero cre cells were maintained in Dulbecco modification of Eagle medium (DMEM) supplemented with 10% fetal bovine serum, 2 mM l-glutamine, 100 U of penicillin per ml, and 100 mg of streptomycin per ml.
Mice, infections, and organ harvests.
Female C57BL/6J mice were purchased from Jackson Laboratory (Bar Harbor, ME) at 6 to 8 weeks of age and were infected at 8 to 12 weeks. All protocols used for animal studies were approved by the Institutional Animal Care and Use Committee of Emory University. Prior to infection, mice were anesthetized with isofluorane and inoculated intranasally with 1,000 PFU of virus that was resuspended in 20 μl of DMEM. Spleens were harvested 16 to 18 days postinfection, homogenized, and filtered through 100-μm-pore-size pore nylon cell strainers (Becton Dickinson, Franklin Lakes, NJ). Red blood cells were removed with red blood cell lysis buffer (Sigma, St. Louis, MO). Lungs were harvested at days 4 and 9 postinfection and frozen in complete DMEM at −80°C until ready for use.
Construction of viruses.
To create a YFP-expressing virus, an expression cassette consisting of the human cytomegalovirus (HCMV) immediate-early (IE) promoter, the YFP ORF, and the bovine growth hormone polyadenylation signal was cloned into the vector pCR-Blunt (Invitrogen, La Jolla, CA). The CMV promoter was PCR amplified from pCMV-Script (Stratagene, La Jolla, CA) using the primers CMV_pro_5_SacI (5′-GGGAGCTCATGCATTAGTTATTAATAGTAATC-3′) and CMV_pro_3_SpeI (5′-GGACTAGTGCTAGCGGATCTGACGGTT-3′) and cloned into the SacI and SpeI sites of pCR-Blunt to create pCR-Blunt CMV. The YFP ORF and bovine growth hormone polyadenylation signal were PCR amplified from pIRES-EYFP (Clontech) using the primers YFP_5_EcoRV (5′-GGGATATCATGGTGAGCAAGGGCGA-3′) and YFP_3_NotI (5′-GGGCGGCCGCCCCCAGCTGGTTCT-3′) and cloned into the EcoRV and NotI site of pCR-Blunt CMV to create pCR-Blunt CMV YFP. The expression cassette was then flanked with 747-bp chromatin insulator elements from the human major histocompatibility complex II locus termed XL9CD (18). The insulator element upstream of the expression cassette was cloned into the MluI and HindIII sites using the primers 747_5S_MluI (5′-GGACGCGTTGCTTCCTTTCAGTGTCCAAGTG-3′) and 747_3S_HindIII (5′-GGAAGCTTGGCCAGCCACACAGAGTTA-3′). The downstream insulator element was cloned into the XhoI and XbaI sites using the primers 747_5_XhoI (5′-GGCTCGAGTGCTTCCTTTCAGTGTCCAAGTG-3′) and 747_3_XbaI (5′-GGTCTAGAGGCCAGCCACACAGAGTTA-3′) to create pCR-Blunt-Ins-CMV YFP. The MluI-XbaI fragment containing the YFP expression cassette flanked by the insulators was isolated, treated with Klenow to blunt the ends, and cloned into the PmlI site of the vector JE110. This vector contains the region of the MHV68 genome between nucleotides 45237 and 48347 and the PmlI site is at nucleotide 46347, between ORFs 27 and 29b. Clones with the expression cassette in each orientation relative the viral genomic sequence were isolated to and termed JE110-XL9CD CMV-YFP-F and JE110-XL9CD CMV-YFP-R. The ApaI fragment from these vectors was then cloned into the ApaI site of pGS284-BluntMCS, a modified version of the suicide vector pGS284 (23) in which the SacI-SmaI fragment has been replaced with the SacI-SnaBI fragment of pCR-Blunt. The resulting vectors, pGS284-XL9CD-CMV-YFP-F and pGS284-XL9CD-CMV-YFP-R, were used for allelic exchange with wild-type MHV68 BAC in GS500, a RecA+ strain of Escherichia coli.
To excise the BAC sequence during propagation of transgenic viruses, Vero cre cells were transfected with recombinant BACs to remove the BAC sequence by cre-lox recombination. To ensure complete removal of the BAC sequence, the resulting virus was passaged once more in Vero cre cells before propagation in NIH3T12 cells.
Limiting-dilution PCR analysis.
To determine the frequency of genome-positive cells, limiting-dilution PCR analysis with single copy sensitivity was performed as previously described (29, 30). Briefly, splenocytes were plated in a series of three threefold dilutions in 96-well plates. There were six dilutions per sample, and twelve replicates were plated for each dilution. Cells were plated in a background of 104 uninfected NIH3T12 cells. Cells were lysed with proteinase K at 56°C for 6 h, followed by heat inactivation at 95°C for 20 min. Round 1 and round 2 PCRs were performed as previously described in a PrimusHT thermal cycle (MWG Biotech, High Point, NC). Each 96-well plate included copy controls consisting of uninfected NIH3T12 cells with plasmid DNA (pBamHIN, which contains the region of the viral genome being amplified) corresponding to 10, 1, and 0.1 copies of plasmid DNA spike in. Reactions were resolved on a 2% agarose gel. All assays had nearly single copy sensitivity with no false positives.
Limiting-dilution ex vivo reactivation.
To determine the frequency of cells capable of reactivating virus, limiting-dilution analysis was performed as previously described (28, 29). Splenocytes were resuspended in complete DMEM and plated in serial twofold dilutions onto indicator MEF monolayers. There were 24 replicate wells per dilution, and 105 splenocytes were plated out at the highest dilution. Wells were scored for cytopathic effect 14 days after plating. Parallel samples were mechanically disrupted prior to plating to detect the presence of any preformed infectious virus.
Plaque assays.
NIH2T12 cells were plated out at 2 × 10⁵ cells per well in six-well plates the day prior to infection. Lungs were mechanically disrupted with 1.0-mm zirconia/silica beads (Biospec Products, Bartlesville, OK) in a Mini-Beadbeater 8 (Biospec Products). Disruption consisted of four cycles that were 1 min in duration each. The resulting homogenate was then used to make serial 10-fold dilutions that were plated onto the NIH3T12 cells. The cells were incubated for 1 h at 37°C. After incubation, cells were overlays with 2% methylcellulose in complete DMEM. On day 6 to 7 postinfection, the plates were overlaid with neutral red, and plaques were counted the following day. The limit of detection for this assay is 50 PFU per organ.
Flow cytometry.
Single-cell suspensions of splenocytes were resuspended in phosphate-buffered saline containing 1% fetal bovine serum and stained in the dark on ice for 20 min. Antibodies used for these studies were phycoerythrin-conjugated anti-CD138 and anti-CD23 (BD Pharmingen, San Diego, CA), allophycocyanin-conjugated anti-B220 (BD Pharmingen), Pacific Blue-conjugated anti-B220 (Caltag Laboratories), and anti-CD21 (eBiosciences, San Diego, CA), PE-Cy7-conjugated anti-CD95 (BD Pharmingen), allophycocyanin-Cy7 conjugated anti-CD19 (BD Pharmingen), and biotin-conjugated anti-GL7 (eBiosciences). Allophycocyanin-conjugated streptavidin (eBiosciences) was used to detect bound anti-GL7. Most antibodies were used at a dilution of 1:100 with the exception of phycoerythrin-conjugated antibodies, which were used at 1:200, and anti-GL7, which was used at a 1:1,000 dilution. Allophycocyanin-conjugated streptavidin used to detect anti-GL7 was also used at 1:1,000. The data were acquired on an LSRII flow cytometer (BD Biosciences) and analyzed using FloJo software (Treestar, Inc., San Carlos, CA).
For fluorescence-activated cell sorting analysis, splenocytes were resuspended in phosphate-buffered saline containing 1% fetal bovine serum at a concentration of 1 × 10⁸ cells per ml. Cells were sorted on a FACSAria (BD Biosciences). Sorted populations were either immediately plated out for limiting-dilution reactivation assays (described above) or resuspended in complete DMEM supplemented with 10% dimethyl sulfoxide and stored at −80°C for LD-PCR analysis.
Statistical analyses.
All data analysis was performed using GraphPad Prism software (GraphPad Software, San Diego, CA). Lung titers were analyzed using the nonparametric Mann-Whitney test. To determine the frequency of genome-positive cells and frequency of cells capable of reactivating virus, data were subjected to nonlinear regression analysis. Frequencies were obtained from nonlinear regression fit of the data where the regression line intersected 63.2%, which corresponds to the frequency at which one event is present in a population.
RESULTS AND DISCUSSION
Generation of YFP-expressing MHV68.
To create a transgenic virus that efficiently marks cells, an YFP expression cassette was cloned into the intergenic region between open reading frames 27 and 29b (Fig. 1A). This region has been used previously to express transgenes from the viral genome without any noticeable impact on the ability of the virus to replicate or establish latency (20). Expression of YFP was driven by the HCMV IE promoter and enhancer. In an attempt to prolong expression of YFP after the onset of latency, the expression cassette was flanked by a chromatin insulator from the human major histocompatibility complex II locus (18). Transgenic viruses in which the YFP expression cassette was cloned in either the forward or reverse orientation with respect to the viral genome were isolated, and the presence of the expression cassette, and its correct insertion into the viral genome was confirmed by PCR analysis with primers specific for the cassette, as well as by Southern blotting (data not shown).
FIG. 1.

Generation of YFP-expressing MHV68. (A) A YFP expression cassette was cloned into the PmlI site in the intergenic region between ORFs 27 and 29b. The expression cassette was flanked by chromatin insulators (XL9CD) as described in Materials and Methods. Independent isolates with the cassette cloned in each orientation were isolated. P, PmlI; M, MluI; H, HindIII; E, EcoRV; N, NotI; Xb, XbaI; Xh, XhoI. (B) Representative flow plots are shown for splenocytes harvested from mice infected intranasally with 1,000 PFU of the indicated virus. Splenocytes were harvested at days 16 to 18 postinfection, and YFP expression was determined by flow cytometry. (C) Percentage of total splenocytes that were YFP positive. The results are from multiple experiments with three to five mice per group using three independent isolates of MHV68-YFP.
To determine whether MHV68-YFP could efficiently mark cells in vivo, C57BL/6 mice were infected intranasally with 1,000 PFU of either wild-type virus or MHV68-YFP, and splenocytes were harvested at days 16 to 18 postinfection. Representative flow plots from multiple experiments using three independent isolates of MHV68-YFP are shown in Fig. 1B. Two of the isolates had the YFP expression cassette cloned in the reverse orientation with respect to the orientation of ORF27, and the other isolate had the cassette cloned in the same orientation as ORF27 (forward orientation). Notably, orientation of the expression cassette had no impact on the phenotype of the YFP-expressing viruses (data not shown). Analysis of splenocytes from mice infected with MHV68-YFP showed that a significant number of splenocytes expressed detectable levels YFP (Fig. 1B). Because of the presence of background fluorescence using splenocytes harvested from mice infected with wild-type virus, the YFP gates were drawn conservatively to eliminate these cells. Because of this, the number of YFP-positive cells very likely reflects an underestimate of virus infected cells. Indeed, there are clearly more cells in the area between the major population of YFP-negative cells and the YFP gate in mice infected with MHV68-YFP compared to splenocytes from mice infected with wild-type virus (Fig. 1B).
Some variation was observed in the frequency of YFP-positive splenocytes, ranging from 0.03 to 1.18% with a mean of 0.47% (Fig. 1C). However, overall the percentage of YFP-positive cells (0.47% or 1 of approximately 213 splenocytes) correlated well with previous reports of the frequency of MHV68-infected splenocytes at this time postinfection (19, 31). The basis for the observed variability in marking splenocytes is unknown but likely reflects several factors, including mouse-to-mouse variation in the efficiency in establishing MHV68 latency. However, this variability did not correlate with any of the recombinant MHV68-YFP isolates used in these studies.
Recombinant MHV68-YFP viruses behave like wild-type MHV68.
To determine whether insertion of the HCMV promoter/enhancer-driven YFP expression cassette had an impact on acute virus replication, lung titers from mice infected with MHV68-YFP via intranasal inoculation were compared to those from mice infected with wild-type MHV68. Lungs were harvested at days 4 and 9 postinfection, and titers were determined by plaque assay. As shown in Fig. 2A, there was no significant difference in the ability of MHV68-YFP to replicate compared to wild-type virus at either day 4 (P = 0.4108) or day 9 (P = 0.4307). We extended these analyses to an examination of establishment latency and reactivation. Mice were infected with either wild-type or MHV68-YFP recombinant viruses and splenocytes harvested between days 16 to 18 postinfection. The frequency of splenocytes harboring viral genome was determined by limiting-dilution PCR analysis. The results of three independent experiments performed with three independent isolates of MHV68-YFP are shown in Fig. 2B. No significant differences were observed in the frequency of viral genome-positive cells between wild-type and the recombinant MHV68-YFP viruses, with 1 in 130 cells harboring viral genome in splenocytes harvested from mice infected with MHV68-YFP compared to 1 of 79 splenocytes from mice infected with wild-type virus. Notably, the mean percentage of YFP-positive splenocytes from these three experiments was 0.52% (1 of 193 cells), which correlated very well with a frequency of viral genome-positive cells determined by the limiting-dilution PCR analyses. The slightly lower frequency of infected cells as determined by flow cytometry may be due to conservative gating to eliminate background fluorescence (see Fig. 1B), thereby missing some YFP-positive cells. Nevertheless, these data show that MHV68-YFP is capable of efficiently marking infected cells at days 16 to 18 postinfection.
FIG. 2.
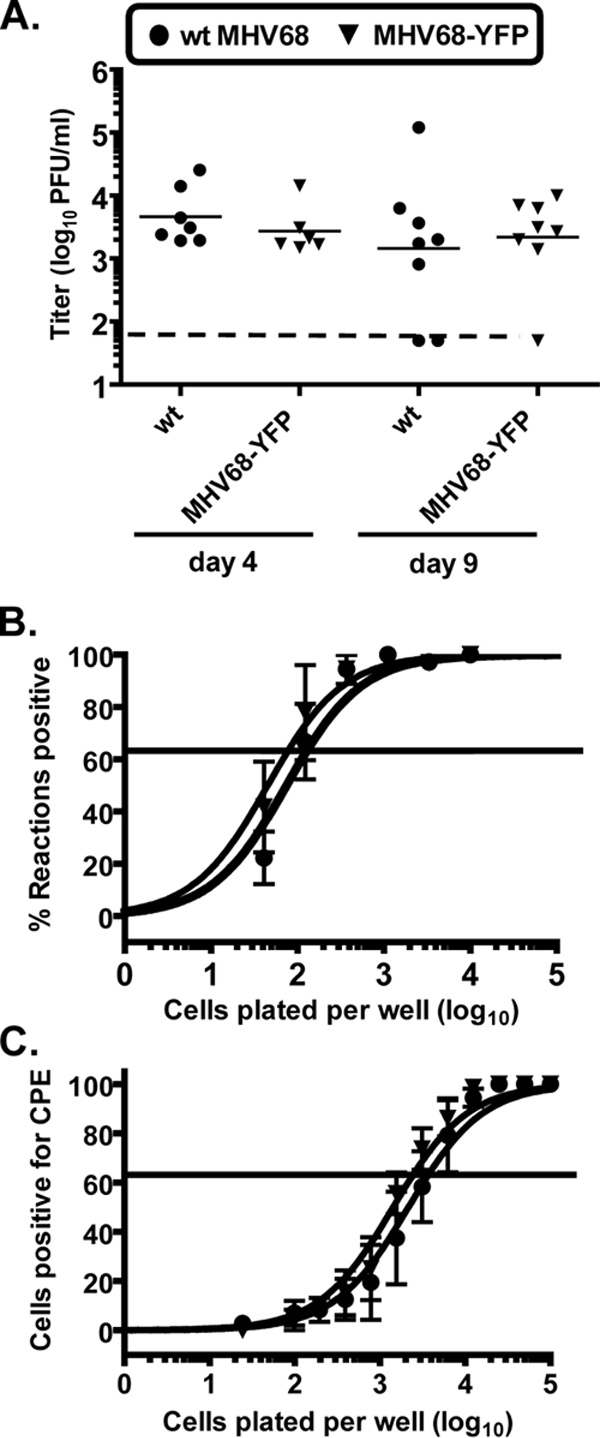
Analysis of replication and splenic latency of MHV68-YFP. (A) Acute replication in mice infected intranasally with 1,000 PFU of wild-type virus or MHV68-YFP at day 4 or 9 postinfection. Lung titers were determined by plaque assay, and the results are from two independent experiments with three to five mice per group. The solid lines represent mean titers for each group, and the dashed line represents the limit of detection of 50 PFU for this assay. (B) Frequency of viral genome positive cells at 16 to 18 days postinfection. Limiting-dilution PCR analysis was performed to determine the frequency of genome-positive cells from mice infected intranasally with 1,000 PFU of wild-type virus or MHV68-YFP. (C) Frequency of splenocytes capable of reactivating virus. Serial dilutions of bulk splenocytes were plated on monolayers of indicator MEFs, and the presence of reactivating virus was determined by the presence of cytopathic effect (CPE). The data for panels B and C are from three individual experiments with three mice per group. Each experiment was performed with an independent isolate of MHV68-YFP, one with the YFP expression cassette cloned in the forward orientation and two cloned in the reverse orientation. Curve fit lines were derived from nonlinear regression analysis, and symbols represent the mean percentage of viral DNA positive wells (B) or wells positive for CPE (C) ± the standard errors of the mean. The horizontal lines represent 63.2%, from which the frequency of genome positive or reactivating cells was calculated by Poisson distribution.
The ability of the MHV68-YFP recombinant viruses to reactivate from latency was evaluated using a limiting-dilution ex vivo reactivation assay on MEFs (Fig. 2C). No significant differences were observed in reactivation from latency between wt virus and the MHV68-YFP recombinant viruses, with 1 of 3,717 splenocytes capable of reactivating virus from MHV68-YFP infected animals compared to 1 of 2,442 splenocytes from wild-type-infected animals. Taken together, these data show that insertion of the YFP expression cassette into the viral genome and expression of YFP does not have a discernible impact on the ability of the virus to replicate or establish latency. In addition, the close correlation between the percentage of YFP-positive cells and the frequency of genome-positive cells suggests that MHV68-YFP is able to mark a high percentage of infected cells.
Characterization of MHV68 latency and reactivation of YFP-expressing splenocytes.
To formally show that YFP-positive cells are infected with the MHV68-YFP, as well as to directly determine the efficiency of marking latently infected splenocytes, YFP-positive and YFP-negative splenocytes were isolated by flow cytometry. Two independent experiments were performed. For each experiment, 12 mice were infected intranasally with 1,000 PFU of MHV68-YFP, and spleens were harvested at day 18 postinfection. Post-sort analyses showed that the purity of the YFP-positive fractions was 92.5 and 95.1% for the two independent experiments, whereas the purity of the YFP-negative fractions was 99.3 and 99.6% (representative flow plots from one of the sorts are shown in Fig. 3A). It should be noted that the gate used to collect YFP-negative cells was set to avoid collecting the intermediate population (between the clear YFP-negative and YFP-positive populations), which appears to be composed of both YFP-positive cells and autofluorescing cells (see Fig. 1B). Using this approach we were able to isolate relatively large populations of YFP-positive cells (1.5 × 10⁶ cells in the first sort and 1.2 × 10⁶ cells in the second sort). To determine the frequency of viral genome-positive cells in each fraction, limiting-dilution PCR analysis was performed (Fig. 3B). This analysis revealed that virtually every cell in the YFP-positive fraction harbored viral genome. For comparison, the unsorted fraction from the second experiment is shown and shows the expected frequency of viral genome-positive cells (ca. 1 of 100 splenocytes). Furthermore, pooled data from both experiments demonstrated that the YFP-negative fraction was efficiently depleted of viral genome positive cells, since only 1 of 1,341 (0.07%) harbored viral genome. Although these may represent MHV68-YFP-infected cells that do not express YFP, it is more likely that they represent contaminating virus-infected, YFP-positive cells based on the percentage of contaminating cells scoring as YFP-positive for these two experiments (0.6 and 0.4%), which likely reflects both virus-infected and autofluorescing cells.
FIG. 3.

YFP-positive cells harbor viral genome. (A) Pre- and post-sort analysis of splenocytes sorted by YFP fluorescence from 12 mice infected intranasally with 1,000 PFU of MHV68-YFP and harvested 18 days postinfection. (B) Limiting-dilution PCR analysis of sorted populations. In the YFP-positive population, all cells were genome positive. The frequency of viral-genome-positive cells in the YFP-negative fraction was negligible and may be the result of contaminating cells since the frequency of genome-positive cells (1 in 1,341 cells [0.07%]) was lower than the percentage of contaminating cells in each sort (0.6 and 0.4%). (C) Limiting-dilution reactivation analysis. The YFP-positive cell fraction was enriched for cells capable of reactivating virus, whereas the frequency of reactivating cells in the YFP-negative fraction was below the limit of detection. (D) Limiting-dilution PCR analysis of splenocytes harvested at day 42 postinfection. A small population of YFP-positive cells that were also genome positive could be isolated, but the frequency of genome-positive cells in the YFP-negative fraction was similar to the unsorted fraction, indicating that the majority of genome-positive cells no longer expressed YFP.
As expected based on the analysis of viral genome-positive cells, the YFP-positive fraction was also enriched in cells capable of reactivating virus (Fig. 3C). Limiting-dilution reactivation analyses revealed that 1 of 56 YFP-positive cells reactivated virus, whereas the frequency of reactivating cells in the YFP-negative fraction was too low to be determined by this assay. Compared to reactivation of bulk splenocytes shown in Fig. 2C, the YFP-positive fraction was enriched for reactivating cells by nearly 70-fold. However, this may be an underestimate due to loss of cell viability and/or reactivation efficiency as a result of the prolonged sorting process. To account for any loss of viability, bulk splenocytes in the second experiment were kept on ice in fluorescence-activated cell sorting buffer for the duration of the sort before plating for the reactivation assay. The frequency of reactivating cells in this fraction was only 1 of 12,285 cells, which is ∼3-fold lower than cells plated directly after harvesting (compare Fig. 2B and 3C).
When splenocytes were sorted at day 42 postinfection, an enriched population of YFP-positive cells that were also viral genome-positive could be isolated (Fig. 3D), but far fewer cells were recovered compared to days 16 to 18 postinfection. Two independent day 42 sorts were performed on splenocytes harvested from 12 infected for each experiment. However, only approximately 6 × 10³ YFP-expressing splenocytes could be recovered from each sort. Notably, as with the splenocyte sorts on days 16 to 18 postinfection, limiting-dilution analyses demonstrated that the YFP-positive cells were all MHV68 infected (Fig. 3D). However, the frequency of viral genome-positive cells in the YFP-negative fraction was similar to that of unsorted cells, indicating that the majority of infected splenocytes at day 42 postinfection no longer express sufficient levels of YFP to be isolated by flow cytometry.
It is not clear why YFP expression was shut down. Although the YFP expression cassette was cloned into a region of the viral genome that is silenced during latency, we hypothesized that expression could be extended by flanking the expression cassette with a cellular insulator sequence. However, our characterization of recombinant viruses harboring the HCMV-driven YFP expression cassette with or without flanking insulator sequences have not shown any significant differences in the levels of YFP expression or the duration of YFP expression during MHV68 infection (data not shown). There are several possible explanations for these results. First, it is possible that the insulator we are using does not function correctly in the context of the MHV68 genome. Alternatively, shut down may reflect direct targeting of the expression cassette by the host response since the HCMV IE promoter/enhancer is known to be shut down by IFN-γ (17, 21) and MHV68 has been shown to induce long-term IFN-γ production (10). Furthermore, although we can efficiently mark cells after intranasal inoculation of MHV68-YFP, expression of YFP could not be detected after intraperitoneal infection (data not shown). The lack of YFP expression was not due to a route specific defect in establishment of latency as the frequency of genome-positive cells was similar between mice infected with MHV68-YFP and wild-type virus. Intraperitoneal inoculation may result in a stronger/altered innate immune response. Thus, we currently favor the interpretation that the HCMV IE promoter/enhancer is directly targeted for silencing by specific host responses and that this silencing cannot be blocked by the presence of flanking insulator sequences. It seems unlikely, based on the normal frequencies of virus-infected cells, that the expression of YFP is leading to a specific host response that leads to the clearance of YFP-expressing cells. We are generating additional recombinant viruses using other promoter-driven expression cassettes to explore these issues.
Taken together, these analyses demonstrate that YFP-positive cells are indeed infected with the recombinant MHV68-YFP virus. In addition, these cells account for virtually all infected cells at days 16 to 18 postinfection since there were very few viral-genome-positive cells in the YFP-negative fraction. Furthermore, these experiments demonstrate the utility of this virus in isolating relatively large populations of infected splenocytes that can be used for more detailed analysis (e.g., investigations into viral and cellular gene expression in specific populations of latently infected cells).
Identification of splenic B-cell populations harboring MHV68.
To demonstrate the utility of MHV68-YFP in directly analyzing infected cell populations, flow cytometry was performed on splenocytes harvested from infected mice at the peak of viral latency. We first analyzed virus infection of newly formed, marginal zone and follicular B-cell populations based on expression of the surface markers CD21 and CD23 (Fig. 4). Although well-defined populations of each cell type could be detected in the analysis of total B cells, the YFP-positive cells did not cleanly fall into the expected gates with a significant percentage of the infected cells appearing to exhibit a phenotype intermediate between these three different B-cell populations. Furthermore, although some of the YFP-positive cells did fall into each of the gates, these cells had a different distribution within these gates than the total B-cell populations. Further complicating this analysis is the fact that CD21 and/or CD23 expression has been shown to be modulated by EBV (9, 13, 16), KSHV (6), and MHV68 (C. M. Collins and S. H. Speck, unpublished data). Thus, some caution in interpreting the distribution of MHV68 to these subpopulations of B cells is necessary, and future studies will need to include the analysis of other surface markers or differences in cellular gene expression that clearly distinguish these B-cell populations. In addition, this underscores the importance of marking infected populations (as opposed to blind gating on known cell populations) since this allows the distribution of the infected cells to be directly compared to the distribution of the total splenocyte population—in this case clearly revealing potentially important differences. Indeed, a previous analysis of the distribution of MHV68 infection after gating on newly formed, follicular and marginal zone B cells failed to account for a significant percentage of the infected B cells (19),which now may be explained by the observations presented here.
FIG. 4.

Analysis of infected B-cell populations. Flow cytometry of splenocytes from naive mice or mice infected with the indicated virus. Newly formed (NF), marginal zone (MZ), and follicular B cells (Fo) were analyzed based on CD21 and CD23 expression on CD19-positive cells. B-cell subsets were defined as follows: NF, CD19+ CD21− CD23−; Fo, CD19+ CD21int CD23hi; and MZ, CD19+ CD21hi CD23−. The top row shows total CD19-positive splenocytes, and the bottom row shows YFP-positive cells (black dots) overlaid on the total CD19 population. The numbers in the top row indicate the percentage of total CD19-positive cells in that gate, whereas numbers in the bottom row represent the percentage of YFP-positive cells. Representative flow cytometry plots taken from two independent experiments with four mice per group are shown.
Because previous reports have identified GC cells as an important reservoir for MHV68 latency (11, 19), we next looked at the germinal center populations based on the expression of CD95 and GL7. Representative flow plots from naive, as well as mice infected with either wild-type virus or MHV68-YFP, are shown in Fig. 5A. Although there was a slightly higher percentage of GC cells in mice infected with MHV68-YFP compared to the wild type at both day 14 and day 18 postinfection, these differences were not statistically significant (Fig. 5B). When the YFP-positive fraction was analyzed, the majority of these cells fell into the GC gate (Fig. 5C). At both days 14 and 18 postinfection ca. 70% of the YFP-positive cells expressed GC markers. Furthermore, nearly all YFP-positive cells that did not fall into the GC gate were CD95hi/GL7int, suggesting that these cells may be entering the germinal center reaction. These results correlate well with previous characterizations of MHV68 latency, which determined that a high percentage of infected cells have a germinal center cell surface phenotype (11, 19). Analysis of the percentage of total GC center cells that were infected based of YFP expression showed that a significant proportion of GC cells were indeed infected (Fig. 5D). At day 14, 16.9% (1 of 5.9) GC cells were YFP positive, whereas 9.8% (1 of 10.2) were infected at day 18 (Fig. 5E).
FIG. 5.

Germinal center B-cell analysis. (A) Mice were infected with the indicated virus and spleens were harvested at the indicated day postinfection. Germinal center B cells were defined as CD19+ CD95hi GL7hi. The top row shows representative flow plots of the total CD19-positive population, and the bottom row shows YFP-positive cells (black dots) overlaid onto the total CD19 population. The numbers in the top row represent the percentage of CD19-positive cells that are germinal center B cells, and the numbers in the bottom row represent the percentage of YFP-positive cells that are germinal center positive. (B) Percentage of total B cells that are germinal center positive. (C) Percentage of YFP-positive cells that are germinal center positive. (D) Representative flow plots showing the percentage of germinal center cells that are infected based on YFP expression. (E) Percentage of infected germinal center cells at the indicated day postinfection based on YFP expression. In panels B, C, and E, the solid bar represents the mean. The results are shown from two independent experiments with three to four mice per group.
During initial experiments analyzing infected B-cell populations, we noticed that a small population of YFP-positive cells appeared to have downregulated expression of the pan B-cell marker B220. Because B220 is downregulated on plasma cells, we analyzed the plasma cell fraction for the presence of YFP-positive cells (Fig. 6A). There was no difference in the percentage of total plasma cells between mice infected with MHV68-YFP compared to the wild-type virus at either day 14 or day 18 postinfection (Fig. 6B). There were slightly more plasma cells at day 14 than at day 18 in both wild-type- and MHV68-YFP-infected animals, and analysis of the YFP-positive fraction showed that at day 14 ca. 16% of the infected cells had a plasma cell phenotype, which decreased to ca. 7% by day 18 postinfection (Fig. 6C).
FIG. 6.

Plasma cell analysis. (A) Mice were infected with the indicated virus and splenocytes were harvested on the indicated days postinfection. Plasma cells were defined as B220neg-lo CD138hi. The top row shows representative flow plots of the total splenocyte population, and the bottom row shows the YFP-positive cells (black dots) overlaid onto the total population. The numbers in the top row indicate the percentage of total splenocytes that are plasma cells, and the number in the bottom row indicate the percentage of YFP-positive cells that are plasma cells. (B) Percentage of total splenocytes that are plasma cells. (C) Percentage of YFP-positive cells that are plasma cells. The bar represents the mean. The results are shown from two independent experiments with three to five mice per group.
The appearance of plasma cells in the spleen after MHV68 infection is transient, with few plasma cells being detectable by day 42 postinfection (X. Liang, C. M. Collins, and S. H. Speck, unpublished data). Based on recent data indicating that reactivation of both EBV and KSHV may be linked to plasma cell differentiation (2, 32), it is attractive to speculate that MHV68-infected plasma cells may contribute to the spontaneous virus reactivation observed after explant of infected splenocytes onto MEF monolayers. Indeed, the frequency of MHV68-infected plasma cells correlates closely with the frequency of splenocytes that reactivate virus after explant at days 16 to 18 postinfection. Consistent with this prediction, we have now shown in separate studies that plasma cells account for the majority of the spontaneous virus reactivation observed after explant of splenocytes at days 16 to 18 postinfection (X. Liang et al., unpublished data).
Conclusions.
In summary, we have created a virus that efficiently marks infected cells during the establishment of MHV68 latency. The ability to directly detect and purify infected cells will allow more detailed analyses. In addition, this approach will allow detailed investigations of the role that both viral and cellular genes play in establishing infection in various cellular compartments, as well as being useful in tracking virus infection in transgenic mice and by layering specific viral mutations onto the MHV68-YFP backbone. The generation of recombinant viruses that extend the duration of transgene expression is currently a high priority.
Acknowledgments
We thank Robert Karaffa and Sommer Durham for assistance with fluorescence-activated cell sorting and members of the Speck lab for comments and suggestions.
This research was supported by NIH grant R01CA095318. S.H.S. was also supported by NIH grants R01AI073830, R01CA058524, and R01CA087650.
Footnotes
Published ahead of print on 22 April 2009.
REFERENCES
- 1.Adler, H., M. Messerle, M. Wagner, and U. H. Koszinowski. 2000. Cloning and mutagenesis of the murine gammaherpesvirus 68 genome as an infectious bacterial artificial chromosome. J. Virol. 746964-6974. [DOI] [PMC free article] [PubMed] [Google Scholar]
- 2.Bhende, P. M., S. J. Dickerson, X. Sun, W. H. Feng, and S. C. Kenney. 2007. X-box-binding protein 1 activates lytic Epstein-Barr virus gene expression in combination with protein kinase D. J. Virol. 817363-7370. [DOI] [PMC free article] [PubMed] [Google Scholar]
- 3.Blaskovic, D., M. Stancekova, J. Svobodova, and J. Mistrikova. 1980. Isolation of five strains of herpesviruses from two species of free living small rodents. Acta Virol. 24468. [PubMed] [Google Scholar]
- 4.Cesarman, E., Y. Chang, P. S. Moore, J. W. Said, and D. M. Knowles. 1995. Kaposi's sarcoma-associated herpesvirus-like DNA sequences in AIDS-related body-cavity-based lymphomas. N. Engl. J. Med. 3321186-1191. [DOI] [PubMed] [Google Scholar]
- 5.Cesarman, E., R. G. Nador, K. Aozasa, G. Delsol, J. W. Said, and D. M. Knowles. 1996. Kaposi's sarcoma-associated herpesvirus in non-AIDS related lymphomas occurring in body cavities. Am. J. Pathol. 14953-57. [PMC free article] [PubMed] [Google Scholar]
- 6.Chang, H., Y. Gwack, D. Kingston, J. Souvlis, X. Liang, R. E. Means, E. Cesarman, L. Hutt-Fletcher, and J. U. Jung. 2005. Activation of CD21 and CD23 gene expression by Kaposi's sarcoma-associated herpesvirus RTA. J. Virol. 794651-4663. [DOI] [PMC free article] [PubMed] [Google Scholar]
- 7.Chang, Y., E. Cesarman, M. S. Pessin, F. Lee, J. Culpepper, D. M. Knowles, and P. S. Moore. 1994. Identification of herpesvirus-like DNA sequences in AIDS-associated Kaposi's sarcoma. Science 2661865-1869. [DOI] [PubMed] [Google Scholar]
- 8.Clambey, E. T., H. W. t. Virgin, and S. H. Speck. 2000. Disruption of the murine gammaherpesvirus 68 M1 open reading frame leads to enhanced reactivation from latency. J. Virol. 741973-1984. [DOI] [PMC free article] [PubMed] [Google Scholar]
- 9.Cordier-Bussat, M., M. Billaud, A. Calender, and G. M. Lenoir. 1993. Epstein-Barr virus (EBV) nuclear-antigen-2-induced up-regulation of CD21 and CD23 molecules is dependent on a permissive cellular context. Int. J. Cancer 53153-160. [DOI] [PubMed] [Google Scholar]
- 10.Evans, A. G., J. M. Moser, L. T. Krug, V. Pozharskaya, A. L. Mora, and S. H. Speck. 2008. A gammaherpesvirus-secreted activator of Vβ4+ CD8+ T cells regulates chronic infection and immunopathology. J. Exp. Med. 205669-684. [DOI] [PMC free article] [PubMed] [Google Scholar]
- 11.Flano, E., S. M. Husain, J. T. Sample, D. L. Woodland, and M. A. Blackman. 2000. Latent murine gamma-herpesvirus infection is established in activated B cells, dendritic cells, and macrophages. J. Immunol. 1651074-1081. [DOI] [PubMed] [Google Scholar]
- 12.Flano, E., I. J. Kim, D. L. Woodland, and M. A. Blackman. 2002. Gamma-herpesvirus latency is preferentially maintained in splenic germinal center and memory B cells. J. Exp. Med. 1961363-1372. [DOI] [PMC free article] [PubMed] [Google Scholar]
- 13.Kempkes, B., M. Pawlita, U. Zimber-Strobl, G. Eissner, G. Laux, and G. W. Bornkamm. 1995. Epstein-Barr virus nuclear antigen 2-estrogen receptor fusion proteins transactivate viral and cellular genes and interact with RBP-J. kappa in a conditional fashion. Virology 214675-679. [DOI] [PubMed] [Google Scholar]
- 14.Krug, L. T., J. M. Moser, S. M. Dickerson, and S. H. Speck. 2007. Inhibition of NF-κB activation in vivo impairs establishment of gammaherpesvirus latency. PLoS Pathog. 3e11. [DOI] [PMC free article] [PubMed] [Google Scholar]
- 15.Kuppers, R. 2003. B cells under influence: transformation of B cells by Epstein-Barr virus. Nat. Rev. Immunol. 3801-812. [DOI] [PubMed] [Google Scholar]
- 16.Larcher, C., B. Kempkes, E. Kremmer, W. M. Prodinger, M. Pawlita, G. W. Bornkamm, and M. P. Dierich. 1995. Expression of Epstein-Barr virus nuclear antigen-2 (EBNA2) induces CD21/CR2 on B and T-cell lines and shedding of soluble CD21. Eur. J. Immunol. 251713-1719. [DOI] [PubMed] [Google Scholar]
- 17.Lui, V. W., L. D. Falo, Jr., and L. Huang. 2001. Systemic production of IL-12 by naked DNA mediated gene transfer: toxicity and attenuation of transgene expression in vivo. J. Gene Med. 3384-393. [DOI] [PubMed] [Google Scholar]
- 18.Majumder, P., J. A. Gomez, and J. M. Boss. 2006. The human major histocompatibility complex class II HLA-DRB1 and HLA-DQA1 genes are separated by a CTCF-binding enhancer-blocking element. J. Biol. Chem. 28118435-18443. [DOI] [PubMed] [Google Scholar]
- 19.Marques, S., S. Efstathiou, K. G. Smith, M. Haury, and J. P. Simas. 2003. Selective gene expression of latent murine gammaherpesvirus 68 in B lymphocytes. J. Virol. 777308-7318. [DOI] [PMC free article] [PubMed] [Google Scholar]
- 20.Moser, J. M., J. W. Upton, R. D. Allen, 3rd, C. B. Wilson, and S. H. Speck. 2005. Role of B-cell proliferation in the establishment of gammaherpesvirus latency. J. Virol. 799480-9491. [DOI] [PMC free article] [PubMed] [Google Scholar]
- 21.Qin, L., Y. Ding, D. R. Pahud, E. Chang, M. J. Imperiale, and J. S. Bromberg. 1997. Promoter attenuation in gene therapy: interferon-gamma and tumor necrosis factor-alpha inhibit transgene expression. Hum. Gene Ther. 82019-2029. [DOI] [PubMed] [Google Scholar]
- 22.Rajcani, J., D. Blaskovic, J. Svobodova, F. Ciampor, D. Huckova, and D. Stanekova. 1985. Pathogenesis of acute and persistent murine herpesvirus infection in mice. Acta Virol. 2951-60. [PubMed] [Google Scholar]
- 23.Smith, G. A., and L. W. Enquist. 1999. Construction and transposon mutagenesis in Escherichia coli of a full- length infectious clone of pseudorabies virus, an alphaherpesvirus. J. Virol. 736405-6414. [DOI] [PMC free article] [PubMed] [Google Scholar]
- 24.Soulier, J., L. Grollet, E. Oksenhendler, P. Cacoub, D. Cazals-Hatem, P. Babinet, M. F. d'Agay, J. P. Clauvel, M. Raphael, L. Degos, et al. 1995. Kaposi's sarcoma-associated herpesvirus-like DNA sequences in multicentric Castleman's disease. Blood 861276-1280. [PubMed] [Google Scholar]
- 25.Sunil-Chandra, N. P., S. Efstathiou, J. Arno, and A. A. Nash. 1992. Virological and pathological features of mice infected with murine gamma-herpesvirus 68. J. Gen. Virol. 73(Pt. 9)2347-2356. [DOI] [PubMed] [Google Scholar]
- 26.Sunil-Chandra, N. P., S. Efstathiou, and A. A. Nash. 1992. Murine gammaherpesvirus 68 establishes a latent infection in mouse B lymphocytes in vivo. J. Gen. Virol. 73(Pt. 12)3275-3279. [DOI] [PubMed] [Google Scholar]
- 27.Thompson, M. P., and R. Kurzrock. 2004. Epstein-Barr virus and cancer. Clin. Cancer Res. 10803-821. [DOI] [PubMed] [Google Scholar]
- 28.Weck, K. E., M. L. Barkon, L. I. Yoo, S. H. Speck, and H. I. Virgin. 1996. Mature B cells are required for acute splenic infection, but not for establishment of latency, by murine gammaherpesvirus 68. J. Virol. 706775-6780. [DOI] [PMC free article] [PubMed] [Google Scholar]
- 29.Weck, K. E., S. S. Kim, H. I. Virgin, and S. H. Speck. 1999. B cells regulate murine gammaherpesvirus 68 latency. J. Virol. 734651-4661. [DOI] [PMC free article] [PubMed] [Google Scholar]
- 30.Weck, K. E., S. S. Kim, H. I. Virgin, and S. H. Speck. 1999. Macrophages are the major reservoir of latent murine gammaherpesvirus 68 in peritoneal cells. J. Virol. 733273-3283. [DOI] [PMC free article] [PubMed] [Google Scholar]
- 31.Willer, D. O., and S. H. Speck. 2003. Long-term latent murine Gammaherpesvirus 68 infection is preferentially found within the surface immunoglobulin D-negative subset of splenic B cells in vivo. J. Virol. 778310-8321. [DOI] [PMC free article] [PubMed] [Google Scholar]
- 32.Wilson, S. J., E. H. Tsao, B. L. Webb, H. Ye, L. Dalton-Griffin, C. Tsantoulas, C. V. Gale, M. Q. Du, A. Whitehouse, and P. Kellam. 2007. X box binding protein XBP-1s transactivates the Kaposi's sarcoma-associated herpesvirus (KSHV) ORF50 promoter, linking plasma cell differentiation to KSHV reactivation from latency. J. Virol. 8113578-13586. [DOI] [PMC free article] [PubMed] [Google Scholar]
- 33.Young, L. S., and P. G. Murray. 2003. Epstein-Barr virus and oncogenesis: from latent genes to tumours. Oncogene 225108-5121. [DOI] [PubMed] [Google Scholar]