Abstract
It has been suggested that the major source of vitamin D should come from dietary sources and not sun exposure. However, the major fortified dietary source of vitamin D is milk which often doesn’t contain at least 80% of what is stated on the label. Fish has been touted as an excellent source of vitamin D especially oily fish including salmon and mackerel. Little is known about the effect of various cooking conditions on the vitamin D content in fish. We initiated a study and evaluated the vitamin D content in several species of fish and also evaluated the effect of baking and frying on the vitamin D content. Surprisingly, farmed salmon had approximately 25% of the vitamin D content as wild salmon had. The vitamin D content in fish varied widely even within species. These data suggest that the tables that list the vitamin D content are out-of-date and need to be re-evaluated.
Keywords: vitamin D, fish, HPLC, sunlight, diet, salmon
Introduction
Vitamin D deficiency is now recognized as a world-wide problem for both children and adults (1–3). Because of concern about sun exposure and skin cancer, both children and adults either avoid sun exposure or use sun protection which puts them at high risk for vitamin D deficiency. Thus, their only source of vitamin D is from the diet or supplements. The major fortified foods in the United States that contain vitamin D include milk (100 IU/8 oz), some orange juices (100 IU vitamin D3/8 oz), some breads, yogurts and cheeses. Irradiated mushrooms contain vitamin D2 in varied amounts. Naturally vitamin D is found in the flesh of oily fish. Based on the dietary tables, it is suggested that salmon contains approximately 400 IU of vitamin D3/3.5 oz.
Methods
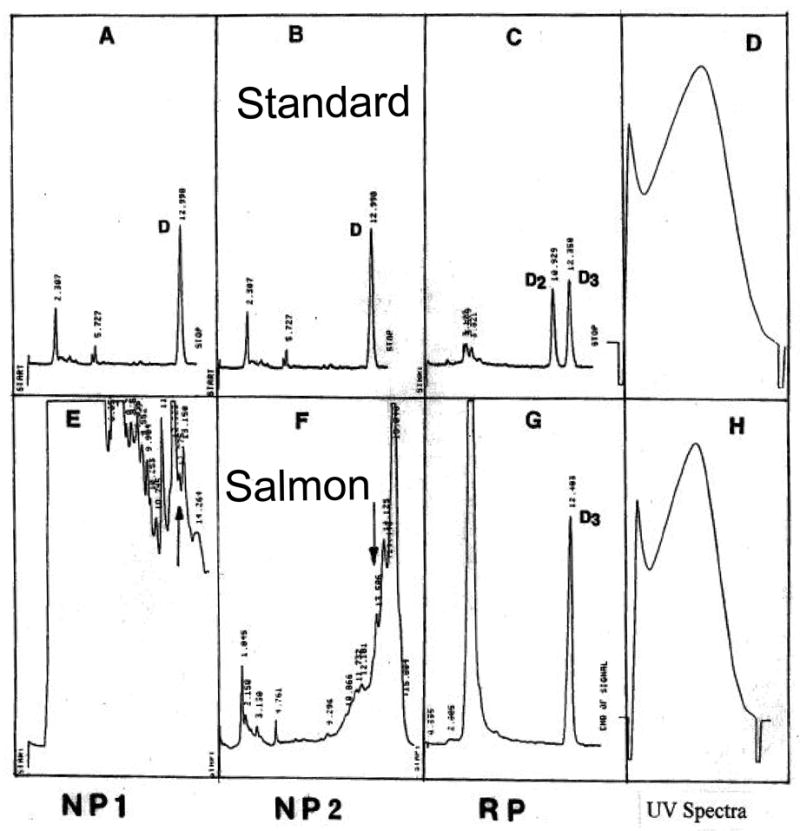
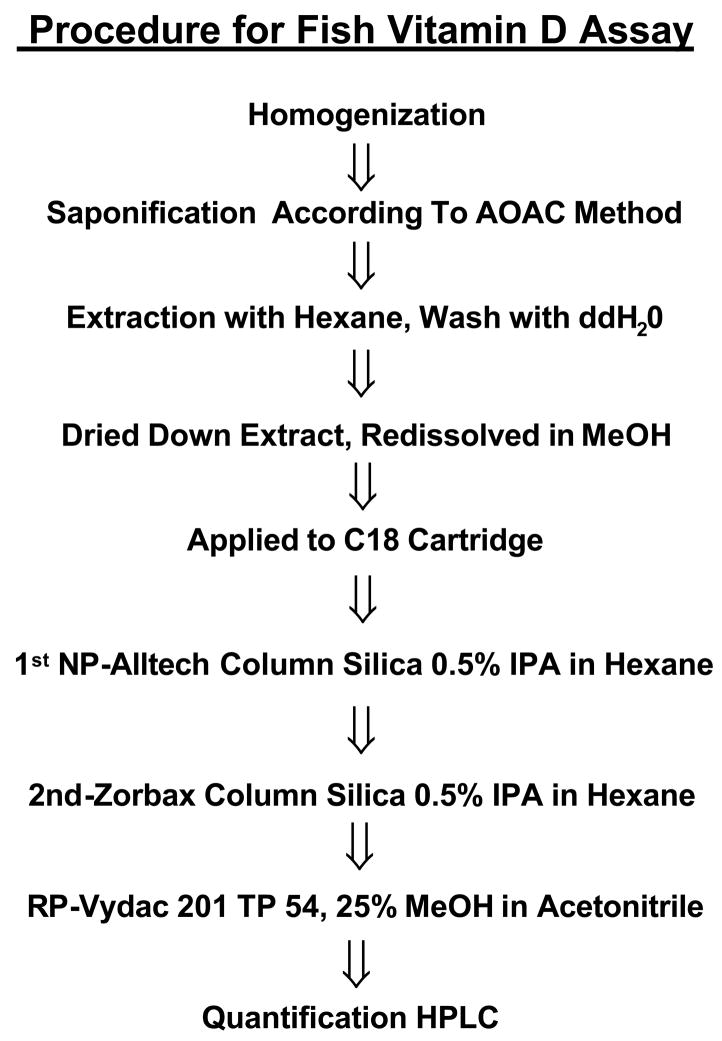
A vitamin D assay was developed to determine the vitamin D content in foods. The details are shown in Figure 1. Typically 1 gram of fish flesh was saponified and then extracted for its lipid content. The lipid extract was chromatographed on a preparative C-18 reverse phase column. The vitamin D fraction was collected and chromatographed on a straight phase high performance liquid chromatography system (HPLC). The vitamin D fraction was collected and chromatographed on a reverse phase HPLC to quantify the vitamin D2 and vitamin D3 content based on the UV absorption and area under the curve (Figure 2).
Figure 1.
Figure 2.

High performance liquid chromatography (HPLC) tracings and the ultraviolet absorption spectrum of the vitamin D3 that was recovered from the final reverse phase (RP) HPLC. The top panel is the standard vitamin D3 and the bottom panel is the HPLC chromatograms and UV absorption spectrum of a sample of salmon flesh that had been processed according to the procedure outlined in Figure 1. NP1 represents the first normal phase chromatography profile and NP2 represents the second HPLC profile of the vitamin D region recovered from the first NP1 chromatography.
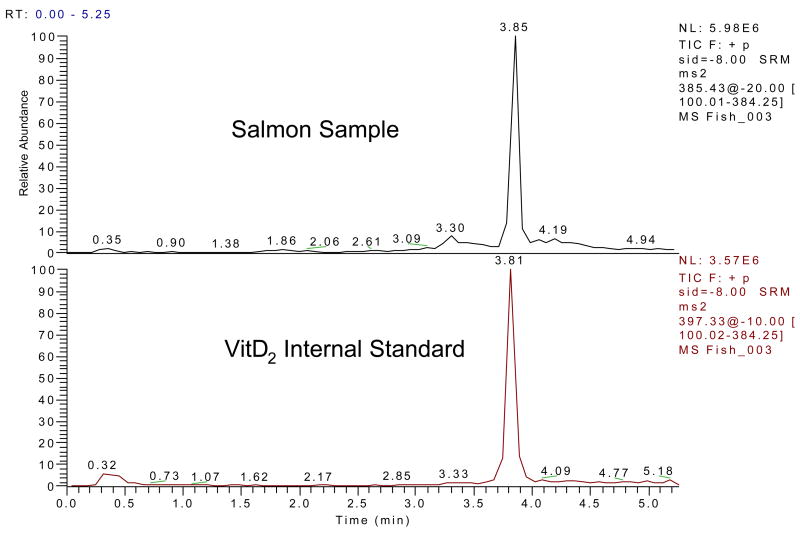
For confirmation, a subset samples were recovered from the reverse phase HPLC and applied to a liquid chromatography tandem mass spectroscopy system as previously described (4) (Figure 3).
Figure 3.
Top panel is the liquid chromatography tandem mass spectroscopy profile of the vitamin D3 recovered from a representative salmon fish sample. The bottom panel represents the vitamin D2 internal standard.
Results
The average content of vitamin D3 found in wild caught salmon was 988 ± 524 (mean ± SEM) IU of vitamin D3/3.5 oz which is a typical amount that is served for dinner (Table) In contrast, farmed salmon had approximately 25% of the vitamin D content present in the flesh of wild salmon. The mean concentration in the flesh of farmed salmon was 240 ± 108 IU of vitamin D3. Blue fish is a very oily fish and thus thought to be an excellent source of dietary vitamin D3. However, our analysis revealed in four different samples of blue fish, a mean concentration of 280 ± 68 IU of vitamin D3/3.5 oz. White fish that typically has very little fat in its flesh including cod and gray sole were found to have 104 ± 24 IU and 56 ± 36 of vitamin D3/3.5 oz respectively. In addition, farmed trout contained 388 ± 212 IU of vitamin D3 and tuna Ahi-yt had 404 ± 440 IU of vitamin D3.
Table.
Vitamin D Content in Fish
| Vitamin D | ||
|---|---|---|
| IU/OZ | (N) | |
| Blue fish | 280 ±68 | (4) |
| Cod | 104 ±24 | (3) |
| Grey sole | 56 ± 36 | (9) |
| Salmon Farm | 240 ±108 | (9) |
| Salmon Wild | 988 ±524 | (9) |
| Trout Farm | 388 ±212 | (4) |
| Tuna Ahi-YT | 404 ±440 | (4) |
Little is known about the effect of cooking on the vitamin D content in fish. When farm salmon was baked, almost all of the vitamin D content, i.e. 240 IU of vitamin D3 was recovered from 3.5 oz. of salmon. The initial concentration in the uncooked salmon was 245 IU of vitamin D3. However, when the salmon was fried in vegetable oil, approximately 50% (123 IU of vitamin D3 was recovered.)
We also evaluated the vitamin D content in mackerel which is traditionally considered to be an excellent source of vitamin D3 because of its oily content. However, in the one sample that we tested, we only observed 24 IU of vitamin D3 in 3.5 oz.
Conclusion
It has been suggested by those who have little knowledge of human nutrition and little expertise in the field of vitamin D that everyone can obtain enough of their vitamin D requirement from their diet and that any unprotected sun exposure should be avoided (5). However, most experts agree that 1,000 IU of vitamin D3 is required if there is no exposure to sunlight (1–3, 6,7). It has been assumed that fish, especially oily fish such as salmon, mackerel and blue fish are excellent sources of vitamin D3. However, our analysis of the vitamin D content in a variety of fish species that were thought to contain an adequate amount of vitamin D did not have an amount of vitamin D that is listed in food charts. There needs to be a reevaluation of the vitamin D content in foods that have been traditionally recommended as good sources of naturally occurring vitamin D.
Acknowledgments
This work was supported in part by the UV Foundation
Footnotes
Publisher's Disclaimer: This is a PDF file of an unedited manuscript that has been accepted for publication. As a service to our customers we are providing this early version of the manuscript. The manuscript will undergo copyediting, typesetting, and review of the resulting proof before it is published in its final citable form. Please note that during the production process errors may be discovered which could affect the content, and all legal disclaimers that apply to the journal pertain.
References
- 1.Holick MF. High prevalence of vitamin D inadequacy and implications for health. Mayo Clin Proc. 2006;81(3):353–373. doi: 10.4065/81.3.353. [DOI] [PubMed] [Google Scholar]
- 2.Hollis BW. Circulating 25-hydroxyvitamin D levels indicative of vitamin sufficiency: implications for establishing a new effective DRI for vitamin D. J Nutr. 2005;135:317–322. doi: 10.1093/jn/135.2.317. [DOI] [PubMed] [Google Scholar]
- 3.Vieth R, Cole DE, Hawker GA, Trang HM, Rubin LA. Wintertime vitamin D insufficiency is common in young Canadian women, and their vitamin D intake does not prevent it. European Journal of Clinical Nutrition. 2001;55:1091–1097. doi: 10.1038/sj.ejcn.1601275. [DOI] [PubMed] [Google Scholar]
- 4.Holick MF, Siris ES, Binkley N, Beard MK, Khas A, Katzer JT, Petruschke RA, Chen E, de Papp AE. Prevalence of vitamin D inadequacy among postmenopausal North American women receiving osteoporosis therapy. J Clin Endocrinol Metab. 2005;90:3215–3224. doi: 10.1210/jc.2004-2364. [DOI] [PubMed] [Google Scholar]
- 5.Wolpowitz D, Gilchrest BA. The vitamin D questions: How much do you need and how should you get it? J Am Acad Dermatol. 2006;54:301–317. doi: 10.1016/j.jaad.2005.11.1057. [DOI] [PubMed] [Google Scholar]
- 6.Barger-Lux MJ, Heaney RP, Dowell S, Chen TC, Holick MF. Vitamin D and its major metabolites: serum levels after graded oral dosing in healthy men. Osteoporosis Int. 1998;8:222–230. doi: 10.1007/s001980050058. [DOI] [PubMed] [Google Scholar]
- 7.Heaney RP, Dowell MS, Hale CA, Bendich A. Calcium absorption varies within the reference range for serum 25-hydroxyvitamin D. J Am Coll Nutr. 2003;22(2):142–146. doi: 10.1080/07315724.2003.10719287. [DOI] [PubMed] [Google Scholar]


