

Abstract
Chronic cocaine treatment is associated with changes in dendritic spines in the nucleus accumbens, but it is unknown whether this neuroplasticity alters the effect of a subsequent cocaine injection on spine morphology and protein content. Three weeks after daily cocaine or saline administration, neurons in the accumbens were filled with the lipophilic dye, DiI. Although daily cocaine pretreatment did not alter spine density compared with daily saline, there was a shift from smaller to larger diameter spines. During the first 2 h after an acute cocaine challenge, a bidirectional change in spine head diameter and increase in spine density was measured in daily cocaine-pretreated animals. In contrast, no change in spine diameter or density was elicited by a cocaine challenge in daily saline animals during the first 2 h after injection. However, spine density was elevated at 6 h after a cocaine challenge in daily saline-pretreated animals. The time-dependent profile of proteins in the postsynaptic density subfraction elicited by a cocaine challenge in daily cocaine-pretreated subjects indicated that the changes in spine diameter and density were associated with a deteriorating actin cytoskeleton and a reduction in glutamate signaling-related proteins. Correspondingly, the amplitude of field potentials in accumbens evoked by stimulating prefrontal cortex was reduced for up to 6 h after acute cocaine in daily cocaine-withdrawn animals. These data indicate that daily cocaine pretreatment dysregulates dendritic spine plasticity elicited by a subsequent cocaine injection.
Introduction
Cocaine addiction is a neuropsychiatric disease that has severe personal and social consequences (Vocci and Ling, 2005). Because cocaine produces neuroplasticity in brain circuitry important for guiding adaptive behavior (Hyman et al., 2006; Kalivas and O'Brien, 2008), the enduring vulnerability to relapse characterizing addiction is thought to result from chronic deviations in neurobiological mechanisms controlling behavior (Koob and LeMoal, 2001). Loss of behavioral homeostasis alters subsequent drug experiences, further diminishing behavioral control and creating a progressively deteriorating disorder (Ahmed et al., 2002; Conrad et al., 2008). Because cocaine addiction is an enduring change in behavioral set point that affects subsequent drug-induced behavior, the cellular neuroplasticity underlying the loss of behavioral homeostasis may be a form of metaplasticity. Metaplasticity was originally defined as a type of synaptic plasticity in which the history of synaptic activity alters the direction or magnitude of plasticity in response to subsequent stimulation (Abraham and Bear, 1996). More recently, researching metaplasticity has included studying the alterations in morphological, biochemical, physiological and behavioral processes that change the ability to generate synaptic plasticity (Abraham, 2008). Thus, in this study we sought to determine whether withdrawal from repeated cocaine administration may induce metaplasticity that alters the capacity of a subsequent cocaine injection to elicit morphological, biochemical, and physiological plasticity.
A major focus in the search for enduring neuroplasticity underlying cocaine addiction is on cellular adaptations in excitatory transmission in the nucleus accumbens (Wolf, 1998; Nestler, 2005; Kalivas and O'Brien, 2008). Correspondingly, AMPA relative to NMDA synaptic currents are increased in the accumbens after withdrawal from cocaine (Kourrich et al., 2007; Conrad et al., 2008). This increase in postsynaptic glutamate transmission is associated with increased dendritic spine density (Robinson and Kolb, 2004) and alterations in the content of proteins associated with the excitatory postsynaptic density (PSD) that regulate glutamate signaling and spine morphology (Swanson et al., 2001; Yao et al., 2004; Boudreau and Wolf, 2005; Toda et al., 2006; Pulipparacharuvil et al., 2008), notably an increase in surface expression of GluR1 (Boudreau and Wolf, 2005). Metaplasticity resulting from repeated cocaine administration has been demonstrated in some measures of excitatory transmission, such as reduced AMPA to NMDA synaptic currents, and increased internalization of the GluR1 subunit of AMPA receptors at 24 h after an acute cocaine injection in the accumbens of animals withdrawn from repeated cocaine administration (Boudreau et al., 2007; Kourrich et al., 2007). Also, withdrawal from repeated cocaine promotes the capacity of acute cocaine to increase accumbens glutamate release (Pierce et al., 1996). The present study expands on these findings by showing that withdrawal from daily cocaine may induce a form of metaplasticity that alters the capacity of a subsequent cocaine injection to modulate dendritic spine morphology, PSD proteins and evoked field potentials in the nucleus accumbens.
Materials and Methods
Animals.
Male Sprague Dawley rats (300–325 g; Charles River) were used in all experiments. All protocols were approved by an Institutional Animal Care and Use Committee and were conducted in accordance with the National Institutes of Health Guide for the Care and Use of Laboratory Animals (revised 1996). A 12 h light/dark cycle was used with light on at 7:00 A.M. Rats were housed in groups of two in the animal vivariums (12 h light/dark cycle, light on at 7:00 A.M.), and were given water and food ad libitum.
Cocaine administration.
All rats were acclimatized to the housing facility for 1 week before beginning daily drug injections. Rats were treated with either daily saline or cocaine in their home cages (7 d; 15 mg/kg, i.p., on the first and last day, 30 mg/kg, i.p., on the intervening 5 d). This treatment regimen induces behavioral sensitization (Pierce et al., 1996). At 3 weeks after the last daily injection, the animals were decapitated or brains fixed at various times (0 min, 10 min, 45 min, 2 h, 6 h and 24 h) after an acute injection of cocaine (30 mg/kg, i.p.) or saline for immunoblotting and morphological analyses. Cocaine-HCl was provided by National Institute on Drug Abuse.
Immunoblotting and subfractionation.
After 3 weeks of withdrawal from daily cocaine (N = 148) or saline (N = 156)-withdrawn animals were divided into groups and decapitated corresponding to times just before a cocaine (30 mg/kg, i.p.) or saline injection (e.g., at T = 0 min) or after acute injection (e.g., at T = 10 min, 45 min, 2 h, 6 h or 24 h). This resulted in N = 5–15 for each protein at each time point. Protein content in dendritic spines was estimated by fractionating accumbens crude membranes into a detergent (Triton X-100) insoluble subfraction that contained a relatively higher concentration of proteins associated with the PSD (supplemental Fig. S1, available at www.jneurosci.org as supplemental material, illustrates protein separation between the detergent soluble and insoluble subfractions). Subcellular fractionation and immunoblotting were performed as described in detail previously (Toda et al., 2006). Immunolabeling was visualized by enhanced chemiluminescence (GE Healthcare) and band density was quantified by densitometry using Image J (NIH). All antibodies were purchased commercially; PSD-95 (Sigma-Aldrich, 1:1000), actin (Santa Cruz Biotechnology, 1:200), ARP3 (BD Biosciences, 1:1000), Rab11 (BD Biosciences, 1:1000), β-catenin (BD Biosciences, 1:1000), α-CaMKII (Abcam, 1:1000), NR1 (Millipore, 1:1000), NR2A (Millipore, 1:1000), cofilin (BD Biosciences, 1:1000), p-cofilin (Millipore, 1:500), and 20 s proteasome subunit (subunit α5; Boston Biochem).
Extracellular field potential recordings.
At 3 weeks after the last daily cocaine (N = 8) or saline (N = 7) injection, the rats were anesthetized with urethane (1.5 g/kg, i.p.), and mounted in a stereotaxic apparatus (Narishige). Subcutaneous atropine methylbromide (0.3 mg/kg) was used to minimize secretions and improve ventilation as needed, and core temperature was maintained using a heating pad. Baseline field potentials were collected in the core compartment of the nucleus accumbens (NAcore) for 30 min after electrode placement (see below). After the baseline measurements were obtained, all animals were injected with cocaine (30 mg/kg, i.p.). Field potential amplitude was estimated as the difference between the mean of a 2–4 ms window before the stimulation artifact and the mean of a 1 ms window ∼15 ms after the stimulation artifact (corresponding to the negative peak of the field potential). Data were then normalized to baseline.
The stimulation of prefrontal cortex and recording of field potentials in the NAcore has been described in detail previously (Moussawi et al., 2009). In brief, concentric bipolar stimulating electrodes (Rhodes Medical Instruments) were placed in the prelimbic medial prefrontal cortex [anteroposterior (AP), +3.0 mm; mediolateral (ML), +0.6 mm; dorsoventral (DV), −3.3 mm from brain surface]. Glass recording electrodes were pulled using a Narishige PE-2 puller (1–2 MΩ). Filling solution consisted of 0.5 m sodium acetate and 2% pontamine sky blue. Recording electrodes were aimed at the dorsomedial region of the nucleus accumbens (AP, +1.8 mm; ML, +1.3–1.5 mm; DV, −5.5 to −6.0 mm from brain surface). The preparation was further stabilized with agar. Extracellular field potentials were amplified by a NPI Instruments SEC-05LX amplifier, and the data bandpass filtered at 300 Hz, then digitized by a National Instruments PCM-C1016E4 board feeding into a computer. Custom Labview Software (Lee Campbell, Salk Institute, La Jolla, CA) was used for data collection and analysis. To ensure the accuracy and stability of the recordings, baseline measurements were obtained 1 h after surgery. Data were collected every 100 s, at a 10 kHz sampling frequency, and then averaged every 5 min. Pulse width was set to 0.3 ms, and basal stimulation intensity corresponded to 40% of the minimum current intensity that evoked a maximum field response.
Confocal imaging and quantification of dendritic spines.
Rats were treated with daily cocaine (N = 33) or daily saline (N = 29) and at 3 weeks of withdrawal were deeply anesthetized with ketamine HCl (87.5 mg/kg, i.p.) and xylazine (5 mg/kg, i.p.). Transcardial perfusion (35 ml/min) with 0.1 m sodium phosphate buffer (PB), was followed by 300 ml of 1.5% paraformaldehyde (PFA) in 0.1 m PB. Brains were removed and postfixed in the same fixative for 1 h, then were coronally sectioned (150 μm thick) using a vibratome at room temperature. Animals were divided into different groups of N = 2–5 according to different times before and after acute cocaine (30 mg/kg, i.p.) administration (see above).
Diolistic labeling.
Tungsten particles (1.3 μm diameter, Bio-Rad) were coated with the lipophilic carbocyanine dye DiI (Invitrogen). DiI-coated particles were delivered diolistically into the tissue at 80 psi using a Helios Gene Gun system (Bio-Rad) fitted with a polycarbonate filter with 3.0 μm pore size (BD Biosciences). DiI was allowed to diffuse along neuron dendrites and axons in PBS containing 0.01% (w/v) thimerosal for 48 h at 4°C, and then labeled sections were fixed again in 4% PFA for 1 h. After brief washing in PBS, tissues were mounted onto subbed slides in aqueous medium Prolong (Invitrogen).
Confocal imaging and three-dimensional reconstructions.
A Zeiss LSM 510 confocal microscope was used to image the labeled sections. DiI was excited using the Helium/Neon 543 nm laser line. The entire profile of each DiI-positive neuron to be quantified was acquired using a 63× oil-immersion objective without optical zoom (Plan-Apochromat, Zeiss; NA = 1.4, WD = 90 μm), using a frame size of 512 × 512 pixels which generated an image with field size 146.25 × 146.25 μm and pixel scale 0.29 × 0.29 μm. The neuron was scanned at 1 μm intervals along the z-axis (maximum 90 planes, depending on the depth of whole neuron and objective WD), and the topology of the dendritic tree was reconstructed in three dimensions. Subsequently, to acquire sufficient resolution to conduct spine counting and measurement of head diameter as described below, the frame size was increased to 2048 × 2048 pixels which generated a pixel size 0.07 × 0.07 μm. The dendrite within the frame was cropped (75–200 μm range) according to the extent of dendrite that was clearly connected to the soma of interest and fully separable from crossing dendrites. The cropped dendrite was scanned at 0.1 μm intervals along the z-axis (maximum 200 planes, depending on the depth of the dendrite) using the same objective. A final high-definition three-dimensional image of spines was achieved via reconstructing these consecutive scans using Zeiss LSM image browser.
Measurement of spine density and size.
For quantitative analysis, a three-dimensional perspective was rendered by the Surpass module of Imaris software package (Version 5.5, Bitplane), and has been described in detail previously (Shen et al., 2008). Only cells localized to the NAcore were quantified, and spine quantification commenced on dendrites beginning at >75 μm distal to the soma, and after the first branch point. Measurements were made out to a maximum of 200 μm from the soma, and the length of dendrite quantified was 40–55 μm. For each neuron, 1–4 dendrites were analyzed. When >1 dendrite was measured the values were averaged within each individual neuron. For each of 2–5 animals examined at each time point, at least 8 neurons were analyzed from a single dye injection site. A protocol based on Filament module of IMARIS software was used that quantifies spine density and head diameter (Shen et al., 2008). The minimum end segment diameter (spine head) was set at ≥0.143 μm (i.e., the thinnest quantifiable spines were 0.143 μm in diameter). Fluorescence in each dendritic segment quantified was thresholded manually such that all visually discernible protuberances in three dimensions were identified. Rarely, fluorescence was unevenly distributed in a segment of dendrite making it impossible to accurately threshold the fluorescence and this segment was not included in the analysis. Fluorescence contrast threshold was set at ≥3 [calculated as (mean luminance small diameter − mean luminance large diameter)/SD luminance of large diameter)], which was sufficient contrast to readily identify all fluorescent edges. The ratio of branch length to trunk radius was ≥1.5, and the branch length had to be >0.5 μm.
Verification by manual counting and Golgi staining.
To compare the automated measurements to more traditional manual counting, spines were counted by hand from 20–56 μm long dendritic segments using two different protocols. For counting of DiI-filled MSNs, counts were made by rotating the segment in three dimensions to be able to quantify spines in the z-axis. Moreover, as spines were counted, they were separated into spine heads > or ≤ 0.2 μm in diameter. After manual counting, spines along the same segment of dendrite were estimated for density and head diameter using the automated method. Spines from DiI-filled cells were also manually quantified in two dimensions by collapsing the Z stack to be compared with two-dimensional quantification of Golgi-stained spines.
For Golgi staining, rats were perfused through the aorta with 0.5% procaine, 2.5% sucrose and 0.81% NaCl in 0.01 Sorensond phosphate buffer (SPB, pH 7.4), followed by 300 ml of 0.1 m SPB, pH 7.4, SPB 0.1 m containing 2% glutaraldehyde, 1% paraformaldehyde and 2.5% sucrose. The brains were sectioned with a vibratome (50 μm thick), and the sections rinsed in SBP and immersed in 1% osmium tetroxide in 0.1 m SPB, pH 7.4, for 30 min at 4°C. Subsequently, the sections were immersed in 3.5% potassium dichromate for 4 h. The sections were then mounted on slides and immersed overnight in 1.5% aqueous AgNO3. The following morning sections were coverslipped in 100% glycerol. Images used for quantification were captured using a 63× water-immersion objective (Plan-Apochromat, Leica; NA = 1.2, WD = 220 μm) on a Leica DMRXA microscope via OpenLab image processing software (Improvision). To accurately assess spine density and dh, each spine was captured in its optimal focal plane on a high-resolution monitor, and measured by the OpenLab calibration tool.
Histology.
To determine the location of the recording electrode, Pontamine sky blue (2%, 50 μA negative current for 5 min) was used to mark the recording site at the end of each recording session. Animals in the electrophysiological study were then transcardially perfused with 10% formalin, brains sectioned with a vibratome (50 μm thick) and the slices stained with cresyl violet (see Moussawi et al., 2009, for example of electrode placement in the prefrontal cortex and NAcore).
Group design and statistics.
All spine density and diameter data were statistically analyzed by averaging the values for all the neurons counted in each animal. Thus for statistical analysis the number of determinations per group ranged from 2 to 5. The anatomical data were statistically analyzed using a one- or two-way ANOVA. For comparing baseline protein values (before a cocaine challenge injection) the data were normalized to the chronic saline values and compared using a two-tailed Student's t test. For comparing the time course of protein change induced by a cocaine challenge within each chronic treatment group the data were normalized to the respective baseline values in each chronic group and analyzed using a one-way ANOVA. The electrophysiological data were normalized to baseline field amplitude in each chronic treatment group and evaluated using a two-way ANOVA with repeated measures over time. Post hoc tests were conducted using a Dunnett's test for comparison to a single control group, a Bonferroni test or a LSD test for repeated measures ANOVA (Milliken and Johnson, 1984).
Results
Withdrawal from daily cocaine changes spine head diameter
Figure 1 illustrates an example of a MSN labeled with the lipophilic dye, DiI, and shows how a segment of dendrite was rendered and both spine density and dh quantified (Fig. 1B,C). The spine density measured using this method, 2.6 spines/μm (Fig. 2A), was higher than is generally reported using Golgi staining or by filling MSNs with green fluorescent protein that in the NAcore ranges from 0.8–1.2 spines/μm (Robinson et al., 2001; Kolb et al., 2003; Robinson and Kolb, 2004; Ferrario et al., 2005; Chen et al., 2008; Pulipparacharuvil et al., 2008; but see Norrholm et al., 2003), as well as supplemental Table S1 (available at www.jneurosci.org as supplemental material, for comparisons between studies). In part the higher density of spines measured in the present study is due to the fact that in previous studies spines in NAcore MSNs were quantified in 2 dimensions (Feldman and Peters, 1979; Gioia et al., 1998; Gan et al., 2000). However, Figure 1E reveals that even if the Z stack was collapsed and DiI-labeled dendrites quantified in 2 dimensions, spine density was higher in DiI-labeled compared with Golgi-stained dendrites (one-way ANOVA F(2,52) = 85.62, p < 0.001). Figure 1D also shows that this difference in density may result from identifying fewer spines with small spine head diameter (dh ≤0.3 μm) in Golgi impregnated compared with DiI labeled MSNs (two-way ANOVA with labeling method and head diameter as factors; interaction F(4,123) = 97.65, p < 0.001).
Figure 1.

Rendering and quantification of a confocal image of a diolistically labeled DiI filled dendrite segment from an MSN. A, DiI-filled neuron in the NAcore. The arrow and box identify segment of dendrite rendered in B–D. Grid is in micrometers. *Axon; open arrowhead, soma. B, Panel B1 shows a confocal image of the dendrite segment indicated in A, and B2 shows filling of the dendrite using the Filament module in the IMARIS software package. Green identifies the end segment of each spine where the estimate of dh was made. C, Higher magnification of the boxed region in B. *Thin filopodia-like spines (dh ≤ 0.2 μm). D, Representative light micrograph of Golgi-stained dendrite and confocal image of DiI-labeled dendrite. E, Comparison of spine density and dh between Golgi impregnated and DiI-labeled dendritic spines. The number of neurons quantified is shown in the bars in the right panel. *p < 0.05 comparing DiI with Golgi staining using a Bonferroni post hoc test.
Figure 2.
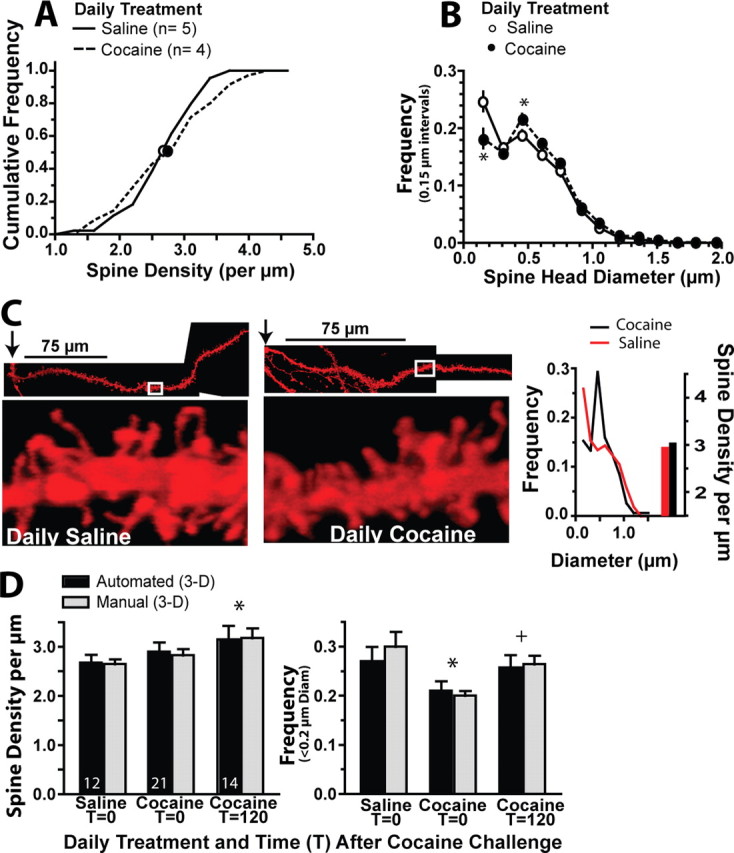
Withdrawal from daily cocaine increases dh without affecting the density of dendritic spines in NAcore MSNs. A, Cumulative frequency plot of spine density after withdrawal from chronic cocaine versus saline administration. B, The dh distribution was altered after withdrawal from daily cocaine. *p < 0.05 comparing cocaine and saline using a Bonferroni post hoc. C, Examples of a dendrite from a spiny cell in a daily saline and daily cocaine-withdrawn animal illustrating the relatively larger dh after daily cocaine. Arrow, Location of soma. Also shown is the spine analysis of each dendrite segment. D, Comparison of spine density and frequency of dh ≤ 0.2 μm between manual and automated counting three-dimensional quantification of DiI-filled spines. Number of neurons counted is shown in each bar. *p < 0.05 compared with Saline T = 0 using a Bonferroni post hoc test. +p < 0.05 comparing Cocaine at T = 0 with Cocaine at T = 120.
Figure 2A shows that no difference in mean spine density was measured between the chronic cocaine and saline treatment groups (two-tailed t test t(7) = 0.43, p = 0.679). This was surprising because previous studies found an increase in spine density in the NAcore after chronic cocaine administration (Norrholm et al., 2003; Robinson and Kolb, 2004; Ferrario et al., 2005; Lee et al., 2006; Chen et al., 2008; Pulipparacharuvil et al., 2008). It is possible that different aspects of the treatment protocols between this study and previous studies may contribute to the different density measurements, such as drug treatment environment, dose of cocaine and withdrawal period (Robinson and Kolb, 2004). Alternatively, the difference may result from more relatively thin spines being identified in DiI-labeled neurons (see above). Supporting the latter interpretation, Figure 2B shows that if neurons were parsed according to the distribution of spine head diameters (dh), withdrawal from daily cocaine was associated with an increased density of larger diameter spines (dh = 0.35–0.5 μm), and reduced density of thinner spines (dh ≤0.2 μm) (two-way ANOVA with frequency and chronic treatment group as factors, interaction F(12,91) = 3.44, p < 0.001). Thus, if predominantly larger diameter spines were identified in previous studies the present data replicate earlier experiments by showing an increase in the density of spines with dh ≥0.35 μm after withdrawal from chronic cocaine. Figure 2C provides examples of equivalent dendrite segments that illustrate the higher proportion of thicker dendritic spines in the chronic cocaine-withdrawn animals. Importantly, both the total spine density and reduction in spines with dh ≤0.2 μm in MSNs from daily cocaine versus saline-withdrawn animals were verified by manual spine counts (Fig. 2D).
Cocaine challenge alters spine morphology after withdrawal from chronic cocaine
After 3 weeks of withdrawal from daily cocaine or saline, acute cocaine was injected and dendritic spine morphology was determined at various times after injection. Figure 3A shows that a cocaine challenge administered to cocaine-withdrawn subjects significantly increased spine density at 120 min after cocaine administration (one-way ANOVA F(5,21) = 4.70, p = 0.008). In contrast, after withdrawal from daily saline an elevation in spine density was present at 360 min after a cocaine challenge injection (one-way ANOVA F(4,19) = 3.23, p = 0.042).
Figure 3.

Acute cocaine administration (30 mg/kg, i.p.) reveals plasticity in dendritic spines after withdrawal from daily cocaine. A, The density of dendritic spines was elevated after acute cocaine in cocaine-withdrawn and saline-withdrawn animals. N = 2–5. *p < 0.05 compared with time = 0 min using a Dunnett's post hoc test. B, The distribution of dh at different times after acute cocaine administration obtained from the same neurons shown in A. N is shown in the legend. *p < 0.05 comparing all times to time 0 (before cocaine challenge) within each diameter bin using a Bonferroni post hoc test. C, The relative distribution of spines with 0.2 ≥ dh ≥ 0.35 μm. D, Examples of changes in dendritic spines at 45 and 120 min after cocaine in daily cocaine-withdrawn animals. E, Examples of changes in dendritic spines at 360 min after cocaine in daily saline animals. F, Quantification of the samples shown in D (Coc) and E (Sa).
The changes in spine density were accompanied by a pronounced effect on dh in daily cocaine-withdrawn animals. Figure 3B shows that although an acute cocaine challenge in daily saline-withdrawn animals did not affect dh over the first 24 h after injection (Fig. 3B1; two-way ANOVA with time of killing and frequency as factors revealed no effect of time or interaction), in daily cocaine-withdrawn subjects the cocaine challenge induced a biphasic change in dh over time after injection (Fig. 3B2; interaction F(60,180) = 4.99, p < 0.001). Thus, acute cocaine induced a reduction in spines with dh ≤0.2 μm by 45 min after injection in cocaine-withdrawn animals, and a corresponding increase in spines with larger head diameter dh = 0.65 μm. However, by 120 min after injection, the distribution reversed with a significant elevation in dh ≤0.2 μm. The biphasic change in spine morphology induced by acute cocaine in daily cocaine-withdrawn animals can be readily in Figure 3C that shows the data from Figure 3B2 collapsed over thin (dh ≤0.2 μm) and thick (dh ≥0.35 μm) spines. To verify that the injection procedure did not elicit the changes in spine density and/or dh shown in Figure 3, B and C, dendritic spines were quantified in daily saline and daily cocaine-withdrawn animals at 360 and 45 min, respectively, after an acute saline injection. Supplemental Figure S2, available at www.jneurosci.org as supplemental material, shows that the saline challenge injection did not alter spine density or dh in either daily cocaine or daily saline-withdrawn subjects. Figure 3, D and F, shows individual segments of dendrite from spiny cells illustrating the relatively thicker spines at 45 min and the increase in thin spines at 120 min after cocaine injection in chronic cocaine subjects. Figure 3, E and F, shows an example of increased spine density at 360 min after cocaine in chronic saline animals. Finally, Figure 2D shows verification by manual counting of the increase in dh ≤0.2 μm and spine density at 120 min (T = 120) after injection of acute cocaine in daily cocaine-withdrawn animals (e.g., compare T = 120 with T = 0).
Proteins in the PSD subfraction associated with plasticity in spine morphology
To determine whether changes in dendritic proteins paralleled spine plasticity, the nucleus accumbens (containing both the shell and core subcompartments) was dissected at different times after a cocaine challenge injection into animals withdrawn for 3 weeks from daily cocaine or saline. Figure 4A shows that withdrawal from chronic cocaine without a cocaine challenge (T = 0) was associated with increased levels of filamentous (F)-actin and reduced levels of Arp3 and Lim-kinase (LIMK) phosphorylation of cofilin (p-cofilin).
Figure 4.

Withdrawal from daily cocaine results in acute cocaine inducing a different pattern of proteins in the subfraction of accumbens tissue containing the PSD. A, Basal differences in proteins between daily saline and daily cocaine-withdrawn subjects before injecting acute cocaine. Data were normalized to the saline values, and the open bars indicate a p < 0.05 difference between daily cocaine and saline treatment groups using a Student's t test. B, Examples of blots showing effects of daily cocaine (0) versus daily saline (Sa-0) groups before injection of cocaine and changes induced at different times after acute cocaine administration in daily cocaine-withdrawn animals (10, 45, 120, and 360 min). C, D, Effect of acute cocaine administration (30 mg/kg i.p.) on actin binding proteins (C) or PSD proteins associated with glutamate receptors or PSD structure (D). Data were normalized to percentage change from time = 0 in each daily cocaine or saline treatment group. The SEM is shown only when there was a p < 0.05 (*) difference compared with T = 0 using a one-way ANOVA followed by a Dunnett's test.
Akin to spine morphology, Figure 4, B–D, shows that the effect of acute cocaine on PSD proteins in the nucleus accumbens was different between daily cocaine and saline-withdrawn animals. See supplemental Tables S2 and S3, available at www.jneurosci.org as supplemental material, for ANOVA results on changes in protein content. As predicted by the increase in spine density shown in Figure 3A at 360 min after injection of cocaine in daily saline-withdrawn animals, Figure 4, C and D, shows a marked elevation in actin binding proteins (Fig. 4C) and PSD proteins associated with NMDA receptors (Fig. 4D) in parallel with the increase in spine density. The profile of protein changes is compatible with actin remodeling and the formation of functional synapses. Thus, the NMDA scaffolding protein PSD-95 and the NMDA receptor subunits, NMDAR1 and NMDAR2a were elevated (Fig. 4D). The increases in Rab11, a marker for exocytotic endosomal recycling (Brown et al., 2007), and in the 20 s subunit of the proteasome supports the increased protein turnover necessary for spine formation (Patrick, 2006). Also, the increase in p-cofilin relative to cofilin and the elevation in Arp3 indicate reduced F-actin disassembly and increased F-actin branching, respectively (Ono, 2003; Pollard, 2007). Finally, the increase in β-catenin supports the possibility that the new spines were forming synaptic contacts (Arikkath and Reichardt, 2008).
The changes in spine morphology during the first 2 h after cocaine in daily cocaine-withdrawn animals were associated with a different profile of PSD proteins compared with control subjects. Most obvious was the lack of increase in PSD-95 or the NMDA receptor subunits, implying that the increase in spine density was not associated with a parallel increase in functional PSD and capacity for glutamate signaling. Indeed, at 120 min after injection the level of NR2a was reduced and the lack of elevation in Rab11 supports the lack of protein delivery to the spine (Brown et al., 2007).
The profile of changes in actin binding proteins was consistent with a lack of coordinated change in the levels NMDA associated proteins in the PSD subfraction and spine morphology. Thus, at 45 min after injection the marked increase in dh (Fig. 3B) was not accompanied by increases in any actin binding proteins except Arp3. By 120 min after acute cocaine injection into cocaine-withdrawn subjects, spine density was elevated and there was a dramatic reversal of dh such that spines with dh≤0.2 increased relative to dh ≥ 0.35 μm (Fig. 3B). Notably, these changes in spine morphology at 120 min were associated with elevated cofilin, and a lack of increase in p-cofilin and p-LIMK. Elevated cofilin promotes the disassembly of F-actin (Ono, 2003) and spine retraction (Zhou et al., 2007). Correspondingly, actin levels in the PSD were reduced and the 20 s subunit of the proteasome increased at 120 min after cocaine administration. By 360 min after cocaine all proteins except actin and NMDAR2A had returned to basal levels in parallel with the restoration of basal levels of spine density and dh (Fig. 3A,B).
Increased field amplitude parallels increased spine density in control, not cocaine animals
Increased spine density and dh have been associated with augmented signaling at excitatory synapses (e.g., long-term potentiation, LTP), whereas reductions are associated with LTD (Zhou et al., 2004; De Roo et al., 2008). Accordingly, the functional status of glutamate transmission was evaluated using in vivo stimulation of the PFC to induce field potentials in the NAcore. Consistent with previous in vitro reports (Nicola et al., 1996), Figure 5A shows that acute cocaine administration reduced field potential amplitude in both daily saline and cocaine-withdrawn subjects during the first 120 min after injection (two-way ANOVA with repeated measures over time, treatment F(1,13) = 6.66, p = 0.022, time F(72,72) = 3.00, p < 0.001, interaction F(72,936) = 2.88, p < 0.001). However, after acute cocaine in control animals, field potential amplitude increased and became greater than baseline by 240 min for the duration of the 6 h experiment, whereas in daily cocaine-withdrawn subjects field amplitude never returned to the preinjection baseline. Figure 5C shows input/output curves obtained immediately before injecting cocaine (time = 0) and at 120 and/or 360 min after injection, confirming the LTP-like increase in field amplitude in control animals that was predicted by the increase in spine density and PSD proteins at 360 min after injection (two-way ANOVA with repeated measures over time, time F(1,7) = 34.89, p < 0.001, current F(7,7) = 95.17, p < 0.001, interaction F(7,56) = 2.40, p = 0.032). In contrast, in chronic cocaine-withdrawn animals an acute cocaine injection elicited LTD-like reductions in field amplitude at 120 and 360 min (time F(2,14) = 38.77, p < 0.001; current F(7,14) = 50.25, p < 0.001).
Figure 5.

Field potentials evoked in the NAcore induced by stimulating the prefrontal cortex indicates that withdrawal from daily cocaine dissociates field strength from the increase in spine density and diameter induced by acute cocaine. A, Field amplitude normalized to baseline and quantified for 6 h after cocaine challenge (30 mg/kg i.p.). Data are shown as mean ± SEM field potential for each 5 min after injecting cocaine. B, Sample field potentials obtained before (0 min) and at different times after cocaine administration corresponding to the time points where dendritic spines and PSD proteins were quantified. C, Input/output curves conducted at baseline (time = 0) and at 120 and/or 360 min after cocaine when dendritic spine density was elevated. *p < 0.05 comparing time 0–360 min using an LSD post hoc test (Milliken and Johnson 1984). +p < 0.05 comparing time 0–120 min.
Discussion
Repeated cocaine administration induces enduring changes in excitatory transmission in the nucleus accumbens that are thought to underpin addiction in humans and the dysregulation of behavior in experimental animals (Koob and LeMoal, 2001; Hyman et al., 2006; Kalivas and O'Brien, 2008). The fact that dysregulated behavior elicited by a subsequent cocaine injection defines many animal models of addiction (Robinson and Berridge, 1993; Shalev et al., 2002) underscores the importance of characterizing how the neuroplasticity elicited by withdrawal from repeated cocaine administration alters the subsequent plasticity elicited by an acute cocaine challenge. The neuroplasticity present after withdrawal from repeated cocaine may be a form of metaplasticity in that it alters the effect of a subsequent cocaine injection on excitatory transmission (Abraham, 2008). For example, withdrawal from cocaine is associated with changes in the capacity of an acute cocaine injection to increase glutamate release, the ratio of AMPA to NMDA currents and the surface expression of GluR1 in the nucleus accumbens (Pierce et al., 1996; Boudreau et al., 2007; Kourrich et al., 2007). In this report, potential metaplasticity was characterized using cocaine-induced changes in dendritic spine density and dh, PSD proteins, and NAcore field potentials evoked from the PFC. All three measures revealed cocaine metaplasticity because the effect of acute cocaine was distinct between daily cocaine and daily saline-withdrawn rats.
Neuroplasticity induced by acute cocaine in daily saline-withdrawn animals
Figure 6A illustrates the temporal pattern of morphological, proteomic and electrophysiological plasticity produced by a single acute cocaine injection in daily saline-pretreated animals. This included an increase in spine density that was accompanied by a coordinated increase in PSD proteins regulating the actin cytoskeleton (Arp3, p-cofilin, p-LIMK and F-actin itself), protein catabolism and trafficking (20 s subunit and Rab11), and glutamate receptor associated proteins (PSD-95, NMDAR1 and NMDAR2A). The parallel increases in protein and spine density are consistent with an increase in the number or function of glutamatergic synapses at 6 h after acute cocaine administration, a possibility further supported by an associated increase in the amplitude of field potentials driven by stimulating afferents from the prefrontal cortex. However, it is important to note that although these measures are consistent, to verify a possible increased presence of new synapses it is necessary to coimmunostain for presynaptic and postsynaptic markers of synaptic contacts in DiI-filled spines.
Figure 6.

Summary of the plasticity induced by an acute cocaine injection in animals withdrawn from daily cocaine or saline treatments. The illustration is not a drawing of a biological sample but provides a generalized view of how spine morphology is altered by withdrawal from daily cocaine or saline and a subsequent acute cocaine challenge. A, In daily saline-withdrawn animals, the only effect occurred after 360 min after acute cocaine administration and consisted of a coordinated increase in spine density PSD proteins and amplitude of field potentials elicited by prefrontal cortex stimulation. B, In daily cocaine-withdrawn subjects, acute cocaine elicited rapid bidirectional changes in spine morphology over the first 2 h after acute cocaine injection that were associated with a reduction in field amplitude. Actin binding proteins revealed an increase in branching and gradual decrease in actin content due to increases in cofilin. Although spine morphology appeared to normalize by 360 min after injection, the continued reduction in actin and NMDA2A was paralleled by an enduring decrease in field amplitude. —, No change; up arrow, increase; down arrow, decrease; arrow with line, strong trend toward change.
Importantly, the neuroadaptations were absent by 24 h after injection. The relevance of such transient plasticity in cocaine addiction is not clear, but may contribute to a sequence of changes initiated by the acute cocaine administration that contributes toward establishing the metaplasticity and dysregulated cocaine-induced behavior that emerges after withdrawal from repeated cocaine administration. The notion is widely held that the sequence of adaptations initiated by acute cocaine-induced increases in dopamine may ultimately dysregulate behavior and contribute to the development of addiction (Koob and LeMoal, 2001; Jones and Bonci, 2005; Nestler, 2005). This perspective is based on studies showing that the induction of short- and intermediate-lived transcriptional regulators such as c-fos, NAC-1 and Homer 1a (Mackler et al., 2000; Szumlinski et al., 2006) is followed by relatively long-lived transcriptional regulators such as δ-fosB that accumulate with repeated administration (Nestler et al., 2001; Girault et al., 2007). Whether this sequential regulation of gene expression contributes to the neuroplasticity observed 6 h after acute cocaine administration or the development of cocaine metaplasticity remains to be determined.
Cocaine metaplasticity after withdrawal from chronic cocaine
In contrast to the coordinated neuroplasticity in the NAcore 6 h after acute cocaine in control animals, putative metaplasticity revealed by an acute cocaine injection in cocaine-withdrawn animals occurred with a different time course. Figure 6B illustrates that the acute cocaine-induced changes in spine morphology were relatively rapid in daily cocaine-withdrawn subjects, consisting of an increase in density by 120 min that was initially associated with increased dh at 45 min, but was followed by a marked reduction in dh at 120 min. Importantly, the increase in excitatory transmission that is often associated with increases in spine density and dh (De Roo et al., 2008) was not present during this period of dynamic spine morphology. Thus, increased spine density was not coupled with the same changes in PSD proteins and enhanced field potential amplitude that accompanied the acute cocaine-induced increase at 6 h in daily saline-withdrawn animals. For example, at 45 min when head diameter was enlarged, there was an increase only in Arp3. Although this is consistent with larger spine heads due to increased Arp3-mediated branching of F-actin (Pollard, 2007; De Roo et al., 2008; Wegner et al., 2008), there were no corresponding increases in other proteins expected to accompany an increase in dh of functional spines, such as F-actin or PSD-95. Even more striking was the rapid collapse of the spine heads between 45 and 120 min after injection that was accompanied by protein changes consistent with spine head shrinkage. Notably, there was a reduction in actin probably arising from the marked increase in cofilin that promotes F-actin disassembly (Pollard, 2007). The rise in cofilin was presumably facilitated by the previously reported downregulation of LIMK associated with withdrawal from repeated cocaine (Toda et al., 2006). This interpretation is supported by the fact that the rise in cofilin was not associated with elevations in p-cofilin or p-LIMK. Also consistent with collapsing spines, the level of NMDAR2A was reduced at 120 min. Finally, the 20 s subunit of the proteasome was elevated, indicative of increased protein degradation accompanying shrinking spine head diameter and possibly a result of a chronic cocaine-induced rise in NAC-1 that promotes translocation of the proteasome into the PSD (Shen et al., 2007). Surprisingly, the reduction in actin and PSD-95 at 120 min after acute cocaine administration was associated with an overall increase in the total protein content in the PSD subfraction (supplemental Fig. S3, available at www.jneurosci.org as supplemental material). This dissociation between reduced dh and total PSD may be related to an increase in PSD proteins that were not quantified. Also along these lines, PSD-95 and CaMKII are among the most abundant proteins in the PSD, and they did not increase in parallel with the increase in total PSD at 120 min after acute cocaine administration. Alternatively, the continued reduction in actin levels may indicate an alteration in spine morphology that was not quantified, such as a reduction in spine neck length.
Together, these data outline a portrait of withdrawal from daily cocaine inducing metaplasticity that results in an acute cocaine injection eliciting dynamic neuroplasticity. As outlined in Figure 6B, a biphasic change in spine head diameter during the first 120 min after injection was associated with a collapse of the actin cytoskeleton and an enduring reduction in the size of field potentials elicited from the prefrontal cortex that continued for 360 min in parallel with continued reductions in actin and NMDA2A.
It is important to broach two topics requiring clarification in future studies. (1) Although a variety of evidence points to an important role for NAcore MSNs in the behavioral and neurochemical consequences of daily cocaine administration (Kalivas and O'Brien, 2008), it will be interesting to determine whether MSNs in other striatal compartments show similar metaplasticity. Indeed, anatomical and electrophysiological data indicate that the daily cocaine-induced effects may be distinct between the NAcore and shell subcompartment of the accumbens (Robinson and Kolb, 2004; Martin et al., 2006). (2) MSNs differentially express D1 and D2 dopamine receptors, and repeated cocaine-induced changes in spine density appear to occur preferentially in the D1-expressing MSNs (Lee et al., 2006). It is unknown whether the metaplasticity described herein is preferential for D1-expressing neurons.
Conclusions
The capacity of chronic cocaine treatment to modify the behavioral response to subsequent cocaine administration is well characterized (Robinson and Berridge, 1993; Koob and LeMoal, 2001; Kalivas and O'Brien, 2008). Here we demonstrate that withdrawal from repeated cocaine is associated with metaplasticity in NAcore MSNs that is manifested by the induction of rapid changes in dendritic spine morphology in response to a subsequent acute cocaine challenge. Notably, the change in spine morphology was at least partly dissociated from expected elevations in PSD proteins and increases in field potential amplitude. Given the critical role played by glutamatergic transmission in the NAcore in animal models of addiction it seems likely that the metaplasticity associated with withdrawal from repeated cocaine administration may also be important in the dysregulated cocaine-induced behaviors manifested by cocaine addicts, such as cocaine-induced paranoia and relapse.
Footnotes
This work was supported by Grants DA 015369 and DA 003906 (P.W.K.) and a pilot grant from the Neurobiology of Addiction Research Center (S.T.), National Institute on Drug Addiction. We thank Drs. Dianna Neely and Ariel Deutch at Vanderbilt University for assistance in developing the diolistic labeling technique and Dr. Joyce Nicholas at the Medical University of South Carolina for assistance with statistical analysis.
References
- Abraham WC. Metaplasticity: tuning synapses and networks for plasticity. Nat Rev Neurosci. 2008;9:387–399. doi: 10.1038/nrn2356. [DOI] [PubMed] [Google Scholar]
- Abraham WC, Bear MF. Metaplasticity: the plasticity of synaptic plasticity. Trends Neurosci. 1996;19:126–130. doi: 10.1016/s0166-2236(96)80018-x. [DOI] [PubMed] [Google Scholar]
- Ahmed SH, Kenny PJ, Koob GF, Markou A. Neurobiological evidence for hedonic allostasis associated with escalating cocaine use. Nat Neurosci. 2002;5:625–626. doi: 10.1038/nn872. [DOI] [PubMed] [Google Scholar]
- Arikkath J, Reichardt LF. Cadherins and catenins at synapses: roles in synaptogenesis and synaptic plasticity. Trends Neurosci. 2008;31:487–494. doi: 10.1016/j.tins.2008.07.001. [DOI] [PMC free article] [PubMed] [Google Scholar]
- Boudreau AC, Wolf ME. Behavioral sensitization to cocaine is associated with increased AMPA receptor surface expression in the nucleus accumbens. J Neurosci. 2005;25:9144–9151. doi: 10.1523/JNEUROSCI.2252-05.2005. [DOI] [PMC free article] [PubMed] [Google Scholar]
- Boudreau AC, Reimers JM, Milovanovic M, Wolf ME. Cell surface AMPA receptors in the rat nucleus accumbens increase during cocaine withdrawal but internalize after cocaine challenge in association with altered activation of mitogen-activated protein kinases. J Neurosci. 2007;27:10621–10635. doi: 10.1523/JNEUROSCI.2163-07.2007. [DOI] [PMC free article] [PubMed] [Google Scholar]
- Brown TC, Correia SS, Petrok CN, Esteban JA. Functional compartmentalization of endosomal trafficking for the synaptic delivery of AMPA receptors during long-term potentiation. J Neurosci. 2007;27:13311–13315. doi: 10.1523/JNEUROSCI.4258-07.2007. [DOI] [PMC free article] [PubMed] [Google Scholar]
- Chen Q, Xiong X, Lee T, Liu TJ, Wetsel W, Zhang X. Neural plasticity and addiction: integrin-linked kinase and cocaine behavioral sensitization. J Neurochem. 2008;107:679–689. doi: 10.1111/j.1471-4159.2008.05619.x. [DOI] [PubMed] [Google Scholar]
- Conrad KL, Tseng KY, Uejima JL, Reimers JM, Heng LJ, Shaham Y, Marinelli M, Wolf ME. Formation of accumbens GluR2-lacking AMPA receptors mediates incubation of cocaine craving. Nature. 2008;454:118–121. doi: 10.1038/nature06995. [DOI] [PMC free article] [PubMed] [Google Scholar]
- De Roo M, Klauser P, Garcia PM, Poglia L, Muller D. Spine dynamics and synapse remodeling during LTP and memory processes. Prog Brain Res. 2008;169:199–207. doi: 10.1016/S0079-6123(07)00011-8. [DOI] [PubMed] [Google Scholar]
- Feldman ML, Peters A. A technique for estimating total spine numbers on Golgi-impregnated dendrites. J Comp Neurol. 1979;188:527–542. doi: 10.1002/cne.901880403. [DOI] [PubMed] [Google Scholar]
- Ferrario CR, Gorny G, Crombag HS, Li Y, Kolb B, Robinson TE. Neural and behavioral plasticity associated with the transition from controlled to escalated cocaine use. Biol Psychiatry. 2005;58:751–759. doi: 10.1016/j.biopsych.2005.04.046. [DOI] [PubMed] [Google Scholar]
- Gan WB, Grutzendler J, Wong WT, Wong RO, Lichtman JW. Multicolor “DiOlistic” labeling of the nervous system using lipophilic dye combinations. Neuron. 2000;27:219–225. doi: 10.1016/s0896-6273(00)00031-3. [DOI] [PubMed] [Google Scholar]
- Gioia M, Tredici G, Bianchi R. Dendritic arborization and spines of the neurons of the cat and human periaqueductal gray: a light, confocal laser scanning, and electron microscope study. Anat Rec. 1998;251:316–325. doi: 10.1002/(SICI)1097-0185(199807)251:3<316::AID-AR6>3.0.CO;2-T. [DOI] [PubMed] [Google Scholar]
- Girault JA, Valjent E, Caboche J, Hervé D. ERK2: a logical AND gate critical for drug-induced plasticity? Curr Opin Pharmacol. 2007;7:77–85. doi: 10.1016/j.coph.2006.08.012. [DOI] [PubMed] [Google Scholar]
- Hyman SE, Malenka RC, Nestler EJ. Neural mechanisms of addiction: the role of reward-related learning and memory. Annu Rev Neurosci. 2006;29:565–598. doi: 10.1146/annurev.neuro.29.051605.113009. [DOI] [PubMed] [Google Scholar]
- Jones S, Bonci A. Synaptic plasticity and drug addiction. Curr Opin Pharmacol. 2005;5:20–25. doi: 10.1016/j.coph.2004.08.011. [DOI] [PubMed] [Google Scholar]
- Kalivas PW, O'Brien C. Drug addiction as a pathology of staged neuroplasticity. Neuropsychopharmacology. 2008;33:166–180. doi: 10.1038/sj.npp.1301564. [DOI] [PubMed] [Google Scholar]
- Kolb B, Gorny G, Li Y, Samaha AN, Robinson TE. Amphetamine or cocaine limits the ability of later experience to promote structural plasticity in the neocortex and nucleus accumbens. Proc Natl Acad Sci U S A. 2003;100:10523–10528. doi: 10.1073/pnas.1834271100. [DOI] [PMC free article] [PubMed] [Google Scholar]
- Koob GF, Le Moal M. Drug addiction, dysregulation of reward and allostasis. Neuropsychopharmacology. 2001;24:97–129. doi: 10.1016/S0893-133X(00)00195-0. [DOI] [PubMed] [Google Scholar]
- Kourrich S, Rothwell PE, Klug JR, Thomas MJ. Cocaine experience controls bidirectional synaptic plasticity in the nucleus accumbens. J Neurosci. 2007;27:7921–7928. doi: 10.1523/JNEUROSCI.1859-07.2007. [DOI] [PMC free article] [PubMed] [Google Scholar]
- Lee KW, Kim Y, Kim AM, Helmin K, Nairn AC, Greengard P. Cocaine-induced dendritic spine formation in D1 and D2 dopamine receptor-containing medium spiny neurons in nucleus accumbens. Proc Natl Acad Sci U S A. 2006;103:3399–3404. doi: 10.1073/pnas.0511244103. [DOI] [PMC free article] [PubMed] [Google Scholar]
- Mackler SA, Korutla L, Cha XY, Koebbe MJ, Fournier KM, Bowers MS, Kalivas PW. NAC-1 is a brain POZ/BTB protein that can prevent cocaine-induced sensitization in the rat. J Neurosci. 2000;20:6210–6217. doi: 10.1523/JNEUROSCI.20-16-06210.2000. [DOI] [PMC free article] [PubMed] [Google Scholar]
- Martin M, Chen BT, Hopf FW, Bowers MS, Bonci A. Cocaine self-administration selectively abolishes LTD in the core of the nucleus accumbens. Nat Neurosci. 2006;9:868–869. doi: 10.1038/nn1713. [DOI] [PubMed] [Google Scholar]
- Milliken GA, Johnson DE. Belmont, CA: Lifetime Learning Publications; 1984. Analysis of messy data. Volume I: Designed experiments. [Google Scholar]
- Moussawi K, Pacchioni A, Moran M, Olive MF, Gass JT, Lavin A, Kalivas PW. N-acetylcysteine reverses cocaine induced metaplasticity. Nat Neurosci. 2009;12:182–189. doi: 10.1038/nn.2250. [DOI] [PMC free article] [PubMed] [Google Scholar]
- Nestler EJ. Is there a common molecular pathway for addiction? Nat Neurosci. 2005;8:1445–1449. doi: 10.1038/nn1578. [DOI] [PubMed] [Google Scholar]
- Nestler EJ, Barrot M, Self DW. DeltaFosB: a sustained molecular switch for addiction. Proc Natl Acad Sci U S A. 2001;98:11042–11046. doi: 10.1073/pnas.191352698. [DOI] [PMC free article] [PubMed] [Google Scholar]
- Nicola SM, Kombian SB, Malenka RC. Psychostimulants depress excitatory synaptic transmission in the nucleus accumbens via presynaptic D1-like dopamine receptors. J Neurosci. 1996;16:1591–1604. doi: 10.1523/JNEUROSCI.16-05-01591.1996. [DOI] [PMC free article] [PubMed] [Google Scholar]
- Norrholm SD, Bibb JA, Nestler EJ, Ouimet CC, Taylor JR, Greengard P. Cocaine-induced proliferation of dendritic spines in the nucleus accumbens is dependent on the activity of cyclin-dependent kinase-5. Neuroscience. 2003;116:19–22. doi: 10.1016/s0306-4522(02)00560-2. [DOI] [PMC free article] [PubMed] [Google Scholar]
- Ono S. Regulation of actin filament dynamics by actin depolymerizing factor/cofilin and actin-interacting protein 1: new blades for twisted filaments. Biochemistry. 2003;42:13363–13370. doi: 10.1021/bi034600x. [DOI] [PubMed] [Google Scholar]
- Patrick GN. Synapse formation and plasticity: recent insights from the perspective of the ubiquitin proteasome system. Curr Opin Neurobiol. 2006;16:90–94. doi: 10.1016/j.conb.2006.01.007. [DOI] [PubMed] [Google Scholar]
- Pierce RC, Bell K, Duffy P, Kalivas PW. Repeated cocaine augments excitatory amino acid transmission in the nucleus accumbens only in rats having developed behavioral sensitization. J Neurosci. 1996;16:1550–1560. doi: 10.1523/JNEUROSCI.16-04-01550.1996. [DOI] [PMC free article] [PubMed] [Google Scholar]
- Pollard TD. Regulation of actin filament assembly by Arp2/3 complex and formins. Annu Rev Biophys Biomol Struct. 2007;36:451–477. doi: 10.1146/annurev.biophys.35.040405.101936. [DOI] [PubMed] [Google Scholar]
- Pulipparacharuvil S, Renthal W, Hale CF, Taniguchi M, Xiao G, Kumar A, Russo SJ, Sikder D, Dewey CM, Davis MM, Greengard P, Nairn AC, Nestler EJ, Cowan CW. Cocaine regulates MEF2 to control synaptic and behavioral plasticity. Neuron. 2008;59:621–633. doi: 10.1016/j.neuron.2008.06.020. [DOI] [PMC free article] [PubMed] [Google Scholar]
- Robinson TE, Berridge KC. The neural basis of drug craving: an incentive-sensitization theory of addiction. Brain Res Rev. 1993;18:247–291. doi: 10.1016/0165-0173(93)90013-p. [DOI] [PubMed] [Google Scholar]
- Robinson TE, Kolb B. Structural plasticity associated with exposure to drugs of abuse. Neuropharmacology. 2004;47(Suppl 1):33–46. doi: 10.1016/j.neuropharm.2004.06.025. [DOI] [PubMed] [Google Scholar]
- Robinson TE, Gorny G, Mitton E, Kolb B. Cocaine self-administration alters the morphology of dendrites and dendritic spines in the nucleus accumbens and neocortex. Synapse. 2001;39:257–266. doi: 10.1002/1098-2396(20010301)39:3<257::AID-SYN1007>3.0.CO;2-1. [DOI] [PubMed] [Google Scholar]
- Shalev U, Grimm JW, Shaham Y. Neurobiology of relapse to heroin and cocaine seeking: a review. Pharmacol Rev. 2002;54:1–42. doi: 10.1124/pr.54.1.1. [DOI] [PubMed] [Google Scholar]
- Shen H, Korutla L, Champtiaux N, Toda S, LaLumiere R, Vallone J, Klugmann M, Blendy JA, Mackler SA, Kalivas PW. NAC1 regulates the recruitment of the proteasome complex into dendritic spines. J Neurosci. 2007;27:8903–8913. doi: 10.1523/JNEUROSCI.1571-07.2007. [DOI] [PMC free article] [PubMed] [Google Scholar]
- Shen H, Sesack SR, Toda S, Kalivas PW. Automated quantification of dendritic spine density and spine head diameter in medium spiny neurons of the nucleus accumbens. Brain Struct Funct. 2008;213:149–157. doi: 10.1007/s00429-008-0184-2. [DOI] [PubMed] [Google Scholar]
- Swanson CJ, Baker DA, Carson D, Worley PF, Kalivas PW. Repeated cocaine administration attenuates group I metabotropic glutamate receptor-mediated glutamate release and behavioral activation: a potential role for Homer 1b/c. J Neurosci. 2001;21:9043–9052. doi: 10.1523/JNEUROSCI.21-22-09043.2001. [DOI] [PMC free article] [PubMed] [Google Scholar]
- Szumlinski KK, Kalivas PW, Worley PF. Homer proteins: implications for neuropsychiatric disorders. Curr Opin Neurobiol. 2006;16:251–257. doi: 10.1016/j.conb.2006.05.002. [DOI] [PubMed] [Google Scholar]
- Toda S, Shen HW, Peters J, Cagle S, Kalivas PW. Cocaine increases actin cycling: effects in the reinstatement model of drug seeking. J Neurosci. 2006;26:1579–1587. doi: 10.1523/JNEUROSCI.4132-05.2006. [DOI] [PMC free article] [PubMed] [Google Scholar]
- Vocci F, Ling W. Medications development: successes and challenges. Pharmacol Ther. 2005;108:94–108. doi: 10.1016/j.pharmthera.2005.06.010. [DOI] [PubMed] [Google Scholar]
- Wegner AM, Nebhan CA, Hu L, Majumdar D, Meier KM, Weaver AM, Webb DJ. N-wasp and the arp2/3 complex are critical regulators of actin in the development of dendritic spines and synapses. J Biol Chem. 2008;283:15912–15920. doi: 10.1074/jbc.M801555200. [DOI] [PMC free article] [PubMed] [Google Scholar]
- Wolf ME. The role of excitatory amino acids in behavioral sensitization to psychomotor stimulants. Prog Neurobiol. 1998;54:679–720. doi: 10.1016/s0301-0082(97)00090-7. [DOI] [PubMed] [Google Scholar]
- Yao WD, Gainetdinov RR, Arbuckle MI, Sotnikova TD, Cyr M, Beaulieu JM, Torres GE, Grant SG, Caron MG. Identification of PSD-95 as a regulator of dopamine-mediated synaptic and behavioral plasticity. Neuron. 2004;41:625–638. doi: 10.1016/s0896-6273(04)00048-0. [DOI] [PubMed] [Google Scholar]
- Zhou L, Martinez SJ, Haber M, Jones EV, Bouvier D, Doucet G, Corera AT, Fon EA, Zisch AH, Murai KK. EphA4 signaling regulates phospholipase Cgamma1 activation cofilin membrane association and dendritic spine morphology. J Neurosci. 2007;27:5127–5138. doi: 10.1523/JNEUROSCI.1170-07.2007. [DOI] [PMC free article] [PubMed] [Google Scholar]
- Zhou Q, Homma KJ, Poo MM. Shrinkage of dendritic spines associated with long-term depression of hippocampal synapses. Neuron. 2004;44:749–757. doi: 10.1016/j.neuron.2004.11.011. [DOI] [PubMed] [Google Scholar]