

Summary
Albright hereditary osteodystrophy is a monogenic obesity disorder due to heterozygous mutations of Gsα, the G protein which mediates receptor-stimulated cAMP generation, in which obesity only develops when the mutation is on the maternal allele. Likewise, mice with maternal (but not paternal) germline Gsα mutation develop obesity, insulin resistance, and diabetes. These parent-of-origin effects are due to Gsα imprinting with preferential expression from the maternal allele in some tissues. As Gsα is ubiquitously expressed, the tissue involved in this metabolic imprinting effect is unknown. Using brain-specific Gsα knockout mice we show that Gsα imprinting within the central nervous system underlies these effects and that Gsα is imprinted in the paraventricular nucleus of the hypothalamus. Maternal Gsα mutation impaired melanocortin stimulation of energy expenditure but did not affect melanocortin's effect on food intake, suggesting that melanocortins may regulate energy balance in the central nervous system through both Gsα-dependent and -independent pathways.
Introduction
Monogenic obesity syndromes provide important clues about genes that contribute to more common forms of obesity and diabetes and the mechanisms by which these genes regulate energy and glucose metabolism. One such disorder is Albright hereditary osteodystrophy (AHO), which is caused by heterozygous loss-of-function mutations of the G protein α-subunit Gsα which mediates receptor-stimulated cAMP generation. While any AHO patient may develop short stature or skeletal or neurocognitive defects, only those with mutations on the maternal allele develop multihormone resistance and obesity (Long et al., 2007). Likewise, mice with disruption of the maternal (but not paternal) Gsα allele develop obesity, insulin resistance, and diabetes, associated with reduced sympathetic nervous system (SNS) activity and energy expenditure (Chen et al., 2005a; Germain-Lee et al., 2005; Xie et al., 2008). These parent-of-origin metabolic effects are due to the fact that the Gsα gene GNAS is affected by genomic imprinting, an epigenetic phenomenon leading to Gsα being preferentially expressed from the maternal allele in a small number of tissues (Weinstein et al., 2007). GNAS also generates other gene products, but loss of these gene products does not lead to the metabolic phenotype seen in Gsα-deficient mice (Weinstein et al., 2007).
The tissue involved in the parent-of-origin metabolic effects of Gsα mutation is unknown. Liver, adipose tissue, and muscle are not likely candidates as Gsα expression is not affected by imprinting in these tissues (Chen et al., 2005a; Germain-Lee et al., 2005; Mantovani et al., 2004; Weinstein et al., 2007; Yu et al., 2000). One potential site that could be involved is the central nervous system (CNS), as the CNS is critical for regulation of energy and glucose metabolism. Melanocortins act in the CNS via receptors (MC4R, MC3R) which activate Gsα and promote negative energy balance by decreasing food intake and increasing SNS activity and energy expenditure (Brito et al., 2007; Butler and Cone, 2002; Nogueiras et al., 2007). MC4R mutations lead to obesity in both mice and humans (Butler and Cone, 2002; Farooqi et al., 2003; Huszar et al., 1997) and the acute effects of melanotan II (MTII), an MC3R/MC4R agonist, on food intake and energy expenditure are mediated primarily via MC4R (Balthasar et al., 2005; Chen et al., 2000; Marsh et al., 1999). MC4R pathways also regulate glucose metabolism and insulin sensitivity (Fan et al., 2000; Nogueiras et al., 2007; Obici et al., 2001). In contrast MC3R mutation has no effect on food intake and leads to a milder increase in adiposity (Butler and Cone, 2002).
To determine whether Gsα imprinting in the CNS accounts for these metabolic effects, we generated mice with CNS-specific disruption of the maternal (mBrGsKO) or paternal (pBrGsKO) Gsα allele and studied the effects on energy and glucose metabolism and melanocortin regulation of food intake and energy expenditure. In addition we examined several CNS regions that are involved in metabolic regulation for evidence of Gsα imprinting.
Results
CNS-Specific Disruption of the Maternal But Not Paternal Gsα Allele Leads to Obesity
mBrGsKO and pBrGsKO mice were generated by reciprocal crosses of Nestin-cre mice (which express cre recombinase in the CNS) (Tronche et al., 1999), with mice hetero- or homozygous for Gsα-flox (Chen et al., 2005b). The number of mutants alive at weaning were consistent with expected Mendelian ratios. Gsα expression was partially reduced in cerebral cortex and cerebellum of mBrGsKO and pBrGsKO mice but was unaffected in liver, brown adipose tissue [BAT], and muscle (Figure S1). mBrGsKO mice gained much more weight than controls (Nestin-cre- or Gsα-flox-) after 6 weeks (Figure 1A). This was not associated with increased body length (Figure 1B) but rather a significant increase in fat mass and fat pad weights (Figures 1C, 1D, and 1E). In contrast pBrGsKO showed no differences in body weight or composition. Consistent with these changes, serum leptin levels were 4-fold higher in mBrGsKO mice than controls and unaffected in pBrGsKO mice (Table S1). The mBrGsKO phenotype was not due to maternal gestational effects, as their mothers were Nestin-cre- and had normal Gsα expression (Chen et al., 2005b) and metabolic phenotype. There were no differences in thyrotropin (TSH), thyroxine (T4), or triiodothyronine (T3) levels between groups (Table S1).
Figure 1. Obesity in mBrGsKO But Not pBrGsKO Mice.
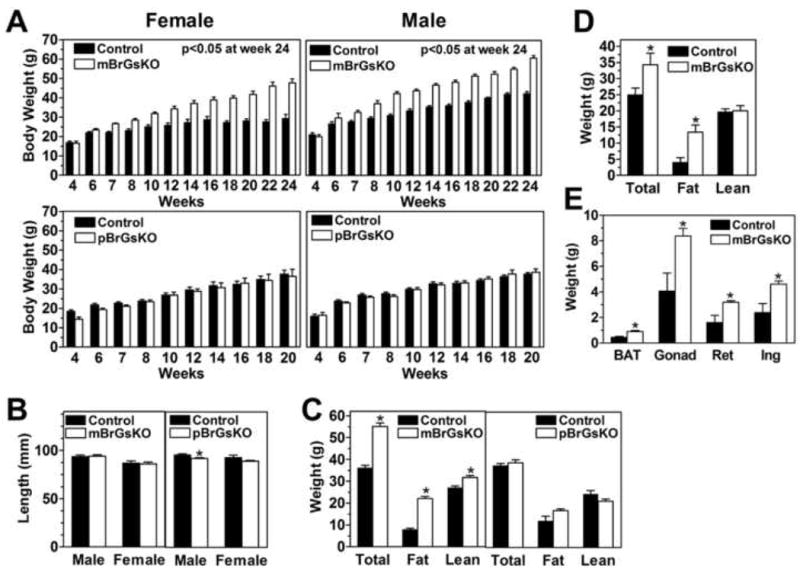
(A) Body weights at given ages of female (left panels) and male (right panels) mBrGsKO, pBrGsKO mice (lower panels), and their respective controls. (mutants, open bars; controls, closed bars; n=4-12).
(B) Body length of male mBrGsKO (left) and pBrGsKO (right) mice and their respective controls (n=5-8).
(C-D) Total body weight, fat, and lean mass (in g) of 3.5-4.5 month old male mBrGKO (left, n=6) and pBrGsKO (right, n=5) mice (C), female mBrGsKO mice (n=8) (D), and controls (n=4-7).
(E) Interscapular BAT and gonadal (Gonad), retroperitoneal (Ret), and inguinal (Ing) fat pad weights in 8-10 month old female mice (n=4).
*p<0.05 vs. controls, mean ± SEM.
Obesity in mBrGsKO Mice is Primarily Associated with Reduced Energy Expenditure
Food intake at 6, 8, and 12 weeks in mBrGsKO mice and at 12 weeks in pBrGsKO mice was similar to controls when normalized to body weight (Figures 2A and S2A). Absolute food intake (kcal/d) was not increased in 6 week old mBrGsKO mice even though their body weight was already significantly increased (Figures 2B and S2A). In contrast MC4R knockout (MC4RKO) and Agouti yellow mice have clearly increased food intake at an early age before the development of obesity (Kublaoui et al., 2006b; Weide et al., 2003). Body weight vs. food intake plot of individual mice showed a similar relationship between these parameters in mBrGsKO and control mice (Figure S3A). Once obesity was clearly established mBrGsKO mice ate more than controls to maintain their higher body weight (Figure S2A), which may due to the development of secondary leptin resistance in response to obesity as seen in MC4RKO mice (Marsh et al., 1999). We cannot rule out the possibility that mBrGsKO also have a primary abnormality in food intake that occurs at a later age. However increased food intake is unlikely to account for the initial onset of obesity as feeding efficiency (weight gain/kcal intake) was more that 2-fold higher in mBrGsKO mice when measured between 6-8 weeks (Figure 2C).
Figure 2. Energy Metabolism in mBrGsKO and pBrGsKO Mice.
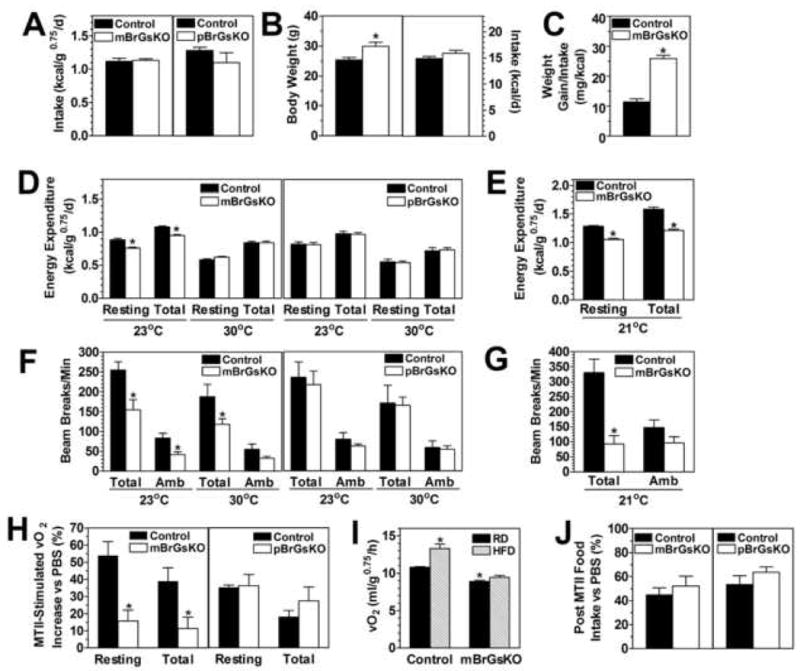
(A) Food intake of 12 week old male mBrGsKO (left, open bars, n=6; controls, closed bars, n=8) and pBrGsKO (right, open bars, n=4; controls n=4) normalized to body weight (kcal/g0.75/d).
(B) Body weight (left panel) and absolute food intake (in kcal/d, right panel) of 5-6 week old male mBrGsKO (n=13) and control mice (n=8).
(C) Feeding efficiency (weight gain/kcal intake) measured from weeks 6-8 in male mBrGsKO (n=3) and control mice (n=6).
(D) REE and TEE at 23°C and 30°C in 5 month old male mBrGsKO (left panel, n=6) and pBrGsKO (right panel, n=5; controls n=4).
(E) REE and TEE at 21°C in 5 month old female mBrGsKO (n=9) and controls (n=8).
(F-G) Total and ambulatory (Amb) motor activity during experiments in panels D and E, respectively.
(H) Increase in REE at 30°C after administration of MTII (10 μg/g ip.) in 4-5 month old mBrGsKO (left panel) and pBrGsKO mice (right panel) and controls (n=6; % increase vs. after PBS).
(I) Resting O2 consumption at 21°C in 5 month old female mBrGsKO and control mice after 4 days of regular (RD, closed bars) or high-fat diet (HFD, hatched bars) (n=8-9).
(J) Food intake in 4-5 month old mice after MTII (200 μg ip.) (n=5; % ingested vs. after PBS).
*p<0.05 vs. controls; #p<0.05 vs. control on RD; mean ± SEM.
Resting and total energy expenditure (REE and TEE, normalized to body weight) were reduced in mBrGsKO mice at ambient temperatures (21 or 23°C) but were normal at thermoneutral temperature (30°C) (Figures 2D and 2E). When not normalizing for body weight, females had no increase in TEE at 21°C even though they had a much greater body weight (Figure S2B). Males had a small increase in TEE while their body weights were much higher. In both sexes linear regressions of body weight vs. TEE showed the mutants to follow a line significantly right-shifted compared to controls (Figures S3B and S3C). mBrGsKO mice also had low total activity levels, and low ambulating activity in males at 23°C (Figures 2F and 2G). In contrast, energy expenditure and activity levels were unaffected in pBrGsKO mice. There were no differences in respiratory exchange ratio (vCO2/vO2) between groups (data not shown). Therefore, similar to germline Gsα knockout mice (Chen et al., 2005a; Yu et al., 2000), CNS-specific disruption of the maternal (but not paternal) Gsα allele led to obesity primarily due to an effect on energy expenditure.
Melanocortin Stimulation of Energy Expenditure is Impaired in mBrGsKO Mice
As MC4RKO mice have a similar phenotype to mBrGsKO mice, we examined the acute change in energy expenditure in response to the melanocortin agonist MTII in mBrGsKO mice. REE at 30°C was measured in the same animals on separate days for 3h after ip. injection of either MTII or PBS vehicle. MTII stimulation of REE was marked reduced in mBrGsKO mice, while pBrGsKO mice responded similarly to controls (Figure 2H). Diet-induced thermogenesis, which requires intact MC4R pathways (Butler et al., 2001; Voss-Andreae et al., 2007), was also impaired in mBrGsKO mice as they failed, unlike controls, to increase their REE after 4 days of high fat diet (Figure 2I). Germline maternal Gsα mutations lead to lower SNS activity in both AHO patients (Carel et al., 1999) and mice (Xie et al., 2008; Yu et al., 2000). Similarly we found evidence of lower SNS activity in mBrGsKO mice, with significantly reduced levels of norepinephrine (NE) and its metabolite dihydroxyphenylglycol (DHPG) (Figures S4A and S4B) in BAT tissue. Consistent with reduced SNS stimulation mBrGsKO mice had significantly reduced Ucp1 (uncoupling protein 1) gene expression in BAT (Figure S4C). Moreover mBrGsKO mice had reduced heart rate and diastolic blood pressure despite being severely obese (Figures S4D and S4E).
Melanocortin Inhibition of Food Intake is Unaffected in mBrGsKO Mice
Food intake was measured in the same animals on separate days for 3.5 hours at the beginning of the dark cycle after ip. injection of either MTII or PBS vehicle. MTII reduced food intake in both mBrGsKO and pBrGsKO mice to a similar extent as controls (Figure 2J), indicating no effect on the acute anorectic effect of melanocortins. Similar results were also observed in mice with maternal and paternal Gsα germline mutations (E1m- and E1p-, respectively) (Chen et al., 2005a; Xie et al., 2008). (Figure S5). Overall, our findings indicate that mBrGsKO mice have impaired stimulation of SNS activity and energy expenditure by melanocortins with no effect on food intake inhibition.
mBrGsKO But Not pBrGsKO Mice Develop Insulin Resistance and Diabetes
BrGsKO mice also showed a similar imprinting effect on other metabolic parameters that were observed in germline Gsα knockout mice (Chen et al., 2005a). At 12 weeks mBrGsKO mice had markedly elevated serum glucose and insulin levels and tended to have higher triglyceride levels, while these were all unaffected in pBrGsKO mice (Table S1). Glucose and insulin tolerance tests showed mBrGsKO, but not pBrGsKO, mice to be severely glucose intolerant and insulin resistant (Figures 3A and 3B). There were no differences in serum free fatty acids or corticosterone between the groups (Table S1).
Figure 3. Glucose Metabolism in mBrGsKO and pBrGsKO Mice.
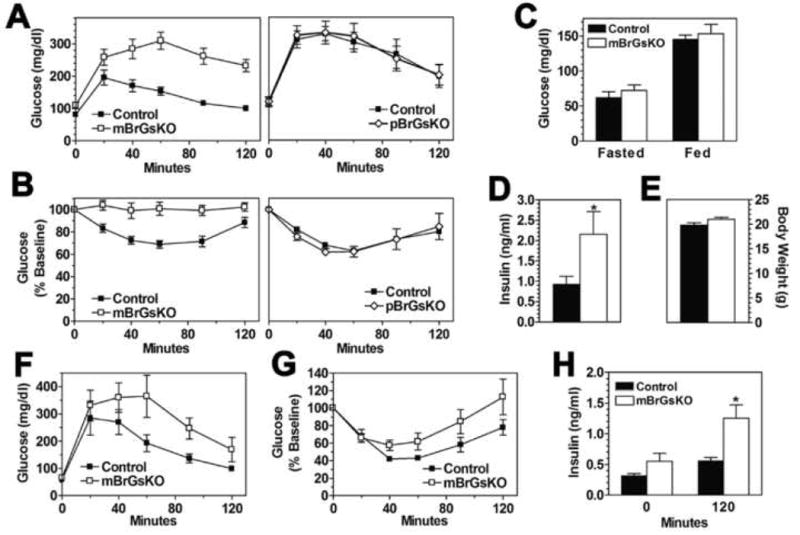
(A-B) Glucose tolerance (n=5-8/group; mBrGsKO p<0.01 vs. control and pBrGsKO p>0.05 vs. control by repeated measures ANOVA) (A) and insulin tolerance tests (n=6-10; mBrGsKO p<0.01 vs. control and pBrGsKO p>0.05 vs. control by repeated measures ANOVA) (B) in 12 week old male mBrGsKO (□, left panel), pBrGsKO (◊, right panel) and control mice (▪).
(C-G) Blood glucose (fasted and fed) (C), insulin levels (fed state; p<0.05 vs. control by unpaired t-test) (D), body weight (E), glucose tolerance (mBrGsKO p<0.05 vs. control by repeated measures ANOVA) (F), and insulin tolerance (G) in young (6 week old) female mBrGsKO (open bars) and control mice (closed bars) (n=8-12).
(H) Insulin levels at time 0 (fasted) and 120 minutes during the glucose tolerance test in panel F. *p<0.05 vs. controls by t-test; mean ± SEM.
To determine the extent to which abnormal glucose metabolism in mBrGsKO mice was independent of obesity, we assessed glucose homeostasis in 5-6 week-old female mBrGsKO mice with similar body weights as controls (Figure 3E). At this age glucose levels were unaffected (Figure 3C). Fasting insulin levels (time 0 of GTT, Figure 3H) tended to be higher in the mutants while fed insulin levels were significantly higher in mBrGsKO (Figure 3D). Even in the absence of obesity, young mBrGsKO were glucose intolerant with significantly higher insulin levels at 120 min (Figures 3F and 3H) and had a tendency toward insulin resistance (Figure 3G). These results suggest that, similar to CNS melanocortin signaling (Fan et al., 2000; Nogueiras et al., 2007; Obici et al., 2001), CNS Gsα signaling directly regulates peripheral glucose metabolism and insulin action independent of its effects on energy balance.
Gsα is Imprinted in the Paraventricular Nucleus of the Hypothalamus
In order to establish whether and where Gsα is imprinted in the CNS, we performed in situ hybridization on brain sections with a Gsα-specific probe. In regions with Gsα imprinting maternal mutation should lead to very low Gsα expression levels while paternal mutation should have less effect. In regions without Gsα imprinting both maternal and paternal mutations should lead to a similar (∼50%) reduction in Gsα expression. We found that Gsα mRNA levels in the paraventricular nucleus of the hypothalamus (PVN) were markedly reduced in E1m- mice compared to controls, with only modest reductions in E1p- mice (Figures 4A and 4B). Similar findings were also observed in BrGsKO mice (data not shown). Immunohistochemistry showed similar relative changes in PVN Gsα protein expression (Figure S6). These results indicate that Gsα undergoes imprinting in the PVN, a region known to be important for metabolic regulation with many MC4R-expressing neurons (Song et al., 2005; Voss-Andreae et al., 2007). Gsα expression in PVN was unaffected in leptin-deficient ob/ob mice with severe obesity and insulin resistance, ruling out that the reduced Gsα expression in E1m- mice was secondary to its metabolic state (Figure 4A). However, Gsα is not globally imprinted in the CNS, as Gsα expression in the hippocampus and the nucleus of the solitary tract (NTS) was similarly reduced by 50-60% in both in E1m- and E1p- mice (Figures 4A and 4B).
Figure 4. Evidence for Gsα Imprinting in Hypothalamic PVN.
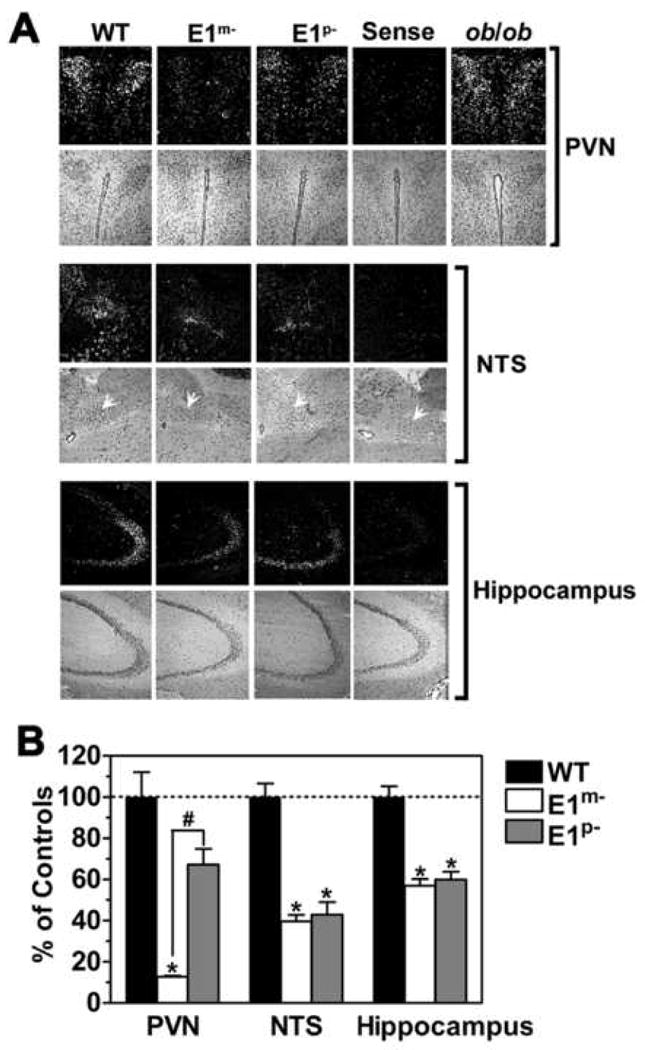
(A) In situ hybridization with antisense Gsα-specific probe in PVN, nucleus of the solitary tract (NTS, white arrows), and hippocampus of wild type (WT), E1m- and E1p-mice (dark field, upper panels; hematoxylin & eosin [H&E], lower panels). Sense indicates the result in a WT mouse using sense Gsα probe. Results for PVN of an ob/ob mouse is shown on the right.
(B) Quantitation of in situ hybridization studies for WT (closed bars), E1m- (open bars), and E1p- mice (gray bars) expressed as %WT (n=5-17p). *p<0.05 vs. WT; #p<0.05 vs. E1m- by one-way ANOVA; mean ± SEM.
Discussion
The present study provides a nice example of how a monogenic obesity disorder such as AHO can provide important insights into the complex mechanisms involved in CNS regulation of energy and glucose metabolism. The most common such disorder that has been defined is that associated with MC4R mutations (Farooqi et al., 2003). Here we show that, similar to MC4R mutations, CNS-specific disruption of Gsα is sufficient to produce severe obesity, peripheral insulin resistance, and diabetes. However the effect of CNS-specific Gsα mutation is unique and differs from MC4R receptor mutations in two important respects. First, while MC4R mutation and models with reduced melanocortin signaling develop hyperphagia early on before the development of obesity (Kublaoui et al., 2006b; Weide et al., 2003), CNS-specific Gsα mutation leads to a specific defect in energy expenditure with little or no primary effect on food intake before obesity is well established. Secondly, Gsα mutation in the CNS has a parent-of-origin effect on metabolic regulation due to tissue-specific imprinting in the CNS.
Our results are consistent with Gsα imprinting in the PVN, which may be an important site for the imprinting effects of Gsα mutation on energy and glucose metabolism in both AHO patients and mice. Although disruption of other imprinted genes such as Peg3 (paternally expressed 3) and Ndn (necdin) also leads to hypothalamic dysfunction and obesity, unlike GNAS, their gene products are expressed from the paternal rather than the maternal allele (Caqueret et al., 2005). We show no evidence for Gsα imprinting in the brainstem NTS, another region implicated in metabolic control by melanocortins (Ellacott and Cone, 2004; Li et al., 2007), and therefore this region is probably not involved in the imprinted metabolic phenotype. However it is possible that Gsα is also imprinted in other CNS sites outside of the PVN where MC4R receptors are known to be expressed (Kishi et al., 2003; Song et al., 2005; Voss-Andreae et al., 2007). Gsα is also likely to be imprinted in specific brain regions involved in cognitive function, as AHO patients with maternal inheritance of Gsα mutations were found to have greater cognitive impairment (Mouallem et al., 2008).
GNAS also generates an alternative neuroendocrine-specific Gsα isoform (XLαs) that is oppositely imprinted from Gsα, being transcribed from the paternal allele. Results from XLαs knockout mice (Xie et al., 2006) show that XLαs and Gsα work in the CNS to produce opposite effects on SNS activity and energy and glucose metabolism in a pattern consistent with the kinship theory of genomic imprinting which predicts that maternal and paternal genes inhibit and stimulate the accumulation of energy resources, respectively (Haig, 2004).
mBrGsKO mice had some features associated with loss of MC4R receptors (obesity, reduced SNS activity and energy expenditure, insulin resistance) but lacked others (increased food intake and linear growth) (Butler and Cone, 2002; Farooqi et al., 2003; Huszar et al., 1997; Weide et al., 2003), suggesting that MC4Rs may mediate their effects through both Gsα-dependent and -independent pathways. Despite the fact that melanocortins mediate their anorectic response primarily via MC4R signalling in the PVN (Balthasar et al., 2005; Chen et al., 2000; Kublaoui et al., 2006a), mBrGsKO mice with very low PVN Gsα levels had a normal anorectic response to a melanocortin agonist. Therefore MC4Rs may alter food intake via a Gsα-independent pathway. However one study showed that excess melanocortin signalling in the NTS of rats resulted in anorexia (Li et al., 2007), and therefore it may be possible that the anorectic effect of melanocortins in mBrGsKO mice is occurring in the NTS.
In contrast to its lack of involvement in regulation of food intake, our results show Gsα is required for melanocortin stimulation of SNS activity and energy expenditure. While Balthasar and colleagues showed that restoration of MC4R in PVN of MC4RKO mice did not restore the ability of melanocortins to stimulate energy expenditure (Balthasar et al., 2005), it is possible that this response requires the presence of MC4R in both PVN and one or more other CNS sites involved in energy regulation (Kishi et al., 2003; Song et al., 2005; Voss-Andreae et al., 2007). Loss of MC3R signaling may also contribute to the mBrGsKO metabolic phenotype, although MC3RKO mice are less severely affected than mBrGsKO or MC4RKO mice (Butler and Cone, 2002). Loss of Gsα-mediated signaling pathways other than that of melanocortins (e.g. cholecystokinins, glucagon-like peptide 1) may also contribute to the metabolic consequences of Gsα mutations. However these latter pathways primarily affect food intake rather than energy expenditure.
Experimental Procedures
Mice
Female mice with loxP sites surrounding Gsα exon 1 (E1fl/fl; E1fl/+) (Chen et al., 2005b) were mated with nestin-cre males (Jackson Laboratory) (Tronche et al., 1999) to generate mBrGsKO mice. pBrGsKO mice were generated with reciprocal crosses. Animals were maintained on a 12-h light/dark cycle (6 am/6 pm) and standard diet (NIH-07, 5% fat by weight). These studies were approved by the NIDDK Animal Care and Use Committee.
Food Intake, Body Composition, and Metabolism
Body composition was measured with the Echo3-in1 NMR analyzer (Echo Medical). Food intake was measured as previously described (Yu et al., 2000). Indirect calorimetry was performed using a 4 chamber Oxymax system (Columbus Instruments; 2.5 L chambers with wire mesh floors, using 0.6 L/min flow rate, 90-sec purge and 60-sec measure, 1 mouse/chamber). Motor activities were determined by infrared beam interruption (Opto-Varimex mini; Columbus). For diet-induced thermogenesis resting O2 consumption at 23°C was measured in mice on standard diet or after 4 days of high-fat diet (59.36% fat, 16.16% protein, 24.48% carbohydrate; Bio-Serv).
MTII Injections
Single-caged mice received MTII (200 μg ip.) or vehicle (PBS, 100 μl ip.) 30 min before lights out, and food intake was measured for 3.5 h in the dark. For energy expenditure, mice were injected with MTII (10 μg/g ip.) or vehicle on separate days and REE was measured for 3h at 30°C (Xie et al., 2006).
Glucose and Insulin Tolerance Tests
For glucose and insulin tolerance tests, overnight-fasted mice were given ip. glucose (2 mg/g body weight) or insulin (Humulin, 0.75 mIU/g). Glucose was measured from tail blood with a Glucometer Elite (Bayer). Insulin was measured by RIA (Linco).
In Situ Hybridization
In situ hybridization of brain slices was performed as previously described (Cheng et al., 2001) using 118 bp sense and antisense RNA probes for Gsα exon 1 (coding nucleotides 5-122). After hybridization slides were exposed to NTB2 emulsion for 3 days, then counterstained with hematoxylin & eosin. Signals were quantified with Image-Pro Plus software (Media Cybernetics).
Biochemical Assays
Serum insulin and leptin levels were measured using radioimmunoassay (RIA) kits (Linco Research). Serum corticosterone was measured using a RIA kit (ICN Pharmaceuticals). Serum TSH was measured with an RIA kit (Amersham). Serum T3 and T4 were measured with RIA kits (Siemens Healthcare Diagnostics). Free fatty acids and triglycerides were measured using reagents purchased from Roche and Thermo DNA, respectively. Serum glucose levels were measured using a Glucometer Elite (Bayer). Serum T3 and T4 were measured with RIA kits (Siemens Healthcare Diagnostics). (C) Feeding efficiency (weight gain/kcal intake) measured from weeks 6-8 and weeks 8-12 in mBrGsKO (n=2-3) and control mice (n=3-6).
Immunoblot Analysis
Tissue protein extracts were separated on 8% Tris-glycine gels and blots were simultaneously incubated with Gsα-specific (Simonds et al., 1989) and α-tubulin antibodies (EMD Chemicals). Protein was visualized with fluorescence-conjugated anti-mouse and anti-rabbit second antibodies (LI-COR).
Measurement of Tissue NE and DHPG
Tissues were homogenized in 4 volumes of 0.4N perchloride acid, and then spun at 13,000 rpm, 4°C for 20 min. NE and content was quantified in supernatant by reverse phase liquid chromatography (Eisenhofer et al., 1986) and normalized to total protein.
Blood Pressure and Heart Rate Measurements
Blood pressure and heart rate were measured by a BP-2000 Specimen platform (Visitech).
Quantitative RT-PCR
Ucp1 gene expression levels in BAT were measured by quantitative RT-PCR method as described (Chen et al., 2005).
Immunohistochemistry
Frozen brain sections were fixed in 4% formaldehyde for 10 min, washed and placed in 3% H2O2 for 10 min. After blocking in 10% normal goat serum, sections were incubated with rabbit anti-Gsα antibody (Simonds et al., 1989) overnight at 4°C. Sections were then incubated with biotinylated sheep anti-rabbit secondary antibody (Vector) in blocking solution containing 10% sheep serum and 1% BSA in PBS for 30 min at room temperature. The signal was detected and amplified using the ABC peroxidase method (Vector), and visualized with 3,3′-diaminobenzidine. Sections were counterstained with methyl green.
Statistical Analysis
Groups were compared with unpaired t-tests unless indicated, otherwise by repeated measures ANOVA or one way ANOVA with Tukey's post-test, with differences considered significant at p<0.05.
Supplementary Material
Acknowledgments
We thank R. Vinitsky for technical support. This work was supported by the NIDDK and NICHD Intramural Research Programs.
Footnotes
Supplemental Data: Supplemental Data include one table and six figures and can be found online at …
Publisher's Disclaimer: This is a PDF file of an unedited manuscript that has been accepted for publication. As a service to our customers we are providing this early version of the manuscript. The manuscript will undergo copyediting, typesetting, and review of the resulting proof before it is published in its final citable form. Please note that during the production process errors may be discovered which could affect the content, and all legal disclaimers that apply to the journal pertain.
References
- Balthasar N, Dalgaard LT, Lee CE, Yu J, Funahashi H, Williams T, Ferreira M, Tang V, McGovern RA, Kenny CD, et al. Divergence of melanocortin pathways in the control of food intake and energy expenditure. Cell. 2005;123:493–505. doi: 10.1016/j.cell.2005.08.035. [DOI] [PubMed] [Google Scholar]
- Brito MN, Brito NA, Baro DJ, Song CK, Bartness TJ. Differential activation of the sympathetic innervation of adipose tissues by melanocortin receptor stimulation. Endocrinology. 2007;148:5339–5347. doi: 10.1210/en.2007-0621. [DOI] [PubMed] [Google Scholar]
- Butler AA, Cone RD. The melanocortin receptors: lessons from knockout models. Neuropeptides. 2002;36:77–84. doi: 10.1054/npep.2002.0890. [DOI] [PubMed] [Google Scholar]
- Butler AA, Marks DL, Fan W, Kuhn CM, Bartolome M, Cone RD. Melanocortin-4 receptor is required for acute homeostatic responses to increased dietary fat. Nat Neurosci. 2001;4:605–611. doi: 10.1038/88423. [DOI] [PubMed] [Google Scholar]
- Caqueret A, Yang C, Duplan S, Boucher F, Michaud JL. Looking for trouble: a search for developmental defects of the hypothalamus. Horm Res. 2005;64:222–230. doi: 10.1159/000088977. [DOI] [PubMed] [Google Scholar]
- Carel JC, Le Stunff C, Condamine L, Mallet E, Chaussain JL, Adnot P, Garabedian M, Bougneres P. Resistance to the lipolytic action of epinephrine: a new feature of protein Gs deficiency. J Clin Endocrinol Metab. 1999;84:4127–4131. doi: 10.1210/jcem.84.11.6145. [DOI] [PubMed] [Google Scholar]
- Chen AS, Metzger JM, Trumbauer ME, Guan XM, Yu H, Frazier EG, Marsh DJ, Forrest MJ, Gopal-Truter S, Fisher J, et al. Role of the melanocortin-4 receptor in metabolic rate and food intake in mice. Transgenic Res. 2000;9:145–154. doi: 10.1023/a:1008983615045. [DOI] [PubMed] [Google Scholar]
- Chen M, Gavrilova O, Liu J, Xie T, Deng C, Nguyen AT, Nackers LM, Lorenzo J, Shen L, Weinstein LS. Alternative Gnas gene products have opposite effects on glucose and lipid metabolism. Proc Natl Acad Sci USA. 2005a;102:7386–7391. doi: 10.1073/pnas.0408268102. [DOI] [PMC free article] [PubMed] [Google Scholar]
- Chen M, Gavrilova O, Zhao WQ, Nguyen A, Lorenzo J, Shen L, Nackers L, Pack S, Jou W, Weinstein LS. Increased glucose tolerance and reduced adiposity in the absence of fasting hypoglycemia in mice with liver-specific Gsα deficiency. J Clin Invest. 2005b;115:3217–3227. doi: 10.1172/JCI24196. [DOI] [PMC free article] [PubMed] [Google Scholar]
- Cheng CH, Cohen M, Wang J, Bondy CA. Estrogen augments glucose transporter and IGF1 expression in primate cerebral cortex. FASEB J. 2001;15:907–915. doi: 10.1096/fj.00-0398com. [DOI] [PubMed] [Google Scholar]
- Eisenhofer G, Goldstein DS, Stull R, Keiser HR, Sunderland T, Murphy DL, Kopin IJ. Simultaneous liquid-chromatographic determination of 3,4-dihydroxyphenylglycol, catecholamines, and 3,4-dihydroxyphenylalanine in plasma, and their responses to inhibition of monoamine oxidase. Clin Chem. 1986;32:2030–2033. [PubMed] [Google Scholar]
- Ellacott KL, Cone RD. The central melanocortin system and the integration of short- and long-term regulators of energy homeostasis. Recent Prog Horm Res. 2004;59:395–408. doi: 10.1210/rp.59.1.395. [DOI] [PubMed] [Google Scholar]
- Fan W, Dinulescu DM, Butler AA, Zhou J, Marks DL, Cone RD. The central melanocortin system can directly regulate serum insulin levels. Endocrinology. 2000;141:3072–3079. doi: 10.1210/endo.141.9.7665. [DOI] [PubMed] [Google Scholar]
- Farooqi IS, Keogh JM, Yeo GS, Lank EJ, Cheetham T, O'Rahilly S. Clinical spectrum of obesity and mutations in the melanocortin 4 receptor gene. N Engl J Med. 2003;348:1085–1095. doi: 10.1056/NEJMoa022050. [DOI] [PubMed] [Google Scholar]
- Germain-Lee EL, Schwindinger W, Crane JL, Zewdu R, Zweifel LS, Wand G, Huso DL, Saji M, Ringel MD, Levine MA. A mouse model of Albright hereditary osteodystrophy generated by targeted disruption of exon 1 of the Gnas gene. Endocrinology. 2005;146:4697–4709. doi: 10.1210/en.2005-0681. [DOI] [PubMed] [Google Scholar]
- Haig D. Genomic imprinting and kinship: how good is the evidence? Annu Rev Genet. 2004;38:553–585. doi: 10.1146/annurev.genet.37.110801.142741. [DOI] [PubMed] [Google Scholar]
- Huszar D, Lynch CA, Fairchild-Huntress V, Dunmore JH, Fang Q, Berkemeier LR, Gu W, Kesterson RA, Boston BA, Cone RD, et al. Targeted disruption of the melanocortin-4 receptor results in obesity in mice. Cell. 1997;88:131–141. doi: 10.1016/s0092-8674(00)81865-6. [DOI] [PubMed] [Google Scholar]
- Kishi T, Aschkenasi CJ, Lee CE, Mountjoy KG, Saper CB, Elmquist JK. Expression of melanocortin 4 receptor mRNA in the central nervous system of the rat. J Comp Neurol. 2003;457:213–235. doi: 10.1002/cne.10454. [DOI] [PubMed] [Google Scholar]
- Kublaoui BM, Holder JL, Jr, Gemelli T, Zinn AR. Sim1 haploinsufficiency impairs melanocortin-mediated anorexia and activation of paraventricular nucleus neurons. Mol Endocrinol. 2006a;20:2483–2492. doi: 10.1210/me.2005-0483. [DOI] [PubMed] [Google Scholar]
- Kublaoui BM, Holder JL, Jr, Tolson KP, Gemelli T, Zinn AR. SIM1 overexpression partially rescues agouti yellow and diet-induced obesity by normalizing food intake. Endocrinology. 2006b;147:4542–4549. doi: 10.1210/en.2006-0453. [DOI] [PubMed] [Google Scholar]
- Li G, Zhang Y, Rodrigues E, Zheng D, Matheny M, Cheng KY, Scarpace PJ. Melanocortin activation of nucleus of the solitary tract avoids anorectic tachyphylaxis and induces prolonged weight loss. Am J Physiol. 2007;293:E252–E258. doi: 10.1152/ajpendo.00451.2006. [DOI] [PubMed] [Google Scholar]
- Long DN, McGuire S, Levine MA, Weinstein LS, Germain-Lee EL. Body mass index differences in pseudohypoparathyroidism type 1a versus pseudopseudohypoparathyroidism implicate paternal imprinting of Gαs in the development of human obesity. J Clin Endocrinol Metab. 2007;92:1073–1079. doi: 10.1210/jc.2006-1497. [DOI] [PubMed] [Google Scholar]
- Mantovani G, Bondioni S, Locatelli M, Pedroni C, Lania AG, Ferrante E, Filopanti M, Beck-Peccoz P, Spada A. Biallelic expression of the Gsα gene in human bone and adipose tissue. J Clin Endocrinol Metab. 2004;89:6316–6319. doi: 10.1210/jc.2004-0558. [DOI] [PubMed] [Google Scholar]
- Marsh DJ, Hollopeter G, Huszar D, Laufer R, Yagaloff KA, Fisher SL, Burn P, Palmiter RD. Response of melanocortin-4 receptor-deficient mice to anorectic and orexigenic peptides. Nat Genet. 1999;21:119–122. doi: 10.1038/5070. [DOI] [PubMed] [Google Scholar]
- Mouallem M, Shaharabany M, Weintrob N, Shalitin S, Nagelberg N, Shapira H, Zadik Z, Farfel Z. Cognitive impairment is prevalent in pseudohypoparathyroidism type Ia, but not in pseudopseudohypoparathyroidism: possible cerebral imprinting of Gsα. Clin Endocrinol (Oxf) 2008;68:233–239. doi: 10.1111/j.1365-2265.2007.03025.x. [DOI] [PubMed] [Google Scholar]
- Nogueiras R, Wiedmer P, Perez-Tilve D, Veyrat-Durebex C, Keogh JM, Sutton GM, Pfluger PT, Castanada TR, Neschen S, Hofmann SM, et al. The central melanocortin system directly controls peripheral lipid metabolism. J Clin Invest. 2007;117:3475–3488. doi: 10.1172/JCI31743. [DOI] [PMC free article] [PubMed] [Google Scholar]
- Obici S, Feng Z, Tan J, Liu L, Karkanias G, Rossetti L. Central melanocortin receptors regulate insulin action. J Clin Invest. 2001;108:1079–1085. doi: 10.1172/JCI12954. [DOI] [PMC free article] [PubMed] [Google Scholar]
- Simonds WF, Goldsmith PK, Woodard CJ, Unson CG, Spiegel AM. Receptor and effector interactions of Gs. Functional studies with antibodies to the alpha s carboxyl-terminal decapeptide. FEBSLett. 1989;249:189–194. doi: 10.1016/0014-5793(89)80622-2. [DOI] [PubMed] [Google Scholar]
- Song CK, Jackson RM, Harris RB, Richard D, Bartness TJ. Melanocortin-4 receptor mRNA is expressed in sympathetic nervous system outflow neurons to white adipose tissue. Am J Physiol. 2005;289:R1467–R1476. doi: 10.1152/ajpregu.00348.2005. [DOI] [PubMed] [Google Scholar]
- Tronche F, Kellendonk C, Kretz O, Gass P, Anlag K, Orban PC, Bock R, Klein R, Schutz G. Disruption of the glucocorticoid receptor gene in the nervous system results in reduced anxiety. Nat Genet. 1999;23:99–103. doi: 10.1038/12703. [DOI] [PubMed] [Google Scholar]
- Voss-Andreae A, Murphy JG, Ellacott KLJ, Stuart RC, Nillni EA, Cone RD, Fan W. Role of the central melanocortin circuitry in adaptive thermogenesis of brown adipose tissue. Endocrinology. 2007;148:1550–1560. doi: 10.1210/en.2006-1389. [DOI] [PubMed] [Google Scholar]
- Weide K, Christ N, Moar KM, Arens J, Hinney A, Mercer JG, Eiden S, Schmidt I. Hyperphagia, not hypometabolism, causes early onset obesity in melanocortin-4 receptor knockout mice. Physiol Genomics. 2003;13:47–56. doi: 10.1152/physiolgenomics.00129.2002. [DOI] [PubMed] [Google Scholar]
- Weinstein LS, Xie T, Zhang QH, Chen M. Studies of the regulation and function of the Gsα gene Gnas using gene targeting technology. Pharmacol Ther. 2007;115:271–291. doi: 10.1016/j.pharmthera.2007.03.013. [DOI] [PMC free article] [PubMed] [Google Scholar]
- Xie T, Chen M, Gavrilova O, Lai EW, Liu J, Weinstein LS. Severe Obesity and insulin resistance due to deletion of the maternal Gsα allele is reversed by paternal deletion of the Gsα imprint control region. Endocrinology. 2008;149:2443–2450. doi: 10.1210/en.2007-1458. [DOI] [PMC free article] [PubMed] [Google Scholar]
- Xie T, Plagge A, Gavrilova O, Pack S, Jou W, Lai EW, Frontera M, Kelsey G, Weinstein LS. The alternative stimulatory G protein α-subunit XLαs is a critical regulator of energy and glucose metabolism and sympathetic nerve activity in adult mice. J Biol Chem. 2006;281:18989–18999. doi: 10.1074/jbc.M511752200. [DOI] [PMC free article] [PubMed] [Google Scholar]
- Yu S, Gavrilova O, Chen H, Lee R, Liu J, Pacak K, Parlow AF, Quon MJ, Reitman ML, Weinstein LS. Paternal versus maternal transmission of a stimulatory G protein α subunit knockout produces opposite effects on energy metabolism. J Clin Invest. 2000;105:615–623. doi: 10.1172/JCI8437. [DOI] [PMC free article] [PubMed] [Google Scholar]
Associated Data
This section collects any data citations, data availability statements, or supplementary materials included in this article.