Abstract
γ-Hydroxybutyric acid (GHB), a drug of abuse, is a substrate of monocarboxylate transporters (MCTs). Sodium-coupled monocarboxylate transporter 1 (SMCT1; SLC5A8) is expressed in kidney, thyroid gland, neurons, and intestinal tract and exhibits substrate specificity similar to that of the proton-dependent MCT (SLC16A) family. The role of SMCT1 in GHB disposition has not been determined. In this study we characterized the driving force, transport kinetics, and inhibitors of GHB uptake, as well as expression of SMCT and MCT isoforms, in rat thyroid follicular (FRTL-5) cells. GHB, as well as the monocarboxylates butyrate and d-lactate, exhibited sodium-dependent uptake at pH 7.4, which could be described with a simple Michaelis-Menten equation plus a diffusional component [Km 0.68 ± 0.30 mM, Vmax 3.50 ± 1.58 nmol · mg–1 · min–1, and diffusional clearance (P) 0.25 ± 0.08 μl · mg–1 · min–1]. In the absence of sodium, GHB uptake was significantly increased at lower pH, suggesting proton-gradient dependent transport. Reverse transcriptase-polymerase chain reaction and Western analyses demonstrated the expression of SMCT1, MCT1, and MCT2 in FRTL-5 cells, supporting the activity results. Sodium-dependent GHB uptake in FRTL-5 cells was inhibited by MCT substrates (d-lactate, l-lactate, pyruvate, and butyrate), nonsteroidal anti-inflammatory drugs (ibuprofen, ketoprofen, and naproxen), and probenecid. IC50 values for l-lactate, ibuprofen, ketoprofen, and probenecid were 101, 31.6, 64.4, and 380 μM, respectively. All four inhibitors also significantly inhibited GHB uptake in rat MCT1 gene-transfected MDA/MB231 cells, suggesting they are not specific for SMCT1. Luteolin and α-cyano-4-hydroxycinnimate represent specific proton-dependent MCT inhibitors. Our findings indicate that GHB is a substrate for both sodium- and proton-dependent MCTs and identified specific inhibitors of MCTs.
Two members of the sodium-coupled monocarboxylate transporter family (SMCT) have been cloned to date, the high-affinity transporter SMCT1 (SLC5A8) and the low-affinity SMCT2 (SLC5A12) (Rodriguez et al., 2002; Srinivas et al., 2005). The SLC5A8 gene was originally identified from a kidney cDNA library as a close structural relative of human Na+/I– symporter (SLC5A5) (Rodriguez et al., 2002). SMCT1 protein has been detected in kidney, intestine, salivary gland, thyroid gland, brain, and retina (Ganapathy et al., 2008). Less is known about SMCT2. mRNA expression of SMCT2 was detected in kidney, small intestine, and skeletal muscle and to a lesser extent in brain and retina. Functional characterization of SMCT2 suggested substrate specificity similar to that of SMCT1. However, the affinities of SMCT2 for monocarboxylate substrates are approximately 35- to 80-fold lower than those of SMCT1 (Srinivas et al., 2005).
SMCT1 mediates transport of monocarboxylic acids such as lactate, pyruvate, propionate, butyrate, nicotinate, and short-chain fatty acids. Substrates of SMCT1 are similar to those of MCTs, a proton-coupled monocarboxylate transporter family (Gopal et al., 2005; Spanier and Drewes, 2007; Morris and Felmlee, 2008). The physiological function of SMCT1 may relate to maintaining homeostasis of short monocarboxylates, but clear evidence of its function is currently lacking. In the kidney, SMCT1 is expressed in the apical membrane of tubular epithelial cells and is mainly limited to the S3 section of the proximal tubule. It was hypothesized that SMCT1 is involved in renal reabsorption of lactate and pyruvate (Gopal et al., 2007b; Ganapathy et al., 2008), because sodium-dependent transport of these monocarboxylates has been observed in the kidney (Barac-Nieto et al., 1980; Mengual et al., 1989). Moreover, SLC5A8-deficient or knockout mice exhibited increased urinary excretion of lactate (Frank et al., 2008). In the brain, SMCT1 exhibits a neuron-specific distribution and may mediate cellular uptake of lactate and ketone bodies, the primary energy substrates of neurons (Martin et al., 2006). Besides the postulated physiological functions, several reports suggested a tumor-suppressing role for SMCT1. High frequency of aberrant methylation or down-regulation of the SLC5A8 gene has been observed in human colon cancer, papillary thyroid carcinomas, pancreatic cancer, prostate tumor, acute myeloid leukemia, and glioma formation (Ganapathy et al., 2008; Park et al., 2008).
The role of SMCT1 in drug transport has not been determined. The expression pattern in kidney and intestine indicates that SMCT1 may play a role in the oral bioavailability and renal reabsorption of monocarboxylate drugs. Studies using Xenopus laevis oocytes expressing human SLC5A8 showed that benzoate, salicylate, and 5-aminosalicylate were transported by SMCT1 (Gopal et al., 2007a). In the present investigation, we characterized transport of γ-hydroxybutyrate (GHB) in rat thyroid follicular FRTL-5 cells. GHB is an endogenous short-chain fatty acid formed from GABA and is present in the brain, heart, kidney, liver, lung, muscle, and gastrointestinal tract (Maitre, 1997; Tedeschi et al., 2003). The therapeutic use of GHB includes treatment of the sleep disorder narcolepsy with cataplexy (Mamelak et al., 1986) and alcohol withdrawal syndrome (Poldrugo and Addolorato, 1999). GHB is also a recreational drug, abused because of its euphoric effects (Wong et al., 2004). An overdose of GHB can lead to adverse effects such as seizures, dizziness, nausea, vomiting, coma, and even death (Mason and Kerns, 2002). GHB exhibits nonlinear pharmacokinetics in humans (Palatini et al., 1993) and rats (Lettieri and Fung, 1979), and the nonlinearity is related to capacity-limited metabolism (Ferrara et al., 1992), saturable absorption (Arena and Fung, 1980), and nonlinear renal clearance (Morris et al., 2005). Our previous studies have demonstrated that MCT1 mediates GHB transport in rat kidney membrane vesicles, in the human kidney cell line HK-2, and in rat MCT1-transfected MDA-MB231 cells (Wang et al., 2006). In vivo studies have suggested that saturation of the MCT1-mediated renal reabsorption of GHB contributes to the increase of renal clearance at high GHB doses (Morris et al., 2005) and may represent a novel clinical treatment for GHB intoxification (Morris et al., 2005; Wang and Morris, 2007). However, the role of SMCTs in the disposition of GHB is largely unknown.
The similarity of substrates of SMCTs and MCTs suggests that GHB may be a substrate of SMCT1. In this investigation, SMCT1-mediated transport of GHB and other MCT substrates, d-lactate and butyrate, was characterized using FRTL-5 cells, a rat thyroid-derived cell line that maintains thyrocyte functions such as hormonal responsiveness, iodide uptake, and thyroglobulin synthesis (Ambesi-Impiombato et al., 1980). This cell line was chosen because expression of SMCT1 and the sodium-dependent transport of nicotinate have been observed in FRTL-5 cells (Paroder et al., 2006). Our overall goal is to characterize the SMCT-mediated transport of GHB and to identify specific transport inhibitors to develop strategies to treat GHB overdoses through inhibition of SMCT1-mediated transport in the body.
The objectives of the study were 1) to evaluate the expression of SMCT1, 2) to examine the effect of sodium on the transport of GHB, as well as the monocarboxylate substrates d-lactate and butyrate, 3) to characterize the driving forces and concentration-dependent kinetics of GHB uptake, and 4) to identify potential inhibitors of SMCT1 in FRTL-5 cells.
Materials and Methods
Materials. Coon's modified Ham's F-12 medium and calf bovine serum were obtained from American Type Culture Collection (Manassas, VA). Dulbecco's modified Eagle's medium, trypsin-EDTA, fetal bovine serum, Geneticin (G-418), penicillin/streptomycin, and collagenase were obtained from Invitrogen (Carlsbad, CA). Bovine thyrotropic hormone (TSH), insulin, hydrocortisone, transferrin, somatostatin, glycyl-l-histidyl-l-lysyl acetate, d-lactate, l-lactate, sodium GHB, butyrate, pyruvate, dl-β-hydroxybutyrate (BHB), ketoprofen, ibuprofen, naproxen, α-cyano-4-hydroxycinnimate (CHC), 3′,4′,5,7-tetrahydroxyflavone (luteolin), phloretin, probenecid, 4,4′-diisothiocyanatostilbene-2,2′-disulfonic acid (DIDS), HEPES, and MES were obtained from Sigma-Aldrich (St. Louis, MO). [2,3-3H]GHB (specific activity 50 Ci/mmol), [2,3-3H]d-lactate (specific activity 20 Ci/mmol), and [1-14C]butyrate (specific activity 56 mCi/mmol) were purchased from American Radiolabeled Chemicals (St. Louis, MO). Biodegradable counting scintillate was obtained from GE Healthcare (Little Chalfont, Buckinghamshire, UK).
Cell Culture. FRTL-5 cells (American Type Culture Collection) were cultured as described previously (Beguinot et al., 1987). In brief, cells were grown in Coon's modified Ham's F-12 medium supplemented with 5% calf bovine serum and a mixture of hormones consisting of 10 mU/ml TSH, 0.01 mg/ml insulin, 10 nM hydrocortisone, 5 μg/ml transferrin, 10 ng/ml somatostatin, and 10 ng/ml glycyl-l-histidyl-l-lysyl acetate. Cells were incubated at 37°C in a humidified atmosphere with 5% CO2/95% air. Culture medium was changed every 3 to 4 days, and cells were passaged biweekly using 0.05% trypsin-EDTA with 20 U/ml collagenase. For uptake studies, cells were seeded in 35 mm2 plastic dishes or six-well plates and maintained for 1 week in the culture medium free of TSH. Rat MCT1 gene-transfected MDA-MB231 cells and mock cells were kindly provided by Professors I. Tamai and A. Tsuji (Kanazawa University, Kanazawa City, Japan) and cultured as described previously (Wang et al., 2006). In brief, cells were cultured at 37°C with 5% CO2/95% air in Dulbecco's modified Eagle's medium with addition of 10% fetal bovine serum, 0.5 mg/ml Geneticin, 100 units of penicillin, and 100 μg/ml streptomycin. Culture medium was changed every 2 to 3 days, and cells were passaged weekly. Two or 3 days before the uptake studies, cells were seeded in six-well plates with a density of 1 × 10⁵ cells/well.
Cellular Uptake Study. Culture medium was removed, and cells were washed three times with uptake buffer (137 mM NaCl, 5.4 mM KCl, 2.8 mM CaCl2, 1.2 mM MgCl2 · 6H2O, and 10 mM HEPES, pH 7.4). One milliliter of uptake buffer containing [3H]GHB, [3H]d-lactate, or [14C]butyrate was added to the dishes. For the time course study, the cells were incubated at room temperature for 0.5, 1, 3, 5, 10, 30, and 60 min. For the pH-dependent study, the cells were incubated with uptake buffer with different pH values (pH 5.5, 6.0, 6.5, 7.0, and 7.4), whereas for the sodium-dependent study, the cells were incubated with sodium buffer (137 mM NaCl, 5.4 mM KCl, 2.8 mM CaCl2, 1.2 mM MgCl2 · 6H2O, and 10 mM HEPES, pH 7.4) or sodium-free buffer (137 mM N-methyl-d-glucamine, 5 mM KCl, 1 mM CaCl2, 1 mM MgCl2, and 10 mM HEPES, pH 7.4). Inhibitors examined in the cellular uptake studies included d-lactate, l-lactate, butyrate, pyruvate, BHB, ketoprofen, ibuprofen, naproxen, CHC, luteolin, phloretin, probenecid, and DIDS. The uptake was stopped by aspirating the buffer and washing three times with ice-cold stop buffer (137 mM NaCl, 5.4 mM KCl, 2.8 mM CaCl2, 1.2 mM MgCl2 · 6H2O, and 10 mM HEPES, pH 7.4). The cells were lysed in 1 ml of lysis buffer (0.3 N NaOH and 1% SDS) for 2 h. Radioactivity was determined by mixing 3 ml of scintillation liquid with 400 μl of lysed sample and counting with a liquid scintillation counter (1900 CA, Tri-Carb liquid scintillation analyzer; PerkinElmer Life and Analytical Sciences, Waltham, MA). Protein concentrations were determined by the bicinchoninic acid protein assay with bovine serum albumin as the protein standard. The results were normalized for the protein content of the cell lysate.
RT-PCR. Total RNA was isolated from cells using the SV Total RNA Isolation System (Promega, Madison, WI). First-strand cDNA was synthesized from 10 μg of total RNA by SuperScript II reverse transcriptase (Invitrogen) with oligo(dT)12–18 primer. PCR was performed using an Eppendorf Master-cycler gradient PCR system. The primers specific to rat MCT1 and MCT2 were designed using Primer Express software and checked with the Blast analysis in the GenBank database for sequence identity (MCT1, forward 5′-ACCCGAGACATCCGAAACC-3′ and reverse 5′-AATTGTCCACTGTCTGCACGG-3′; MCT2, forward 5′-CCTCTTTGAATGTCTTATGGACCA-3′ and reverse 5′-TATATCGAGCAATTTACCAGCCAG-3′; MCT3, forward 5′-GAGGATGTGGAGGCTGAGAG-3′ and reverse 5′-GCCACCTATGGACTCGTGAT-3′; MCT4, forward 5′-GGGTCATCACTGGCTTGGGT-3′ and reverse 5′-GGAACACGGGACTGCCTGC-3′; SMCT1, forward 5′-GTTGCTGGTGGGGATTCTTA-3′ and reverse 5′-CCACTGTGGTCTGGGAAGTT-3′, and SMCT2, forward 5′-GAGAGCTTGTTGCTGTTCCC-3′ and reverse 5′-GGAGTGGCTTAAGCTTGCAC-3′. The PCR reaction mixtures contained 200 μM concentrations of each dNTP, 0.1 μM concentrations of each forward and reverse primer, and 0.5 U/reaction Taq DNA polymerase in 1× PCR buffer (500 mM KCl, 100 mM Tris-HCl, pH 8.3, and 15 mM MgCl2) through 35 cycles of 94°C for 0.5 min, 60°C for 0.5 min, and 72°C for 0.5 min. The PCR products were separated by electrophoresis on 2% agarose gel, stained by ethidium bromide, and visualized under UV light.
Data Analysis. The uptake data are presented as the mean ± S.D. Data analysis was performed using GraphPad Prism (GraphPad Software Inc., San Diego, CA). Differences with p < 0.05 were considered statistically significant. The pH dependence of GHB uptake in the presence and absence of sodium was analyzed by a two-way ANOVA with a Bonferroni post-test. The uptake kinetic parameters, Michaelis-Menten constant (Km), and maximum velocity (Vmax), as well as the diffusional clearance (P), were determined by fitting the data using weighted nonlinear regression analysis (WinNonlin 5.0; Pharsight, Mountain View, CA) and eqs. 1 through 4:
 |
(1) |
 |
(2) |
 |
(3) |
 |
(4) |
where v is the uptake rate of GHB, C is the concentration of GHB, and P is the nonsaturable diffusion uptake clearance. The goodness of fit was determined by the sum of the squared derivatives, the residual plot, and the Akaike information criterion (AIC). The equation that provided the smallest coefficient of variation percentage and AIC was used for obtaining Km, Vmax, and P parameters for the uptake data.
The percentage of inhibition was calculated using eq. 5. The inhibition of GHB uptake by selected inhibitors (IC50) was calculated by fitting eq. 6 using weighted nonlinear regression analysis (WinNonlin 5.0):
 |
(5) |
 |
(6) |
where vNa+ is the uptake rate of GHB in the presence of sodium, vInh is the uptake rate of GHB in the presence of both sodium and inhibitors, and vNa– is the uptake rate of GHB in the absence of sodium. F is the percentage of sodium-dependent uptake rate of GHB in the presence of inhibitors compared with the control and C is the concentration of inhibitors, Imax is the maximum percentage of inhibition, IC50 is concentration of inhibitor that provides 50% of maximal inhibition, and r is the Hill coefficient. The goodness of fit was determined by the sum of the squared derivatives, the residual plot, and the AIC.
Results
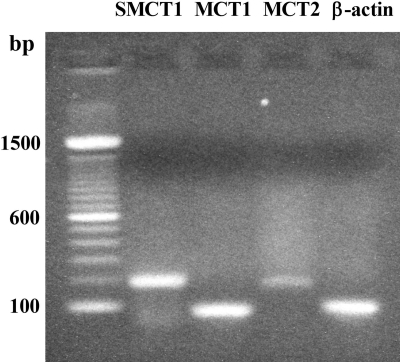
Gene Expression of SMCT and MCT Isoforms in FRTL-5 Cells. The gene expression of SMCT1, SMCT2, and MCT1–4 isoforms in FRTL-5 cells was examined by RT-PCR with specific primers designed for each gene. Results showed that mRNAs of SMCT1, MCT1, and MCT2 were expressed in FRTL-5 cells (Fig. 1). mRNAs for SMCT2, MCT3, and MCT4 were not detected.
Fig. 1.
mRNA expression of SMCT1, MCT1, and MCT2 in FRTL-5 cells. Studies were performed as described under Materials and Methods. bp, base pairs.
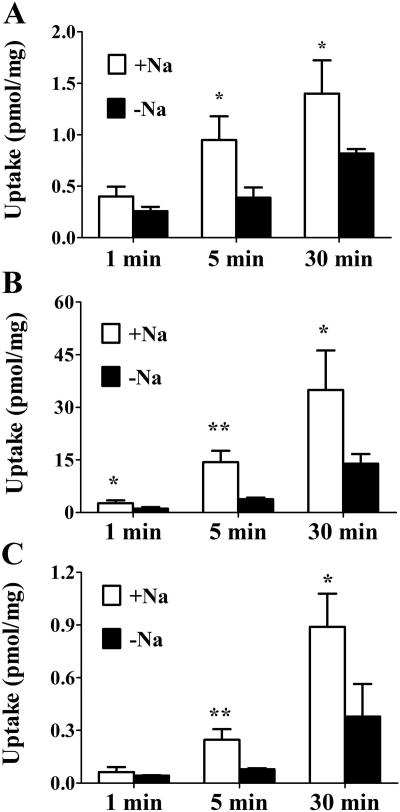
Effect of Sodium on Cellular Uptake of d-Lactate, Butyrate, and GHB. To study the effect of sodium on the cellular uptake of known SMCT1 substrates d-lactate and butyrate, FRTL-5 cells were incubated with 100 nM [3H]d-lactate or 1 μM[14C]butyrate for 1, 5, and 30 min in the presence or absence of sodium at pH 7.4. Compared with the Na+-free condition, the uptake of d-lactate and butyrate in the presence of sodium is higher at 5 and 30 min for both compounds (Fig. 2A for d-lactate; Fig. 2B for butyrate). Likewise, uptake of 20 nM [3H]GHB was significantly higher in the presence of sodium than for the sodium-free condition at 5 and 30 min.
Fig. 2.
Effect of sodium on the cellular uptake of d-lactate, butyrate, and GHB. FRTL-5 cells were incubated with 100 nM [3H]d-lactate (A), 1 μM[14C]butyrate (B), or 20 nM [3H]GHB (C) for 1, 5, and 30 min in the presence (□) or absence (▪) of sodium at pH 7.4. Uptake values were normalized by protein concentration. Results are presented as the mean ± S.D. The experiment was repeated three times with triplicate determinations in each experiment. Statistical analysis by a Student's t test: *, p < 0.05; **, p < 0.01, compared with uptake in the absence of sodium.
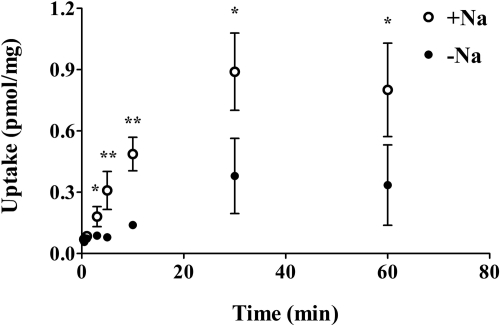
Time Course of GHB Cellular Uptake. FRTL-5 cells were incubated with 20 nM [3H]GHB for up to 60 min at room temperature. The uptake was linear up to 10 min (Fig. 3). Therefore, an incubation time of 5 min was chosen to determine uptake of GHB in all uptake studies.
Fig. 3.
Time course of GHB uptake in FRTL-5 cells. FRTL-5 cells were incubated with 20 nM [3H]GHB for up to 60 min in the presence (○) or absence (•) of sodium at pH 7.4. Uptake values were normalized by protein concentration. Results are presented as the mean ± S.D. The experiment was repeated three times with triplicate determinations in each experiment. Statistical analysis by a Student's t test: *, p < 0.05; **, p < 0.01, compared with uptake in the absence of sodium.
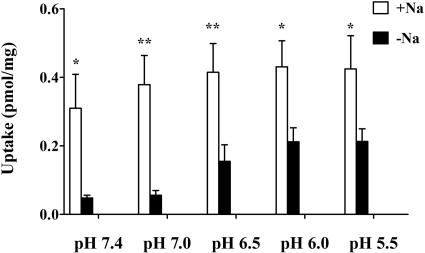
Effect of pH on GHB Uptake. The effect of extracellular pH on GHB uptake by FRTL-5 cells was examined by incubating cells with buffers of different pH (5.5, 6.0, 6.5, 7.0, and 7.4) containing 20 nM [3H]GHB for 5 min in the presence and absence of sodium (Fig. 4). The two-way ANOVA indicated that both sodium and pH affect uptake of GHB in the FRTL-5 cells with no significant interaction between the effects of sodium and pH. In the presence of sodium, the uptake rates at different pH values are not significantly different. However, in the absence of sodium, FRTL-5 cells exhibited increased GHB uptake when pH was decreased. The uptake rates at pH values less than 6.5 were significantly greater than that at pH 7.4. For all the pH values examined in this study, uptake in the presence of sodium is significantly higher than that for the sodium-free condition.
Fig. 4.
Effect of pH on GHB uptake in FRTL-5 cells. Studies were performed using buffers at various pH values (pH 5.5, 6.0, 6.5, 7.0, and 7.4) with uptake determined at 5 min. In the absence of sodium, the cellular uptake at pH 6.5, 6.0, and 5.5 are significantly higher than that at pH 7.4 (p < 0.05). Each bar represents the mean ± S.D. of three experiments, each performed in triplicate. Statistical analysis by a two-way ANOVA: *, p < 0.05; **, p < 0.01, compared with uptake in the absence of sodium.
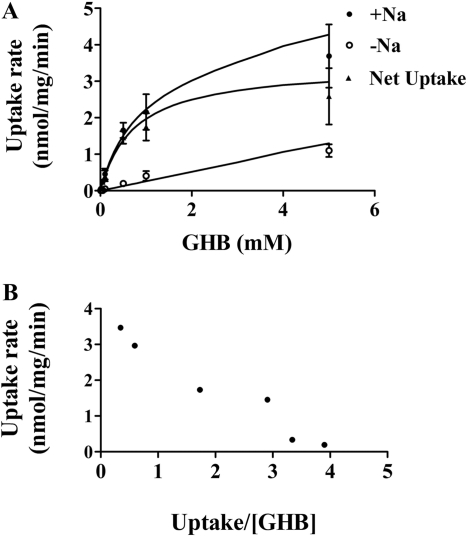
The concentration dependence for GHB uptake was determined over a range of GHB concentrations (1 μM–10 mM) with uptake determined at 5 min and extracellular pH of 7.4. The uptake of GHB exhibited typical Michaelis-Menten kinetics in the presence of sodium and exhibited linear uptake in the absence of sodium (Fig. 5A). The uptake data obtained in the presence and absence of sodium were fitted to eqs. 1 through 4. We also determined the net uptake values for GHB in the presence of sodium by subtracting the values in the absence of sodium and fitted the net uptake data with eqs. 1 through 4. The total uptake values were best fitted with eq. 2, and the net uptake data were best fitted with eq. 1, suggesting only one major transporter mediates GHB uptake in FRTL-5 cells in the presence of sodium (137 mM) at pH 7.4. The kinetic parameters (Km 0.68 ± 0.30 mM, Vmax 3.50 ± 1.58 nmol · mg–1 · min–1, and diffusional clearance of 0.25 ± 0.08 μl · mg–1 · min–1) were obtained by simultaneously fitting the uptake data obtained in the presence and absence of sodium to eqs. 2 and 3. The data were also plotted using an Eadee-Hofstee plot (Fig. 5B). The linearity observed with this plot also suggested a single transporter-mediated process.
Fig. 5.
Concentration-dependent GHB uptake in FRTL-5 cells. Studies were performed at pH 7.4 with uptake determined at 5 min. A, the uptake data, obtained at various GHB concentrations, were best fitted to the eq. 2, as described under Materials and Methods. Data are expressed as the mean ± S.D. of three experiments, with each experiment performed in triplicate. The symbols represent observed data and the lines represent the best fit of the data. B, Eadee-Hofstee plot of the data.
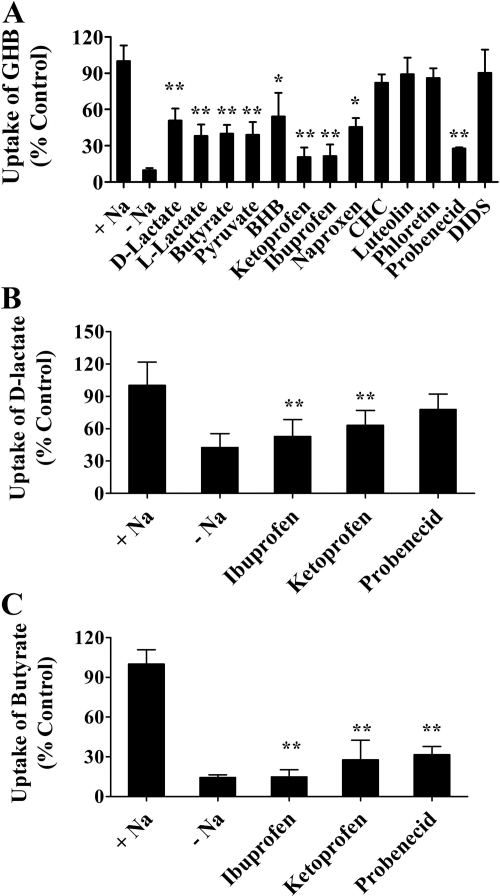
Effect of Inhibitors on Sodium-Dependent GHB Uptake. The inhibitory effects of selected compounds on GHB uptake by FRTL-5 cells were assessed at pH 7.4 in the presence of sodium. The cells were incubated with 10 μM[3H]GHB in the presence or absence of 1 mM d-lactate, l-lactate, butyrate, pyruvate, BHB, ketoprofen, ibuprofen, naproxen, CHC, probenecid, or DIDS or with 0.05 mM luteolin or 0.25 mM phloretin. Uptake in the presence of sodium-containing buffer (without inhibitors) was used as the control. All uptake results are presented as percentage of control (Fig. 6A). GHB uptake was significantly inhibited by d-lactate, l-lactate, butyrate, pyruvate, BHB, ketoprofen, ibuprofen, naproxen, and probenecid. MCT inhibitors CHC, luteolin, and phloretin and the anion exchanger inhibitor DIDS had no inhibitory effect on GHB uptake in FRTL-5 cells. Effects of ibuprofen, ketoprofen, and probenecid on the uptake of d-lactate and butyrate in FRTL-5 cells were also examined. Uptake of d-lactate was significantly inhibited by ketoprofen and ibuprofen (Fig. 6B). All three inhibitors significantly inhibited butyrate uptake (Fig. 6C).
Fig. 6.
Effect of inhibitors on the uptake of GHB (A), d-lactate (B), and butyrate (C) by FRTL-5 cells. The uptake studies were conducted at pH 7.4 in the presence of sodium with an uptake time of 5 min. The concentration of GHB was 10 μM, and the concentration of all inhibitors was 1 mM, except for phloretin (0.25 mM) and luteolin (0.05 mM). The uptake values were normalized to that in the presence of sodium and without inhibitors. The data are presented as the mean ± S.D. The experiments were repeated three times with triplicate determinations for each experiment. One-way ANOVA followed by Dunnett's test was used for statistical analysis: *, p < 0.05; **, p < 0.01.
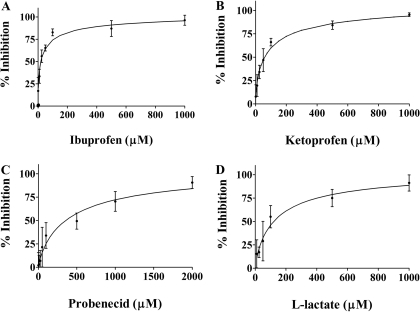
Concentration-dependent inhibition of GHB (10 μM) uptake was demonstrated for ibuprofen (Fig. 7A), ketoprofen (Fig. 7B), probenecid (Fig. 7C), and l-lactate (Fig. 7D). FRTL-5 cells were incubated with 10 μM[3H]GHB in the presence of inhibitors for 5 min. The percent inhibition and IC50 values were calculated using eqs. 5 and 6. IC50 values were 31.6 ± 19.7, 64.4 ± 23.4, 380 ± 43.4, and 101 ± 37.3 μM (mean ± S.D., n = 3) for ketoprofen, ibuprofen, probenecid, and l-lactate, respectively.
Fig. 7.
Concentration-dependent inhibition of GHB uptake by ibuprofen (A), ketoprofen (B), probenecid (C), and l-lactate (D). The symbols represent observed data, and the lines represent the fitted data. The uptake results were normalized by the control values (uptake in the presence of sodium and absence of inhibitors). Uptake in the absence of sodium has been subtracted from the values. The uptake studies were conducted at pH 7.4 and room temperature, and the uptake time was 5 min. The concentration of GHB used was 10 μM. The experiments were repeated three times with triplicate determinations for each experiment. The data are presented as the mean ± S.D. for one representative experiment.
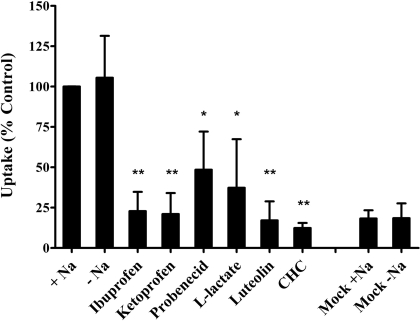
Effect of Inhibitors on GHB Uptake in Rat MCT1 Gene-Transfected Cells. Expression of MCT1 protein and transport of GHB in MCT1 gene-transfected MDA-MB231 cells have been demonstrated previously (Wang et al., 2006). In this study, effects of SMCT1 inhibitors on MCT1-mediated GHB (5 μM) uptake were examined for ibuprofen, ketoprofen, probenecid, and l-lactate. The uptake was determined by incubation of cells with [3H]GHB (5 μM) for 1 min at an external buffer pH of 6.0. Consistent with a previous report (Wang et al., 2006), GHB uptake was significantly increased in MCT1-transfected cells compared with mock-transfected cells, and the up-take was not affected by sodium. MCT1 inhibitors CHC (1 mM) and luteolin (50 μM) significantly reduced GHB uptake in MCT1-transfected cells. The four SMCT1 inhibitors ibuprofen, ketoprofen, probenecid, and l-lactate also significantly decreased uptake of GHB in MCT1 gene-transfected cells (Fig. 8).
Fig. 8.
Effect of SMCT1 inhibitors on GHB uptake in rat MCT1 gene-transfected MDA-MB231 cells. The uptake results were normalized by the control values (uptake by MCT1 gene-transfected cells in the presence of sodium and absence of inhibitors). The uptake studies were conducted at pH 6.0, and the uptake time was 1 min. The concentration of GHB used was 5 μM, and the concentration of the inhibitors was 1 mM, except for luteolin (0.05 mM). The experiments were repeated three times, with triplicate determinations for each experiment. The data are presented as the mean ± S.D. for one representative experiment. Statistical analysis by Student's t test: *, p < 0.05; **, p < 0.01; compared with the control.
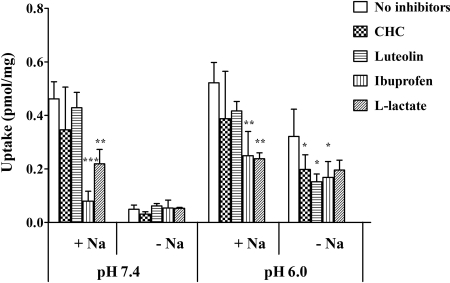
Effect of Inhibitors on GHB Uptake at Different pH Values in FRTL-5 Cells. To investigate the transport mechanism of GHB by FRTL-5 cells, effect of inhibitors were examined at pH 6.0 and 7.4 for CHC, luteolin, ibuprofen, and l-lactate (Fig. 9). At pH 7.4, 90% of uptake was blocked in the absence of sodium compared with that under sodium-containing conditions, and the uptake was not further reduced by inhibitors. In the presence of sodium, uptake of GHB was significantly reduced by ibuprofen and l-lactate but not affected by CHC and luteolin. At pH 6.0, GHB uptake with the sodium-free buffer was reduced by 39%, on average, compared with that under sodium-containing conditions. Likewise, the uptake of GHB was significantly reduced by ibuprofen and l-lactate in the presence of sodium. In the absence of sodium, uptake was decreased to similar levels by all four inhibitors. However, only inhibition by CHC, luteolin, and ibuprofen was statistically significant.
Fig. 9.
Effect of inhibitors on GHB uptake by FRTL-5 cells at pH 6.0 and pH 7.4. The uptake studies were conducted at room temperature, and the uptake time was 5 min. The concentration of GHB was 10 μM, and the concentrations of inhibitors were 1 mM except for luteolin (0.05 mM). The data are presented as the mean ± S.D. The experiments were repeated three times with triplicate determinations for each experiment. Statistical analysis by Student's t test: *, p < 0.05; **, p < 0.01; ***, p < 0.001, compared with the controls (uptake in the presence of sodium and absence of inhibitors at pH 6.0 or pH 7.4).
Discussion
MCTs and SMCTs are the two plasma membrane transporter families known to mediate the cellular uptake of monocarboxylic acids. MCTs belong to the solute carrier gene family SLC16A, and 14 members of this family have been identified (MCT1–14) (Halestrap and Price, 1999). MCTs mediate transport of monocarboxylates in a proton-dependent manner. SMCTs belong to the SLC5A family, containing two members (SMCT1 and SMCT2) with transport driven by a sodium gradient. Despite the differences in sequence identity and driving force, MCTs and SMCTs have similar substrate specificity (Srinivas et al., 2005). MCT-mediated GHB transport has been extensively characterized using kidney cell lines and kidney membrane vesicles (Wang et al., 2006). In this study we found that GHB, as well as the monocarboxylates d-lactate and butyrate, undergo sodium-dependent uptake by FRTL-5 cells.
In agreement with the literature, our RT-PCR assay detected SMCT1 mRNA in FRTL-5 cells (Paroder et al., 2006). SMCT2 has a more restricted tissue distribution with its expression found mainly in kidney, intestine, and skeletal muscle (Srinivas et al., 2005). Expression of SMCT2 in thyroid tissue has not been reported and was not detected in the FRTL-5 cells in this study. Tissue distribution of MCT isoforms is quite different, with MCT1 exhibiting a ubiquitous expression including thyroid (Morris and Felmlee, 2008). Protein expression of MCT1 in FRTL-5 cells has been reported (Fanelli et al., 2003). Our RT-PCR analysis detected both MCT1 and MCT2 mRNA in FRTL-5 cells.
The driving force study demonstrated that both sodium and proton gradients play a role in GHB uptake by FRTL-5 cells. Sodium dependence of GHB uptake was observed at all pH values with a more pronounced effect at higher pH values. Conflicting results have been reported concerning the effect of pH on SMCT1 activity in heterologous expression systems (Gopal et al., 2004; Paroder et al., 2006). Our study showed that the uptake rate in the presence of sodium is approximately the same in the pH range of 5.5 to 7.4. However, uptake of GHB in the absence of sodium exhibited a pH-dependent pattern with uptake increased when pH is decreased, indicating the possibility of proton-coupled transport. MCTs probably play a role, given that uptake at pH 6.0 was significantly inhibited by CHC, a specific inhibitor of MCTs. However, MCT alone cannot account for all the sodium-independent uptake activity at lower pH values, because CHC failed to inhibit uptake to the same extent as that observed at pH 7.4 in the absence of sodium. The effect may be related to other anion transport systems, the ionization of GHB (pKa 4.72), the pH sensitivity of SMCT1, or the possibility of a change in membrane fluidity. On the other hand, the inhibition study indicated that SMCT1 is the predominant transporter in the absence of a proton gradient. The conclusion was also supported by the concentration-dependent GHB uptake study at pH 7.4, in which uptake was best fitted with a simple Michaelis-Menten equation plus a diffusion component and exhibited apparent linearity in an Eadie-Hofstee plot.
The affinity of various monocarboxylate substrates for SMCT has been determined using an X. laevis oocyte heterogeneous expression system or the mammalian cell line HRPE; both demonstrated Km values in the range of 0.05 to 2 mM (Ganapathy et al., 2008). The Km determined for GHB uptake in our study (0.68 ± 0.30 mM) is similar to a recently reported value for GHB-invoked inward current in X. laevis oocytes expressing hSMCT1 (1.62 mM) (Ganapathy et al., 2008) and is lower than that for rat MCT1-mediated GHB transport in gene-transfected cells (Km 4.6 mM) (Wang et al., 2006). For most of the common monocarboxylate substrates, SMCT1 possesses higher affinity than MCT1 (Halestrap and Price, 1999; Ganapathy et al., 2008).
MCT and SMCT exhibit similar substrate specificity, necessitating the identification of specific inhibitors to discriminate the role of each transporter in drug disposition. Uptake of GHB at pH 7.4 in the presence of sodium was significantly inhibited by the substrates lactate, butyrate, pyruvate, and BHB but not by CHC, phloretin, luteolin, and DIDS. CHC is a known inhibitor of MCT, suggesting that MCTs do not play an important role in the uptake of GHB by FRTL-5 cells at pH 7.4. Luteolin and phloretin are naturally occurring flavonoids with potent inhibitory effects on GHB transport in rat MCT1 gene-transfected cells (Wang and Morris, 2007). In vivo studies have demonstrated that luteolin and l-lactate can increase the renal clearance and total clearance of high-dose GHB in rats, suggesting a potential strategy for the treatment of GHB overdoses (Morris et al., 2005; Wang and Morris, 2007; Wang et al., 2008). The current study indicated that the underlying mechanism for the effect of luteolin and l-lactate may be different: a luteolin-GHB interaction is probably mediated by MCT, whereas l-lactate may inhibit both MCT and SMCT. Probenecid inhibits a wide range of efflux and influx transporters including MCTs, organic anion transporter, organic anion-transporting polypeptide, multidrug resistance-associated protein, and organic cation transporter (Shitara et al., 2005); in this study, probenecid inhibited GHB transport by SMCT1 in FRTL-5 cells. Ibuprofen and other structurally related nonsteroidal anti-inflammatory drugs (NSAIDs) have been reported to inhibit uptake of nicotinate and propionate-invoked currents in mammalian cells or X. laevis oocytes expressing SMCT1. It was suggested that ibuprofen functions as an inhibitor but not substrate of SMCT1 (Itagaki et al., 2006). Our study demonstrated the inhibitory effect of ibuprofen and structurally related NSAIDs on SMCT1-mediated uptake of d-lactate, butyrate, and GHB in FRTL-5 cells. The role of NSAIDs in MCT-mediated transport has not been described previously. To examine the specificity of SMCT1 inhibitors, we later tested their effects on GHB uptake in rat MCT1 gene-transfected MDA-MB231 cells. Both ibuprofen and ketoprofen inhibited MCT1-mediated GHB uptake. Interactions of ibuprofen and ketoprofen with l-lactate and with benzoic acid have been observed in Caco-2 cells and Chinese hamster ovary cells, indicating that NSAIDs, l-lactate, and benzoic acid may represent substrates/inhibitors for a common transporter in these cells (Tamai et al., 1995; Choi et al., 2005). Our results demonstrated that ibuprofen and structurally related NSAIDs inhibited both SMCT1 and MCT1. The inhibition mechanism for each transporter requires further evaluation.
Use of the rat thyroid cell line FRTL-5 in the present study allowed us to characterize the SMCT1-mediated transport of GHB and determine substrates and inhibitors of this transporter. Species differences in substrate affinity have not been extensively studied; however, similar Km values for nicotinate have been reported for human, mouse, and rat SMCT1 (Paroder et al., 2006; Ganapathy et al., 2008). Results from studies using X. laevis oocytes also suggest the same substrate specificity for human and mouse SMCT1 (Gopal et al., 2004, 2005; Ganapathy et al., 2008). The amino acid sequence of SMCT1 is conserved among species (86% similarity between human and rodent) (GeneCards, http://www.genecards.org/index.shtml). In addition, the tissue expression pattern of SMCT1 is also similar between mouse and human (Takebe et al., 2005; Iwanaga et al., 2006; Gopal et al., 2007a). Based on the limited data available, SMCT1 may exhibit similar substrate affinity and tissue distribution in mice, rats, and humans.
In summary, SMCT1 mRNA expression was detected, and the sodium-dependent uptake of GHB, d-lactate, and butyrate was demonstrated in FRTL-5 cells, a model cell system used to evaluate SMCT-mediated transport. Characterization of the driving force, transport kinetics, and inhibition suggested that SMCT1 is the predominant transporter for GHB uptake in FRTL-5 cells in the absence of a proton gradient; whereas MCT isoforms may play a role in the presence of a proton gradient. Both MCT1- and SMCT1-mediated GHB uptake were inhibited by probenecid, ibuprofen, and structurally related NSAIDs, whereas luteolin and CHC are specific MCT1 inhibitors. Findings from the present study indicate the potential importance of SMCT-mediated transport in the disposition of GHB.
Acknowledgments
We acknowledge valuable contributions from Melanie T. Felmlee.
This work was supported by the National Institutes of Health National Institute on Drug Abuse [Grant DA023223].
Article, publication date, and citation information can be found at http://dmd.aspetjournals.org.
doi:10.1124/dmd.109.027169.
ABBREVIATIONS: SMCT, sodium-dependent monocarboxylate transporter; MCT, monocarboxylate transporter; GHB, γ-hydroxybutyrate; TSH, thyroid-stimulating hormone; BHB, β-hydroxybutyrate; CHC, α-cyano-4-hydroxycinnimate; DIDS, 4,4′-diisothiocyanatostilbene-2,2′-disulfonic acid; RT, reverse transcriptase; PCR, polymerase chain reaction; MES, 2-(N-morpholino)ethanesulfonic acid; ANOVA, analysis of variance; AIC, Akaike information criterion; NSAID, nonsteroidal anti-inflammatory drug.
References
- Ambesi-Impiombato FS, Parks LA, and Coon HG (1980) Culture of hormone-dependent functional epithelial cells from rat thyroids. Proc Natl Acad Sci U S A 77 3455–3459. [DOI] [PMC free article] [PubMed] [Google Scholar]
- Arena C and Fung HL (1980) Absorption of sodium γ-hydroxybutyrate and its prodrug gamma-butyrolactone: relationship between in vitro transport and in vivo absorption. J Pharm Sci 69 356–358. [DOI] [PubMed] [Google Scholar]
- Barac-Nieto M, Murer H, and Kinne R (1980) Lactate-sodium cotransport in rat renal brush border membranes. Am J Physiol 239 F496–F506. [DOI] [PubMed] [Google Scholar]
- Beguinot F, Beguinot L, Tramontano D, Duilio C, Formisano S, Bifulco M, Ambesi-Impiombato FS, and Aloj SM (1987) Thyrotropin regulation of membrane lipid fluidity in the FRTL-5 thyroid cell line: its relationship to cell growth and functional activity. J Biol Chem 262 1575–1582. [PubMed] [Google Scholar]
- Choi JS, Jin MJ, and Han HK (2005) Role of monocarboxylic acid transporters in the cellular uptake of NSAIDs. J Pharm Pharmacol 57 1185–1189. [DOI] [PubMed] [Google Scholar]
- Fanelli A, Grollman EF, Wang D, and Philp NJ (2003) MCT1 and its accessory protein CD147 are differentially regulated by TSH in rat thyroid cells. Am J Physiol Endocrinol Metab 285 E1223–E1229. [DOI] [PubMed] [Google Scholar]
- Ferrara SD, Zotti S, Tedeschi L, Frison G, Castagna F, Gallimberti L, Gessa GL, and Palatini P (1992) Pharmacokinetics of γ-hydroxybutyric acid in alcohol dependent patients after single and repeated oral doses. Br J Clin Pharmacol 34 231–235. [DOI] [PMC free article] [PubMed] [Google Scholar]
- Frank H, Gröger N, Diener M, Becker C, Braun T, and Boettger T (2008) Lactaturia and loss of sodium-dependent lactate uptake in the colon of SLC5A8-deficient mice. J Biol Chem 283 24729–24737. [DOI] [PMC free article] [PubMed] [Google Scholar]
- Ganapathy V, Thangaraju M, Gopal E, Martin PM, Itagaki S, Miyauchi S, and Prasad PD (2008) Sodium-coupled monocarboxylate transporters in normal tissues and in cancer. AAPS J 10 193–199. [DOI] [PMC free article] [PubMed] [Google Scholar]
- Gopal E, Fei YJ, Miyauchi S, Zhuang L, Prasad PD, and Ganapathy V (2005) Sodium-coupled and electrogenic transport of B-complex vitamin nicotinic acid by slc5a8, a member of the Na/glucose co-transporter gene family. Biochem J 388 309–316. [DOI] [PMC free article] [PubMed] [Google Scholar]
- Gopal E, Fei YJ, Sugawara M, Miyauchi S, Zhuang L, Martin P, Smith SB, Prasad PD, and Ganapathy V (2004) Expression of slc5a8 in kidney and its role in Na+-coupled transport of lactate. J Biol Chem 279 44522–44532. [DOI] [PubMed] [Google Scholar]
- Gopal E, Miyauchi S, Martin PM, Ananth S, Roon P, Smith SB, and Ganapathy V (2007a) Transport of nicotinate and structurally related compounds by human SMCT1 (SLC5A8) and its relevance to drug transport in the mammalian intestinal tract. Pharm Res 24 575–584. [DOI] [PubMed] [Google Scholar]
- Gopal E, Umapathy NS, Martin PM, Ananth S, Gnana-Prakasam JP, Becker H, Wagner CA, Ganapathy V, and Prasad PD (2007b) Cloning and functional characterization of human SMCT2 (SLC5A12) and expression pattern of the transporter in kidney. Biochim Biophys Acta 1768 2690–2697. [DOI] [PMC free article] [PubMed] [Google Scholar]
- Halestrap AP and Price NT (1999) The proton-linked monocarboxylate transporter (MCT) family: structure, function and regulation. Biochem J 343 (Pt 2): 281–299. [PMC free article] [PubMed] [Google Scholar]
- Itagaki S, Gopal E, Zhuang L, Fei YJ, Miyauchi S, Prasad PD, and Ganapathy V (2006) Interaction of ibuprofen and other structurally related NSAIDs with the sodium-coupled monocarboxylate transporter SMCT1 (SLC5A8). Pharm Res 23 1209–1216. [DOI] [PubMed] [Google Scholar]
- Iwanaga T, Takebe K, Kato I, Karaki S, and Kuwahara A (2006) Cellular expression of monocarboxylate transporters (MCT) in the digestive tract of the mouse, rat, and humans, with special reference to slc5a8. Biomed Res 27 243–254. [DOI] [PubMed] [Google Scholar]
- Lettieri JT and Fung HL (1979) Dose-dependent pharmacokinetics and hypnotic effects of sodium γ-hydroxybutyrate in the rat. J Pharmacol Exp Ther 208 7–11. [PubMed] [Google Scholar]
- Maitre M (1997) The γ-hydroxybutyrate signalling system in brain: organization and functional implications. Prog Neurobiol 51 337–361. [DOI] [PubMed] [Google Scholar]
- Mamelak M, Scharf MB, and Woods M (1986) Treatment of narcolepsy with gamma-hydroxybutyrate: a review of clinical and sleep laboratory findings. Sleep 9 285–289. [DOI] [PubMed] [Google Scholar]
- Martin PM, Gopal E, Ananth S, Zhuang L, Itagaki S, Prasad BM, Smith SB, Prasad PD, and Ganapathy V (2006) Identity of SMCT1 (SLC5A8) as a neuron-specific Na+-coupled transporter for active uptake of l-lactate and ketone bodies in the brain. J Neurochem 98 279–288. [DOI] [PubMed] [Google Scholar]
- Mason PE and Kerns WP 2nd (2002) Gamma hydroxybutyric acid (GHB) intoxication. Acad Emerg Med 9 730–739. [DOI] [PubMed] [Google Scholar]
- Mengual R, Claude-Schlageter MH, Poiree JC, Yagello M, and Sudaka P (1989) Characterization of sodium and pyruvate interactions of the two carrier systems specific of mono- and di- or tricarboxylic acids by renal brush-border membrane vesicles. J Membr Biol 108 197–205. [DOI] [PubMed] [Google Scholar]
- Morris ME and Felmlee MA (2008) Overview of the proton-coupled MCT (SLC16A) family of transporters: characterization, function and role in the transport of the drug of abuse γ-hydroxybutyric acid. AAPS J 10 311–321. [DOI] [PMC free article] [PubMed] [Google Scholar]
- Morris ME, Hu K, and Wang Q (2005) Renal clearance of γ-hydroxybutyric acid in rats: increasing renal elimination as a detoxification strategy. J Pharmacol Exp Ther 313 1194–1202. [DOI] [PubMed] [Google Scholar]
- Palatini P, Tedeschi L, Frison G, Padrini R, Zordan R, Orlando R, Gallimberti L, Gessa GL, and Ferrara SD (1993) Dose-dependent absorption and elimination of γ-hydroxybutyric acid in healthy volunteers. Eur J Clin Pharmacol 45 353–356. [DOI] [PubMed] [Google Scholar]
- Park JY, Helm JF, Zheng W, Ly QP, Hodul PJ, Centeno BA, and Malafa MP (2008) Silencing of the candidate tumor suppressor gene solute carrier family 5 member 8 (SLC5A8) in human pancreatic cancer. Pancreas 36 e32–e39. [DOI] [PubMed] [Google Scholar]
- Paroder V, Spencer SR, Paroder M, Arango D, Schwartz S Jr, Mariadason JM, Augenlicht LH, Eskandari S, and Carrasco N (2006) Na+/monocarboxylate transport (SMCT) protein expression correlates with survival in colon cancer: molecular characterization of SMCT. Proc Natl Acad Sci U S A 103 7270–7275. [DOI] [PMC free article] [PubMed] [Google Scholar]
- Poldrugo F and Addolorato G (1999) The role of γ-hydroxybutyric acid in the treatment of alcoholism: from animal to clinical studies. Alcohol Alcohol 34 15–24. [DOI] [PubMed] [Google Scholar]
- Rodriguez AM, Perron B, Lacroix L, Caillou B, Leblanc G, Schlumberger M, Bidart JM, and Pourcher T (2002) Identification and characterization of a putative human iodide transporter located at the apical membrane of thyrocytes. J Clin Endocrinol Metab 87 3500–3503. [DOI] [PubMed] [Google Scholar]
- Shitara Y, Sato H, and Sugiyama Y (2005) Evaluation of drug-drug interaction in the hepatobiliary and renal transport of drugs. Annu Rev Pharmacol Toxicol 45 689–723. [DOI] [PubMed] [Google Scholar]
- Spanier JA and Drewes LR (2007). Monocarboxylate transporters, in Drug Transporters: Molecular Characterization and Role in Drug Disposition (You G and Morris ME, eds) pp 147–170, Wiley-Interscience, Hoboken.
- Srinivas SR, Gopal E, Zhuang L, Itagaki S, Martin PM, Fei YJ, Ganapathy V, and Prasad PD (2005) Cloning and functional identification of slc5a12 as a sodium-coupled low-affinity transporter for monocarboxylates (SMCT2). Biochem J 392 655–664. [DOI] [PMC free article] [PubMed] [Google Scholar]
- Takebe K, Nio J, Morimatsu M, Karaki S, Kuwahara A, Kato I, and Iwanaga T (2005) Histochemical demonstration of a Na+-coupled transporter for short-chain fatty acids (slc5a8) in the intestine and kidney of the mouse. Biomed Res 26 213–221. [DOI] [PubMed] [Google Scholar]
- Tamai I, Takanaga H, Maeda H, Sai Y, Ogihara T, Higashida H, and Tsuji A (1995) Participation of a proton-cotransporter, MCT1, in the intestinal transport of monocarboxylic acids. Biochem Biophys Res Commun 214 482–489. [DOI] [PubMed] [Google Scholar]
- Tedeschi L, Carai MA, Frison G, Favretto D, Colombo G, Ferrara SD, and Gessa GL (2003) Endogenous γ-hydroxybutyric acid is in the rat, mouse and human gastrointestinal tract. Life Sci 72 2481–2488. [DOI] [PubMed] [Google Scholar]
- Wang Q, Darling IM, and Morris ME (2006) Transport of γ-hydroxybutyrate in rat kidney membrane vesicles: role of monocarboxylate transporters. J Pharmacol Exp Ther 318 751–761. [DOI] [PubMed] [Google Scholar]
- Wang Q and Morris ME (2007) Flavonoids modulate monocarboxylate transporter-1-mediated transport of γ-hydroxybutyrate in vitro and in vivo. Drug Metab Dispos 35 201–208. [DOI] [PubMed] [Google Scholar]
- Wang Q, Wang X, and Morris ME (2008) Effects of l-lactate and d-mannitol on γ-hydroxybutyrate toxicokinetics and toxicodynamics in rats. Drug Metab Dispos 36 2244–2251. [DOI] [PMC free article] [PubMed] [Google Scholar]
- Wong CG, Gibson KM, and Snead OC 3rd (2004) From the street to the brain: neurobiology of the recreational drug γ-hydroxybutyric acid. Trends Pharmacol Sci 25 29–34. [DOI] [PubMed] [Google Scholar]


