Abstract
Tetrahydrocannabinol (Δ9-THC), the primary psychoactive ingredient in marijuana, is subject to cytochrome P450 oxidation and subsequent UDP-glucuronosyltransferase (UGT)-dependent glucuronidation. Many studies have shown that CYP2C9 and CYP3A4 are the primary enzymes responsible for these cytochrome P450-dependent oxidations, but little work has been done to characterize phase II metabolic pathways. In this study, we test the hypothesis that there are specific human UGTs responsible for classic cannabinoid metabolism. The activities of 12 human recombinant UGTs toward classic cannabinoids [cannabinol (CBN), cannabidiol (CBD), (–)-Δ8-THC, (–)-Δ9-THC, (±)-11-hydroxy-Δ9-THC (THC-OH), and (–)-11-nor-9-carboxy-Δ9-THC (THC-COOH)] were evaluated using high-performance liquid chromatography-tandem mass spectrometry and labeling assays. Despite activity by UGT1A1, 1A3, 1A8, 1A9, 1A10, and 2B7 toward CBN, CBD, THC-OH, and THC-COOH, only selected UGTs demonstrate sufficient activity for further characterization of steady-state kinetics. CBN was the most recognized substrate as evidenced by activities from hepatic UGT1A9 and extrahepatic UGT1A7, UGT1A8, and UGT1A10. These results may reflect the introduction of an aromatic ring to Δ9-THC, leading to favorable π stacking with phenylalanines in the UGT active site. Likewise, oxidation of Δ9-THC to THC-OH results in UGT1A9 and UGT1A10 activity toward the cannabinoid. Further oxidation to THC-COOH surprisingly leads to a loss in metabolism by UGT1A9 and UGT1A10, while creating a substrate recognized by UGT1A1 and UGT1A3. The resulting glucuronide of THC-COOH is the main metabolite found in urine, and thus these hepatic enzymes play a critical role in the metabolic clearance of cannabinoids. Taken together, glucuronidation of cannabinoids depends on upstream processing including enzymes such as CYP2C9 and CYP3A4.
Cannabis sativa has been used both therapeutically and recreationally for centuries. Δ9-Tetrahydrocannabinol (Δ9-THC) is the main psychoactive ingredient in marijuana and mediates its effects primarily through activation of two G-protein coupled receptors, CB1 and CB2 (Howlett, 1995). Identified in 1990 (Matsuda et al., 1990), the human CB1 receptor was found to be primarily localized in central and peripheral nervous tissue (Herkenham et al., 1990; Ishac et al., 1996). The CB1 receptor has been identified as a therapeutic target in a variety of disease states, including obesity (Ravinet Tillou et al., 2002), alcohol dependence (Racz et al., 2003), pain (Iversen and Chapman, 2002), and Parkinson's disease (Brotchie, 2003). The second cannabinoid receptor, CB2, cloned in 1993 (Munro et al., 1993) is found in immune tissues, most abundantly in the spleen and leukocytes (Galiègue et al., 1995). Selective CB2 receptor ligands have potential therapeutic use as immune modulators for tumor suppression (Klein et al., 2003) and inflammation (Conti et al., 2002).
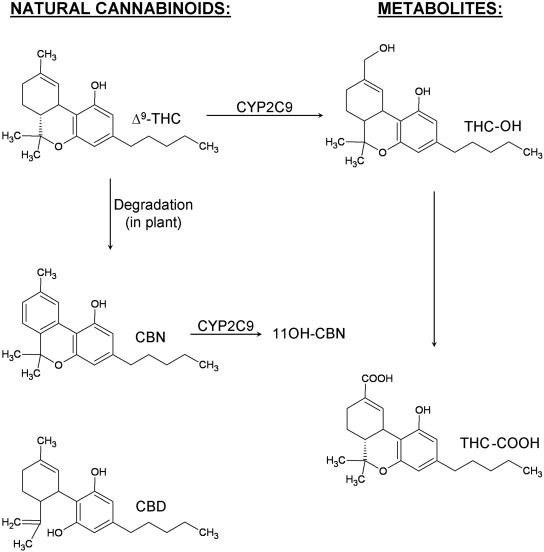
Cannabinoids are defined as compounds that are either structurally similar to THC or ligands that bind to cannabinoid receptors. Whereas THC-related compounds are referred to as classic cannabinoids (Fig. 1), ligands structurally distinct from THC also bind to CB1 and/or CB2 receptors and are classified as nonclassic cannabinoids, aminoalkylindoles, and eicosanoids. The metabolism of the classic cannabinoids (the subject of this study) is very complex. For example, approximately 100 metabolites have thus far been identified for THC. The high lipid solubility of classic cannabinoids makes them good substrates for the cytochrome P450 mixed-function oxidases. Metabolism by CYP2C9 and CYP3A4 seems to account for most of the primary THC metabolites (Watanabe et al., 2007). For example, THC is hydroxylated at C11, at C8, and at all positions of the alkyl side-chain. C11 is the preferred hydroxylation site in man. In humans, CYP2C9 has been shown to catalyze the formation of the psychoactive 11-hydroxy metabolite of Δ9-THC (Bornheim et al., 1992; Watanabe et al., 1995), and CYP3A4 is responsible for hydroxylation at the 8β-position (Bornheim et al., 1992). After the initial hydroxylation, many of the hydroxyl groups undergo further oxidation to primarily produce carboxylic groups at C11 and C5 (alkyl side chain). In contrast to phase I metabolism, very little is known about the phase II metabolism of classic cannabinoids. Phase II metabolites seem to be mainly conjugates of the phase I metabolites with glucuronic acid, catalyzed by the activity of UDP-glucuronosyltransferases (UGTs). For example, oxidation of the active metabolite Δ9-THC-OH (THC-OH) leads to the inactive metabolite 11-nor-9-carboxy-Δ9-THC (THC-COOH). This modification of the cannabinoid also favors conjugation at the carboxyl position to form an O-ester glucuronide, which is the main metabolite found in urine (Yamamoto et al., 1987).
Fig. 1.
Structures of cannabinoids under investigation.
Although phase II metabolism is generally thought of as a pathway to inactivate drugs, it is well known that this pathway may also result in metabolic activation. For example, morpine-6β-glucuronide is a phase II metabolite of morphine that seems to produce equivalent, long-lasting analgesia and has an improved side effect profile relative to that of morphine (Wittwer and Kern, 2006). It has also been shown that the acyl glucuronides of all-trans retinoic acid and its derivatives exhibit significant biological activity. These compounds are less toxic than the parent compound yet retain the ability to drive cell growth, differentiation, and proliferation (Barua and Olson, 1987; Gallup et al., 1987; Janick-Buckner et al., 1991; Blaner and Olson, 1994). Therefore, it is possible that phase II metabolism of cannabinoids might also produce active compounds.
To better understand this metabolic pathway, identification of the human UGTs involved in metabolism of classic cannabinoids and product characterizations are required. Therefore, the purpose of the present study was to characterize potential glucuronidated products produced by human liver microsomes and 12 human recombinant UGTs in the presence of THC derivatives, cannabinol (CBN), cannabidiol (CBD), (–)-Δ9-THC, (±)-11-hydroxy-Δ9-THC (THC-OH), and (–)-11-nor-9-carboxy-Δ9-THC (THC-COOH). Data show that both hepatic and extrahepatic UGTs selectively recognize certain cannabinoids for conjugation.
Materials and Methods
Materials. All chemicals used for this study were of at least reagent grade. Cannabinol, cannabidiol, (–)-Δ9-THC, (±)-11-hydroxy-Δ9-THC, and (–)-11-nor-9-carboxy-Δ9-THC were purchased from Cerilliant (Round Rock, TX). [14C]UDP-GlcUA (325 mCi/mmol) was purchased from PerkinElmer Life and Analytical Sciences (Waltham, MA). Ethyl alcohol (95%) was purchased from AAPER Alcohol and Chemical (Shelbyville, KY). Unless otherwise specified, all other chemicals and reagents were purchased from Sigma-Aldrich (St. Louis, MO).
Membrane fractions from baculovirus-infected insect cells expressing individual recombinant human UGTs were prepared as described previously (Kurkela et al., 2003; Kuuranne et al., 2003). Each enzyme tested in this study is known to be active toward substrates specific for that isoform. The expression level of individual recombinant UGTs was estimated by Western blot analyses using monoclonal antibodies (Tetra-His antibodies; QIAGEN GmbH, Hilden, Germany) against the His-tag that all of them carry (Kurkela et al., 2003). For activity comparison between individual UGTs, the enzyme level was normalized as described previously (Kuuranne et al., 2003).
Recombinant UGT Isoform Incubations. UGT activity was determined using [14C]-UDP-GlcUA as the sugar donor for thin-layer chromatography (TLC) analysis (Little et al., 2004) and unlabeled UDP-GlcUA for LC-MS/MS analysis. In brief, UGT recombinant membrane protein (5 μg) was incubated in 100 μM Tris-HCl (pH 7.4)/5 mM MgCl2/5 mM saccharolactone with 100 to 2000 μM substrate, in a total volume of 30 μl. Substrates were added in dimethyl sulfoxide with a final concentration of 2%, and controls omitting substrates were run with each assay. Reactions were started by the addition of the appropriate UDP-GlcUA cosubstrate (4 mM) and incubated at 37°C for 90 min (screening) and 30 min (kinetics). Reactions were stopped by addition of 40 μl of ethanol.
TLC Analysis. TLC analysis of glucuronidation products formed from [14C]UDP-GlcUA was performed as described previously (Radomińska-Pyrek et al., 1987). In brief, aliquots (60 μl) of each incubation were applied to the preabsorbent layer of channeled silica gel TLC plates [Baker 250Si-PA (19C); VWR Scientific, Sugarland, TX], and glucuronidated products and unreacted substrate were separated by development in chloroform-methanol-glacial acetic acid-water (65:25:2:4, v/v). Radioactive compounds were localized on TLC plates by autoradiography for 3 to 4 days at –80°C. Silica gel in areas corresponding to the glucuronide bands identified from autoradiograms and the corresponding areas from control lanes were scraped from the TLC plate into scintillation vials, and the radioactivity was measured by liquid scintillation counting (Packard Tri-Carb 2100TR; Perkin-Elmer Life and Analytical Sciences). The results of these experiments were analyzed, and apparent kinetic parameters were determined using GraphPad Prism 4 software (GraphPad Software Inc., San Diego, CA).
LC-MS/MS Analysis. LC-MS/MS analyses for product confirmation were performed using an Agilent 1100 HPLC system (Agilent Technologies, Santa Clara, CA), which was interfaced with an API 4000 triple quadrupole (MS/MS) mass spectrometer (Applied Biosystems, Foster City, CA). Instrument operation and data acquisition were controlled through the Analyst software package (version 1.4.2; Applied Biosystems). The HPLC system consisted of an autosampler, a binary pump, and a column oven. Samples were loaded and resolved at a flow rate of 0.25 ml/min on a 4.0 × 50 mm phenyl column (YMC Phenyl 3 μm; Waters, Milford, MA) maintained at 40°C. Mobile phases were 5 mM ammonium acetate (pH 6.5) in water (A) and acetonitrile (B). Compounds of interest were eluted using the following gradient: 50% B (0 min), linear gradient from 50% B to 60% B (0–2 min), linear gradient from 60% B to 90% B (2–3 min), linear gradient from 90% B to 100% B (3–4.1 min), 100% B (4.1–7.9 min), linear gradient from 100% B to 50% B (7.9–8 min), and 50% B (8.0 min and after). Total run time, including a 2-min column pre-equilibration period, was 15 min. Injection volume was 5 μl. All MS/MS analyses were performed in negative ion mode by electrospray ionization using a TurboIonSpray source. Curtain, nebulizer, turbo, and collisionally activated dissociation gases were 40, 50, 65, and 6 psig, respectively. Turbo heater temperature was 450°C, and ion spray voltage was –4500 V. Specific MS/MS experimental conditions are noted in Table 1.
TABLE 1.
MS/MS experimental conditions for product ion, multiple reaction monitoring, and neutral loss studies
| Analyte | Q1 | Q3 | CE | EP | DP | CXP | |
|---|---|---|---|---|---|---|---|
| m/z | V | ||||||
| Product ion | |||||||
| 1 | CBN-Gluc | 485.1 | 50-525 | -20 to -35 | -10 | -50 to -70 | -9 to -15 (2 s) |
| 2 | THC-O-Gluc | 505.3 | 50-510 | -30 to -40 | -10 | -50 to -70 | -9 |
| 3 | THC-COO-Gluc | 519.3 | 50-525 | -30 to -40 | -10 | -50 to -70 | -9 |
| MRM | |||||||
| 1 | CBN | 309.3 | 171.1 | -40 | -10 | -89 | -3 |
| 309.3 | 279.2 | -42 | -10 | -91 | -7 | ||
| 2 | Δ9-THC and CBD | 313.3 | 191.2 | -38 | -10 | -87 | -3 |
| 313.3 | 245.3 | -36 | -10 | -82 | -5 | ||
| 3 | THC-OH | 329.3 | 268.3 | -38 | -10 | -69 | -6 |
| 329.3 | 311.2 | -25 | -10 | -65 | -8 | ||
| 4 | THC-COOH | 343.2 | 245.2 | -40 | -10 | -82 | -5 |
| 343.2 | 299.3 | -29 | -10 | -75 | -7 | ||
| 5 | CBN-Gluc | 485.1 | 113.2 | -29 | -10 | -61 | -8 |
| 485.1 | 309.2 | -27 | -10 | -76 | -8 | ||
| 6 | Δ9-THC-Gluc and CBD-Gluc | 489.3 | 313.1 | -35 | -10 | -61 | -8 |
| 489.3 | 374.9 | -30 | -10 | -76 | -9 | ||
| 7 | THC-O-Gluc | 505.3 | 311.2 | -44 | -10 | -56 | -8 |
| 505.3 | 329.2 | -31 | -10 | -59 | -8 | ||
| 8 | THC-COO-Gluc | 519.3 | 193.2 | -25 | -10 | -47 | -8 |
| 519.3 | 343.3 | -33 | -10 | -36 | -9 | ||
| Neutral | Loss of 176 | ||||||
| Loss | |||||||
| 1 | Loss of glucuronic acid | (400-800 amu) | -20 to -35 | -10 | -50 to -80 | -9 to -15 (2 s) | |
CE, collision energy; EP, entrance potential; DP, declustering potential; CXP, collision cell exit potential; Gluc, glucuronide; MRM, multiple reaction monitoring.
Results
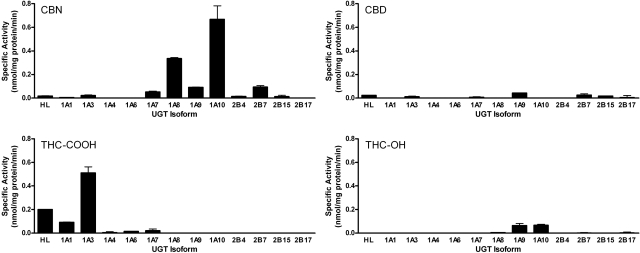
Cannabinoid Glucuronidation by Human Hepatic Microsomes and Recombinant UGTs. As an initial screen for glucuronidation activity toward cannabinoids, eight human recombinant UGT1A family UGTs expressed as His-tag proteins in baculovirus-infected Sf9 insect cells, four human recombinant UGT2B family overexpressed in HEK293 cells, and human liver microsomes were evaluated for their ability to glucuronidate 750 μM THC, CBN, CBD, (–)-Δ9-THC, THC-OH, or THC-COOH. (–)-Δ9-THC did not appear to serve as a direct substrate for the human UGTs that were tested. This information indicates that native THC biotransformation is dependent on oxidations primarily catalyzed by CYP2C9 and CYP3A4 (Watanabe et al., 2007). UGT1A and UGT1B family isozymes showed variable responses in the presence of THC-OH, THC-COOH, CBN, and CBD (Fig. 2). The major product of CYP2C9 metabolism, THC-OH, was specifically glucuronidated via UGT1A9 and UGT1A10. The highest activity toward THC-COOH was observed with UGT1A3, but HLMs and UGT1A1 also showed a significant amount of activity toward this substrate. CBN, the product of THC degradation, was glucuronidated at high levels by UGT1A10 and to a lesser extent by UGT1A7, UGT1A9, and UGT2B7. Activity toward CBD was limited. HLMs and UGT1A9, UGT2B7, and UGT2B17 all formed a minimal amount of a glucuronidated CBD product.
Fig. 2.
Glucuronidation activity screening. Selected recombinant UGT isoforms and human liver microsomes were screened for activity toward CBN, THC-OH, THC-COOH, and CBD. Glucuronidation activities were measured by incubating microsomal protein [5 μg of recombinant UGT; 50 μg of human liver (HL)] with 500 μM substrate and 4 mM UDP-GlcUA. All reactions were normalized as described under Materials and Methods.
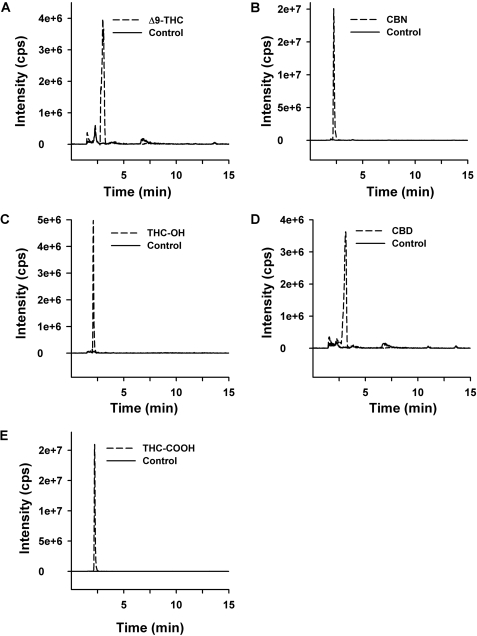
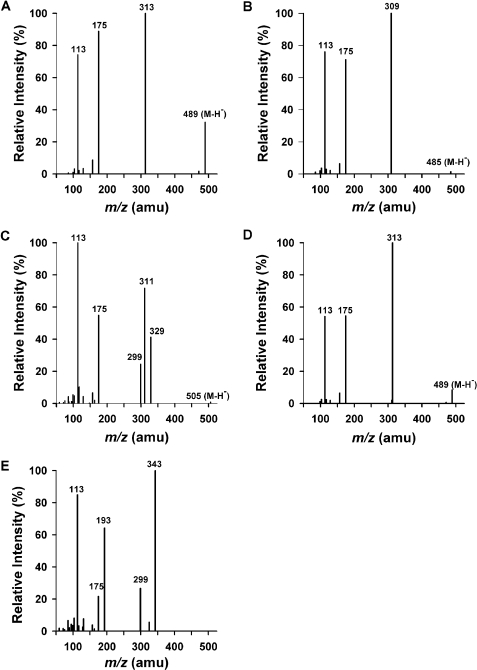
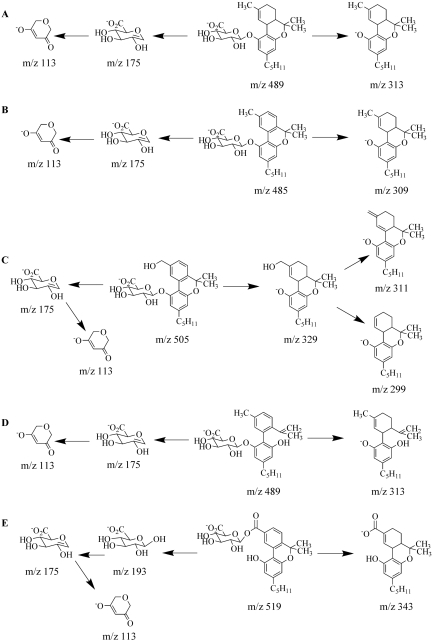
Product Confirmations/MS Spectral Interpretation. Even though some substrates did not appear to react during the initial screens (Fig. 2), LC-MS/MS confirmed that all of the substrates tested served as substrates for human UGTs (Fig. 3). Trace amounts of glucuronidated product were detected for all of the substrates, but in some cases, for which kinetic information could not be obtained, the physiological significance remains to be determined. MS/MS chromatographs show predicted glucuronidated metabolites eluting within 2 min (Fig. 3), and the corresponding MS/MS spectra have signals consistent with predicted glucuronidated metabolites (Figs. 4 and 5). The presence of m/z fragments of 313, 309, 343, and 313 in respective reactions suggest the loss of glucuronic acid. Because glucuronidated metabolites demonstrate a propensity to undergo in-source fragmentation during MS/MS analysis, multiple reaction monitoring experiments (data not shown) and neutral loss studies (data not shown) were designed to assess whether additional metabolites were formed but not identified during product ion scans. Neither study identified metabolites other than those observed in product ion scans (Fig. 3). In particular, the presence of bis- and/or diglucuronidated products was not detected. Multiple reaction monitoring studies showed a small degree of in-source fragmentation.
Fig. 3.
Reverse-phase HPLC chromatographs of glucuronidated-product ion experiments. Tracings represent organic-soluble metabolites generated during incubation of recombinant protein with 4 mM UDP-glucuronic acid and 750 μM of each substrate (A, Δ9-THC; B, CBN; C, THC-OH; D, CBD; E, THC-COOH). Each substrate was incubated individually for 180 min. Control reactions omitted the respective substrate. MS/MS data were obtained in negative ion mode, as described under Materials and Methods.
Fig. 4.
MS/MS spectra of the glucuronides of (A) Δ9-THC, (B) CBN, (C) THC-OH, (D) CBD, and (E) THC-COOH. Spectra are representative of the glucuronidated products shown in Fig. 3. Data were obtained in negative ion mode as described under Materials and Methods.
Fig. 5.
Proposed MS/MS fragmentation pathways for Δ9-THC (A), CBN (B), THC-OH (C), CBD (D), and THC-COOH (E) glucuronides.
Definite regiochemical assignments can be made for the (–)-Δ9-THC-(C1)-glucuronide, the CBN-(C1)-glucuronide, and the CBD-(C1)-glucuronide. C1 of (–)-Δ9-THC and C1 of CBN are the only active sites that are recognized by UGTs (Fig. 1). CBD contains two hydroxyl groups at the C1 and C5 positions (Fig. 1). However, the C1 and C5 hydroxyl groups are identical because of free rotation about the bond at C6, and because no diglucuronidation was detected, there is only one possible glucuronide product. Although MS/MS data conclusively identified glucuronidated products for THC-OH and THC-COOH, exact regiochemical assignments are complex because multiple reaction sites exist on these substrates and base product ions in mass spectra represent the loss of glucuronic acid. Additional information regarding regiochemistry of glucuronidation can be determined from fragments derived from the glucuronic acid moiety (Wen et al., 2007). Alcoholic and phenolic glucuronides are known to fragment by specific pathways, yielding ions of m/z 175 and 113 for phenolic glucuronides and of m/z 193, 175, and 113 for alcoholic glucuronides. The MS/MS spectrum of THC-OH glucuronide (Fig. 4) showing the absence of m/z 193 indicates that the site of glucuronidation is on the phenolic OH group. Likewise, the presence of the m/z 193 peak for THC-COOH (Fig. 4) provides supporting evidence for glucuronidation of the carboxylate group.
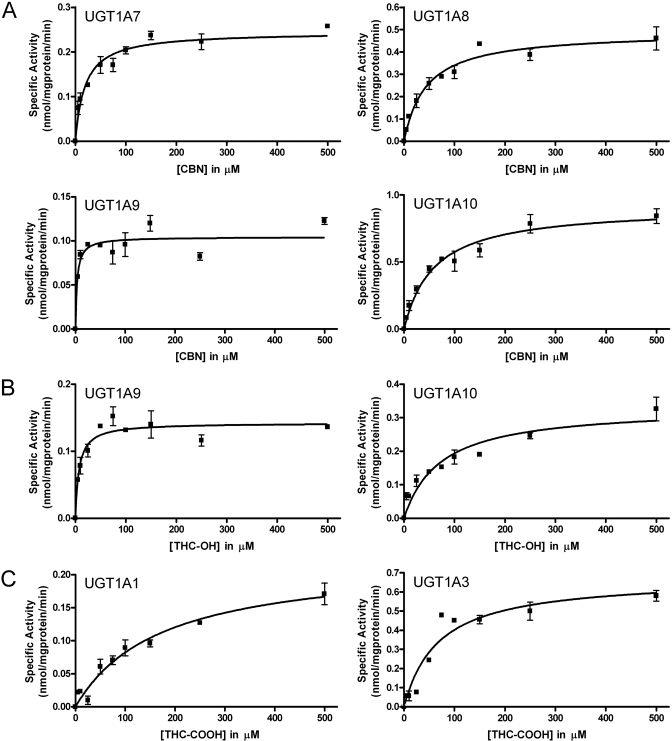
Steady-State Kinetics for Cannabinoid Glucuronidation by Recombinant UGTs. Based on our specific activity screen, we subjected selected UGTs to further catalytic studies to determine the respective steady-state parameters for cannabinoid glucuronidation (Fig. 6; Table 2). Despite MS characterizations confirming the glucuronide production for (–)-Δ9-THC and CBD by UGT1A10 and UGT1A9, the sensitivity of TLC assessments was not adequate to obtain kinetic measurements. We were more successful with other enzymatic reactions. CBN undergoes glucuronidation by four different UGTs with a 17-fold variation in substrate binding. Hepatic UGT1A9 displays the lowest Km for CBN, whereas the extrahepatic enzymes, UGT1A7, UGT1A8, and UGT1A10, bound substrate more weakly based on higher Km values. UGT1A9 and UGT1A10 also glucuronidate THC-OH with affinities similar to those observed for CBN. Despite differences in structures, CBN and THC-OH undergo glucuronidation at similar rates by UGT1A9. In contrast, UGT1A10 was 3-fold more effective at CBN conjugation than THC-OH. Although hepatic UGT1A1 and UGT1A3 demonstrate the only measurable activity toward THC-COOH, these enzymes recognize the substrate more weakly than was observed for the other reactions.
Fig. 6.
Steady-state glucuronidation of CBN (A), THC-OH (B), and THC-COOH (C) with selected recombinant UGT isoforms. Glucuronidation activities of recombinant proteins were measured by incubating membrane fractions containing recombinant UGT1A10 (5 μg) with increasing concentrations (shown in the figure) of substrate at a constant concentration of UDP-GlcUA (4 mM). Curve fits and kinetic constants were determined using GraphPad Prism 4 software, and the resulting parameters are included in Table 2.
TABLE 2.
Steady-state parameters for glucuronidation of CBN, THC-OH, and THC-COOH by UGT isoforms
Parameters were determined from the fit of initial velocities to a Michaelis-Menten kinetic scheme using GraphPad Prism 4.
| Substrate | UGT Isoforma | Vmax | Km | Vmax/Km |
|---|---|---|---|---|
| nmol/mg protein/min | μM | μl/mg protein/min | ||
| CBN | UGT1A7 | 0.24 ± 0.01 | 19 ± 3.9 | 12.6 |
| UGT1A8 | 0.49 ± 0.03 | 44 ± 8.1 | 11.1 | |
| UGT1A9 | 0.10 ± 0.01 | 3.4 ± 1.3 | 29.4 | |
| UGT1A10 | 0.91 ± 0.05 | 59 ± 10 | 15.4 | |
| THC-OH | UGT1A9 | 0.14 ± 0.01 | 7.3 ± 1.9 | 19.2 |
| UGT1A10 | 0.33 ± 0.03 | 72 ± 19 | 4.58 | |
| THC-COOH | UGT1A1 | 0.22 ± 0.02 | 170 ± 37 | 1.29 |
| UGT1A3 | 0.68 ± 0.06 | 68 ± 17 | 10.0 |
All reactions were normalized as described under Materials and Methods.
Discussion
Phase I oxidation and phase II conjugation of Δ9-THC are generally accepted as important detoxification and excretion processes; however, the impact of these metabolic steps may be more complex than currently appreciated. This study begins the characterization of specific human isozymes involved in glucuronidation of classic cannabinoids as well as the characterization of products formed during these reactions. This is the first demonstration that several cannabinoids serve as substrates for specific human UGTs and HLMs and that classic cannabinoid metabolism seems to be tissue-specific.
LC-MS/MS analysis of product mixtures confirms that glucuronide conjugation does indeed occur for all classic cannabinoids tested. Product ion scans of the desired monoglucuronides provide MS/MS spectra for species with appropriate mass and in most cases allow for specific regiochemistry assignments. Δ9-THC, CBN, and CBD are all glucuronidated at the C1 position. However, the C5 position is equivalent to C1 in CBD because there is free rotation about the chemical bond localized at the C6 position. Regiochemical assignments for THC-OH and THC-COOH are not as straightforward, because these substrates contain multiple reaction sites that can give rise to different glucuronides. Reactions can occur on the carboxyl terminus of THC-COOH, on the allylic side chain of THC-OH, or on the phenolic group that is located in both THC-COOH and THC-OH. Structure comparisons as well as substrate recognition studies suggest that glucuronidation is occurring on the carboxyl terminus and on the phenolic hydroxyl group. Analyses of the mass spectrum are also consistent with these conclusions (Wen et al., 2007).
The extent of cannabinoid glucuronidation ultimately depends upon structural differences among the compounds. Despite the presence of a hydroxyl group at the C1-position, Δ9-THC is not readily recognized as the substrate for glucuronidation unless it is transformed into CBN. This plant-catalyzed process introduces an aromatic ring into the structure of the molecule, which subsequently results in the metabolism of this cannabinoid by hepatic UGT1A9 and the extrahepatic UGTs, UGT1A7, UGT1A8, and UGT1A10. The recognition of CBN by these UGTs probably involves π stacking with active site phenylalanines, such as those identified in the binding motif for UGT1A10 (Xiong et al., 2006). These enzyme-substrate contacts would favor binding and possibly properly orient the molecule for conjugation. The relative impact of substrate recognition is not uniform among the UGTs. For example, UGT1A9 displays the highest affinity for CBN, whereas UGT1A10 has the lowest.
CYP2C9 oxidation of Δ9-THC generates THC-OH, a substrate preferentially metabolized by UGT1A9 but also recognized by UGT1A10. It appears that the additional hydroxyl function group to Δ9-THC provides an alternate site for conjugation and/or alters the binding mode for the cannabinoid to favor UGT catalysis. Further oxidation of THC-OH to THC-COOH surprisingly leads to a loss in metabolism by UGT1A9 and UGT1A10, while creating a substrate recognized by hepatic UGT1A1 and UGT1A3. These UGTs must be better suited to tolerate the introduction of a full negative charge to the cannabinoid. The resulting O-ester glucuronide of THC-COOH is the main metabolite found in urine (Yamamoto et al., 1987), and thus these hepatic enzymes play a critical role in the metabolic clearance of cannabinoids. Taken together, phase II metabolism of cannabinoids depends on upstream processing, including processing by enzymes such as CYP2C9 and CYP3A4 (Watanabe et al., 2007).
This report characterizes human UGTs associated with classic cannabinoid metabolism and provides information that will be necessary to fully explore the importance of this metabolic pathway. This study shows that UGT activity is controlled through specific cytochrome P450 oxidations as well as specific enzyme-substrate mechanisms. Future studies assessing the biological activity of novel metabolites presented in this study may provide insight in developing better pain treatment options and help in our understanding of drug dependence.
Acknowledgments
We thank Mika Kurkela for his technical review and Richard Bonner, Benjamin Jefferson, Suzanne Owen, and Johanna Mosorin for their technical assistance.
This work was supported in part by the National Institutes of Health National Institute of Diabetes and Digestive and Kidney Diseases [Grant DK60109]; the National Institutes of Health National Institute of General Medical Sciences [Grant GM075893]; the Centers for Disease Control and Prevention (Cooperative Agreement U90/CCU616974-07); the Association of Public Health Laboratories (EH Training fellowship); and the Academy of Finland (Project 210933).
Article, publication date, and citation information can be found at http://dmd.aspetjournals.org.
doi:10.1124/dmd.109.026898.
ABBREVIATIONS: Δ9-THC, (–)-Δ9-tetrahydrocannabinol; UGT, uridine diphosphate-glucuronosyltransferase; THC-OH, (±)-11-hydroxy-Δ9-THC; THC-COOH, (–)-11-nor-9-carboxy-Δ9-THC; CBN, cannabinol; CBD, cannabidiol; GlcUA, glucuronic acid; TLC, thin-layer chromatography; LC, liquid chromatography; MS/MS, tandem mass spectrometry; HPLC, high-performance liquid chromatography; HLM, human liver microsome; MS, mass spectrometry.
References
- Barua AB and Olson JA (1987) Chemical synthesis and growth-promoting activity of all-trans-retinyl β-d-glucuronide. Biochem J 244 231–234. [DOI] [PMC free article] [PubMed] [Google Scholar]
- Blaner WS and Olson JA (1994) Retinol and retinoic acid metabolism, in The Retinoids. Biology, Chemistry, and Medicine (Sporn MB, Roberts AB, and Goodman DS eds) pp 229–255, Raven Press, New York.
- Bornheim LM, Lasker JM, and Raucy JL (1992) Human hepatic microsomal metabolism of delta 1-tetrahydrocannabinol. Drug Metab Dispos 20 241–246. [PubMed] [Google Scholar]
- Brotchie JM (2003) CB1 cannabinoid receptor signalling in Parkinson's disease. Curr Opin Pharmacol 3 54–61. [DOI] [PubMed] [Google Scholar]
- Conti S, Costa B, Colleoni M, Parolaro D, and Giagnoni G (2002) Antiinflammatory action of endocannabinoid palmitoylethanolamide and the synthetic cannabinoid nabilone in a model of acute inflammation in the rat. Br J Pharmacol 135 181–187. [DOI] [PMC free article] [PubMed] [Google Scholar]
- Galiègue S, Mary S, Marchand J, Dussossoy D, Carrière D, Carayon P, Bouaboula M, Shire D, Le Fur G, and Casellas P (1995) Expression of central and peripheral cannabinoid receptors in human immune tissues and leukocyte subpopulations. Eur J Biochem 232 54–61. [DOI] [PubMed] [Google Scholar]
- Gallup JM, Barua AB, Furr HC, and Olson JA (1987) Effects of retinoid β-glucuronides and N-retinoyl amines on the differentiation of HL-60 cells in vitro. Proc Soc Exp Biol Med 186 269–274. [DOI] [PubMed] [Google Scholar]
- Herkenham M, Lynn AB, Little MD, Johnson MR, Melvin LS, de Costa BR, and Rice KC (1990) Cannabinoid receptor localization in brain. Proc Natl Acad Sci U S A 87 1932–1936. [DOI] [PMC free article] [PubMed] [Google Scholar]
- Howlett AC (1995) Pharmacology of cannabinoid receptors. Annu Rev Pharmacol Toxicol 35 607–634. [DOI] [PubMed] [Google Scholar]
- Ishac E, Jiang L, Lake K, Varga K, Abood M, and Kunos G (1996) Inhibition of exocytotic noradrenaline release by presynaptic CB1 receptors on peripheral sympathetic nerves. Br J Pharmacol 118 2023–2028. [DOI] [PMC free article] [PubMed] [Google Scholar]
- Iversen L and Chapman V (2002) Cannabinoids: a real prospect for pain relief. Curr Opin Pharmacol 2 50–55. [DOI] [PubMed] [Google Scholar]
- Janick-Buckner D, Barua AB, and Olson JA (1991) Induction of HL-60 cell differentiation by water-soluble and nitrogen-containing conjugates of retinoic acid and retinol. FASEB J 5 320–325. [DOI] [PubMed] [Google Scholar]
- Klein TW, Newton C, Larsen K, Lu L, Perkins I, Nong L, and Friedman H (2003) The cannabinoid system and immune modulation. J Leukoc Biol 74 486–496. [DOI] [PubMed] [Google Scholar]
- Kurkela M, García-Horsman JA, Luukkanen L, Mörsky S, Taskinen J, Baumann M, Kostiainen R, Hirvonen J, and Finel M (2003) Expression and characterization of recombinant human UDP-glucuronosyltransferases (UGTs): UGT1A9 is more resistant to detergent inhibition than other UGTs and was purified as an active dimeric enzyme. J Biol Chem 278 3536–3544. [DOI] [PubMed] [Google Scholar]
- Kuuranne T, Kurkela M, Thevis M, Schänzer W, Finel M, and Kostiainen R (2003) Glucuronidation of anabolic androgenic steroids by recombinant human UDP-glucuronosyltransferases. Drug Metab Dispos 31 1117–1124. [DOI] [PubMed] [Google Scholar]
- Little JM, Kurkela M, Sonka J, Jäntti S, Ketola R, Bratton S, Finel M, and Radominska-Pandya A (2004) Glucuronidation of oxidized fatty acids and prostaglandins B1 and E2 by human hepatic and recombinant UDP-glucuronosyltransferases. J Lipid Res 45 1694–1703. [DOI] [PubMed] [Google Scholar]
- Matsuda LA, Lolait SJ, Brownstein MJ, Young AC, and Bonner TI (1990) Structure of a cannabinoid receptor and functional expression of the cloned cDNA. Nature 346: 561–564. [DOI] [PubMed] [Google Scholar]
- Munro S, Thomas KL, and Abu-Shaar M (1993) Molecular characterization of a peripheral receptor for cannabinoids. Nature 365: 61–65. [DOI] [PubMed] [Google Scholar]
- Racz I, Bilkei-Gorzo A, Toth ZE, Michel K, Palkovits M, and Zimmer A (2003) A critical role for the cannabinoid CB1 receptors in alcohol dependence and stress-stimulated ethanol drinking. J Neurosci 23 2453–2458. [DOI] [PMC free article] [PubMed] [Google Scholar]
- Radomińska-Pyrek A, Zimniak P, Irshaid YM, Lester R, Tephly TR, and St Pyrek J (1987) Glucuronidation of 6 α-hydroxy bile acids by human liver microsomes. J Clin Invest 80 234–241. [DOI] [PMC free article] [PubMed] [Google Scholar]
- Ravinet Trillou C, Arnone M, Delgorge C, Gonalons N, Keane P, Maffrand JP, and Soubrie P (2002) Anti-obesity effect of SR141716, a CB1 receptor antagonist, in diet induced obese mice. Am J Physiol Regul Integr Comp Physiol 284 R345–R353. [DOI] [PubMed] [Google Scholar]
- Watanabe K, Matsunaga T, Yamamoto I, Funae Y, and Yoshimura H (1995) Involvement of CYP2C in the metabolism of cannabinoids by human hepatic microsomes from an old woman. Biol Pharm Bull 18 1138–1141. [DOI] [PubMed] [Google Scholar]
- Watanabe K, Yamaori S, Funahashi T, Kimura T, and Yamamoto I (2007) Cytochrome P450 enzymes involved in the metabolism of tetrahydrocannabinols and cannabinol by human hepatic microsomes. Life Sci 80 1415–1419. [DOI] [PubMed] [Google Scholar]
- Wen Z, Tallman MN, Ali SY, and Smith PC (2007) UDP-glucuronosyltransferase 1A1 is the principal enzyme responsible for etoposide glucuronidation in human liver and intestinal microsomes: structural characterization of phenolic and alcoholic glucuronides of etoposide and estimation of enzyme kinetics. Drug Metab Dispos 35 371–380. [DOI] [PubMed] [Google Scholar]
- Wittwer E and Kern SE (2006) Role of morphine's metabolites in analgesia: concepts and controversies. Am Assoc Pharm Sci 8 E348–E352. [DOI] [PMC free article] [PubMed] [Google Scholar]
- Xiong Y, Bernardi D, Bratton S, Ward MD, Battaglia E, Finel M, Drake RR, and Radominska-Pandya A (2006) Phenylalanine 90 and 93 are localized within the phenol binding site of human UDP-glucuronosyltransferase 1A10 as determined by photoaffinity labeling, mass spectrometry, and site-directed mutagenesis. Biochemistry 45 2322–2332. [DOI] [PubMed] [Google Scholar]
- Yamamoto I, Watanabe K, Kuzuoka K, Narimatsu S, and Yoshimura H (1987) The pharmacological activity of cannabinol and its major metabolite, 11-hydroxycannabinol. Chem Pharm Bull 35 2144–2147. [DOI] [PubMed] [Google Scholar]


