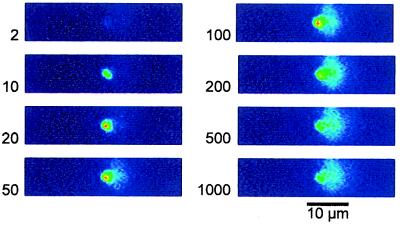
Figure 1.
A time series of images showing the Ca2+-induced fluorescence of the low-affinity dye OG5N during light stimulation. Raw intensity images are plotted by using false-color coding. Two milliseconds after the light was turned on, the first image was recorded. It represents the initial level of fluorescence during the latency period of the cell, because of autofluorescence of the tissue and the residual fluorescence of the Ca2+ indicator at low Cai. The other images are taken at times indicated by the numbers (in milliseconds). Ten milliseconds after the onset of illumination, a strong increase in fluorescence is visible in the region that corresponds to the rhabdomere. The fluorescence signal in the rhabdomere starts to decline after 100 ms, and it spreads into the cell body.

