Abstract
Objectives
The relationship between patient symptoms and histological severity of Eosinophilic Esophagitis (EE) is not known. We created a pediatric EE symptom score (PEESS) and compared the results with histological findings in the esophagus.
Methods
Subjects ages 3–18 years with a histologic diagnosis of EE or their parent completed a survey rating the frequency and severity of their gastrointestinal symptoms. Scores ranged from 0–98. Eosinophil numbers in esophageal biopsy specimens were correlated with the PEESS.
Results
Forty-nine subjects completed the PEESS. The symptom score did not correlate with the peak eosinophil count (r2=0.079). Newly diagnosed, untreated EE subjects (N=15) had a mean score of 24.7 ± 16.4 with a modest correlation between the PEESS and the number of eosinophils in the distal esophagus (r2=0.37). The mean PEESS score in the 34 treated patients was lower than in untreated patients [15.6 ± 12.9. p=0.046]. The mean score for treated patients in histologic remission was the same as treated patients with active EE, irrespective of treatment type. Abdominal pain was the most frequent and severe symptom reported. Of 20/34 subjects (58.8%) in histologic remission, 17 (85%) continued to report symptoms with a mean score of 17.4 ± 9.9 (range 1–38). Three children with active histologic EE (10%) reported no symptoms.
Conclusions
Children with untreated EE had a higher PEESS than treated subjects. Symptoms persisted in 85% of EE patients despite histologic resolution and 10% with active EE reported no symptoms. Our data indicates a dissociation between symptoms and histology in pediatric EE.
Keywords: Eosinophilic Esophagitis, symptoms, score, dissociation
Introduction
Eosinophilic esophagitis (EE) is a growing clinical entity among both the pediatric and adult populations.1–3 Patients with EE can present with a number of symptoms including vomiting, abdominal pain, failure to thrive, dysphagia, and/or food impaction.4–7 However, the relationship between these symptoms and histology is not yet known.
Because presenting symptoms are non-specific, the diagnosis of EE depends upon histological findings. EE is a clinico-pathological diagnosis requiring at least 15 eosinophils per high-power field (HPF).15–17 Marked basal cell layer hyperplasia and papillary (rete peg) lengthening are also histological features. Endoscopic features of EE include mucosal furrowing, rings, strictures and adherent white plaques or papules.18, 19 However, in a subset of patients with histological evidence of EE the mucosa may appear endoscopically unremarkable.20
Effective treatments for EE include the use of systemic and swallowed topical steroids as well as elemental and allergen elimination diets.13–16 New data has renewed interest in the use of proton pump inhibitors as treatment for esophageal eosinophilia.21,22 None of these treatments has been shown to be completely effective for all patients with EE and each has potential drawbacks including being highly dependent on patient compliance. At this time, no controlled clinical comparison trials have been performed, although a recent study has shown efficacy of swallowed fluticasone propionate compared with placebo.23 Of note, this study documented improvement in only one symptom (vomiting) following therapy, raising concerns that symptomatic improvement may be more difficult to achieve than histological improvement.
Methods other than endoscopic biopsy to diagnose and follow patients who have EE would be highly desirable. Konikoff et al. found that blood absolute eosinophil count (AEC), plasma eosinophil-derived neurotoxin (EDN), and eotaxin-3 levels correlated with esophageal eosinophil density.24 They report that the combined positive predictive value of these tests was 88%; however, the tests had a negative predictive value of only 70%. No longitudinal studies assessing the role of these markers for monitoring histologic response to therapy have been completed. Anecdotally, some patients with EE become asymptomatic following treatment but continue to have histological evidence of EE on repeat endoscopy. This raises concerns about physician reliance upon patient symptoms in determining disease activity.
Few data have been published on attempts to systematically correlate patient symptoms with the degree of eosinophilia found within the esophagus.25 In this study, we administered a patient symptom survey to children with EE to examine the spectrum of clinical manifestations and attempt to correlate symptoms with histological disease severity.
Materials and Methods
Subjects
Pediatric subjects with EE (3 to 18 years of age) were recruited to participate in the study. Subjects were enrolled at Cincinnati Children’s Hospital Medical Center (CCHMC) from October 2004 until November 2005. All subjects had documented EE based upon histologic evidence including >24 eosinophils per 400X HPF from either the proximal or distal esophagus. Previously diagnosed subjects had endoscopy performed as part of routine surveillance, after a change in diet or medical therapy, or due to persistence of symptoms. Newly diagnosed subjects underwent endoscopy due to persistent symptoms. The decision for endoscopy was made by the subject’s attending gastroenterologist. Subjects’ age and current course of treatment are summarized in Table 1. Subjects were excluded from the study if they had other comorbid eosinophilic disorders, were nonverbal, or esophageal biopsies not available at CCHMC. The Institutional Review Board at CCHMC approved the study and all participants (or their parents or guardian) gave written informed consent/assent. Six patients completed surveys prior to two separate endoscopies performed at least three months apart and were counted twice due to changes in therapy and age.
Table 1.
Subject characteristics
| ID | Sex | AGE (yrs) |
Treatment | Distal Peak Eos |
Frequency Subscore |
Severity Subscore |
Total score |
|---|---|---|---|---|---|---|---|
| 1 | M | 5 | Elemental | 12 | 0 | 0 | 0 |
| 2 | F | 3 | Elemental | 1 | 3 | 4 | 7 |
| 3 | M | 15 | Elemental | 3 | 0 | 0 | 0 |
| 4 | M | 4 | Elemental | 2 | 12 | 8 | 20 |
| 5 | M | 5 | Elemental | 7 | 13 | 8 | 21 |
| 6 | F | 5 | Elemental +food | 1 | 2 | 2 | 4 |
| 7 | M | 7 | Elemental +food | 3 | 7 | 12 | 19 |
| 8 | M | 15 | Elemental +food | 26 | 13 | 18 | 31 |
| 9 | M | 18 | Elemental+food | 47 | 24 | 12 | 36 |
| 10 | F | 6 | Elemental+food | 1 | 19 | 4 | 23 |
| 11 | F | 10 | Elimination | 48 | 5 | 6 | 11 |
| 12 | M | 8 | Elimination | 0* | 4 | 8 | 12 |
| 13 | M | 7 | Elimination | 38 | 3 | 0 | 0 |
| 14 | F | 12 | Elimination | 0 | 16 | 19 | 35 |
| 15 | M | 6 | Elim +Fluticasone | 38 | 0 | 0 | 0 |
| 16 | F | 11 | Elim +Fluticasone | 130 | 0 | 0 | 0 |
| 17 | M | 3 | Elim +Fluticasone | 125 | 21 | 26 | 47 |
| 18 | M | 6 | Elim +Fluticasone | 221 | 2 | 6 | 8 |
| 19 | M | 6 | Elim +Fluticasone | 29 | 7 | 8 | 15 |
| 20 | F | 17 | Fluticasone | 0 | 20 | 18 | 38 |
| 21 | M | 8 | Fluticasone | 53 | 5 | 2 | 7 |
| 22 | M | 18 | Fluticasone | 1 | 8 | 20 | 28 |
| 23 | M | 13 | Fluticasone | 5 | 6 | 10 | 16 |
| 24 | M | 11 | Fluticasone | 265 | 6 | 14 | 20 |
| 25 | M | 5 | Fluticasone | 0 | 1 | 0 | 1 |
| 26 | M | 6 | Fluticasone | 42 | 7 | 4 | 11 |
| 27 | M | 8 | Fluticasone | 1 | 15 | 6 | 21 |
| 28 | M | 15 | Fluticasone | 23 | 6 | 8 | 14 |
| 29 | F | 9 | Fluticasone | 0 | 4 | 14 | 18 |
| 30 | F | 3 | Fluticasone | 3 | 3 | 2 | 5 |
| 31 | M | 14 | Fluticasone | 278 | 4 | 4 | 8 |
| 32 | M | 8 | Fluticasone | 0 | 4 | 10 | 14 |
| 33 | M | 14 | Fluticasone | 1 | 0 | 0 | 0 |
| 34 | M | 11 | None | 134 | 15 | 22 | 37 |
| 35 | M | 11 | None | 155 | 14 | 8 | 22 |
| 36 | M | 11 | None | 86 | 13 | 12 | 25 |
| 37 | M | 13 | None | 58 | 3 | 4 | 7 |
| 38 | M | 14 | None | 176 | 5 | 10 | 15 |
| 39 | M | 5 | None | 63 | 2 | 0 | 2 |
| 40 | M | 17 | None | 40 | 1 | 2 | 3 |
| 41 | F | 7 | None | 34 | 5 | 6 | 11 |
| 42 | M | 10 | None | 96 | 11 | 8 | 19 |
| 43 | M | 7 | None | 32* | 8 | 14 | 22 |
| 44 | F | 9 | None | 170 | 13 | 24 | 37 |
| 45 | M | 6 | None | 55 | 23 | 24 | 47 |
| 46 | M | 8 | None | 31* | 13 | 6 | 19 |
| 47 | M | 9 | None | 156 | 22 | 26 | 48 |
| 48 | F | 12 | None | 232 | 28.5 | 28 | 56.5 |
| 49 | M | 16 | Prednisone | 89 | 18 | 22 | 40 |
Subject gender, age, treatment, peak number of eosinophils/HPF, frequency subscore, severity subscore and total score are listed. For treatment types, elemental = elemental formula only; elemental + food = elemental diet with oral food trials; elimination = elimination of foods positive during allergy testing; Elimination + Fluticasone = elimination diet in addition to swallowed fluticasone propionate; Fluticasone = treatment with swallowed fluticasone propionate alone. Distal peak eosinophil counts were used except where only proximal esophageal biopsies were obtained (indicated by ‘*’; ID#: 12, 43, 46).
Table 1 lists the therapy employed for each individual at the time of endoscopy. Patients were endoscoped while undergoing one of several individualized (i.e. non-protocol) therapeutic strategies: total dietary antigen elimination (elemental diet), food trial (elemental diet plus food), avoidance of selected antigens (elimination diet), elimination diet plus swallowed fluticasone (elimination plus fluticasone), or fluticasone alone. One group of subjects was newly diagnosed and had received no prior therapy (none).
Symptom Survey
Symptom surveys (see supplement) were used in a prior study by Konikoff et al.23 Recorded symptoms included vomiting, nausea, abdominal pain, dysphagia, heartburn, chest pain, regurgitation, food impactions, early satiety, and poor appetite (see supplemental data). Subjects were asked to rate the frequency of symptoms on a 1–5 scale and the severity of symptoms on a 1–3 scale. The severity subscale was weighted ×2 to help equalize the two scales. Frequency and severity scores were added to give a total symptom score.
Survey administration
Subjects were asked to rate their symptoms using the PEESS. When necessary, parents completed the survey for young children (ages 3–10). A research coordinator was available to answer questions during the administration of the survey. Subjects completed the surveys either after a follow-up clinic visit or in a private waiting area prior to an endoscopy. The majority of surveys (n= 44) were completed within one week before or after endoscopy. The remaining 5 surveys were completed after the endoscopy (mean 31.2 days; range 8–50 days). The 5 subjects with delayed survey completion had no documented change in their clinical status at the time of survey administration as verified by clinical records. After completion of the survey, scores were entered into a subject database.
Histology
Grasp biopsies were obtained at the discretion of the endoscopist from the proximal and distal esophagus, as well as the stomach and duodenum. Biopsies were fixed in formalin, embedded in paraffin and stained in a standard fashion with hematoxylin and eosin. Endoscopic biopsies were initially reviewed by a board-certified pediatric pathologist and then re-reviewed for this study by the primary investigator (SP) to determine the specific peak eosinophil count. Intraepithelial eosinophils in each 400× HPF from an individual biopsy specimen were counted. The peak eosinophil count for each biopsy was determined as the maximum number of eosinophils in any single HPF. All slides were also assessed for layering of eosinophils on the mucosal surface and the presence of basal layer hyperplasia although these features were not scored as they are less easily quantified and depended upon tissue sectioning. At the time of counting, the primary investigator was only aware that subjects had a prior diagnosis of EE. Biopsies from the stomach and duodenum were also reviewed and correlated with the official pathology reports to ensure that they did not possess significant eosinophilia. For this study, the definition of active EE was ≥ 24 eosinophils per HPF which is consistent with the FIGERS recommendation for EE research studies. 15 Subjects with 0–5 eosinophils/HPF were considered to be in remission. Those subjects with 5–24 eos/HPF were only included in the overall analysis to help ascertain the correlation between eosinophil count and symptoms.
Statistical analysis
Subjects were grouped by active and inactive disease, treatment type, gender and age. Subgroups (active versus inactive, ages 3–8 years versus >9 years, and treatment type) were analyzed. Linear regression analysis was performed to evaluate the correlation between survey scores and peak eosinophil counts. Groups were evaluated for differences between symptom scores and cell counts by student t-tests. Data is expressed as mean ± S.D. As the symptom score ratings were not distributed normally, a rank correlation (Spearman’s Rho) was also performed. Cluster analysis using subject responses for individual symptoms was completed to examine whether score components would classify patients into active or inactive disease. Statistical tests and graphs were performed using GraphPad Prism, version 4.01 (GraphPad Software Inc., San Diego, CA), Microsoft Excel 2002 (Microsoft Corporation, Redmond WA), and “R” version 2.5.1 (The R Foundation for Statistical Computing).
Results
Subject characteristics
Subject ages (N=49) ranged from 3–18 years (mean 9.53 years) (Table 1) and included 37 males and 12 females. Fifteen subjects were newly diagnosed with EE and were untreated at the time of PEESS administration. The remaining 34 subjects had been previously diagnosed with EE, with a mean time from diagnosis of 21.7 ± 23.8 months (median, 11.8 months; range 3.4–108.4 months). Of the subjects with known EE, 14/34 were on diet therapy (either elemental or elimination of foods positive on allergy testing). Nineteen out of the 34 subjects received topical steroids in the form of swallowed fluticasone propionate with 1/34 having received oral prednisone.
Peak and mean eosinophil counts were obtained from both the distal and proximal esophagus. Proximal peak and mean eosinophil counts were found to have a weaker correlation with the PEESS (data not shown) so distal peak eosinophil counts were reported for the study (Table 1).
PEESS in different subject groups
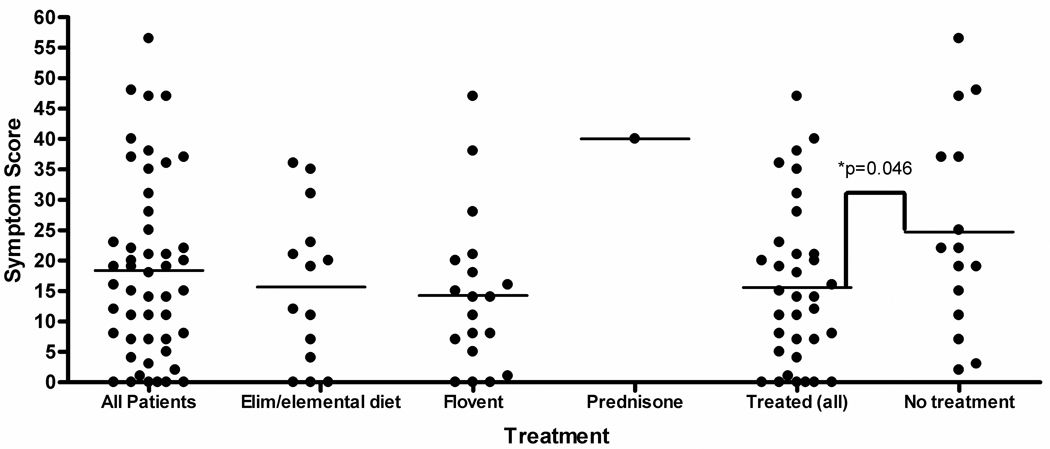
The PEESS scores for each treatment type are summarized in Figure 1. The 34 treated patients had a mean score of 15.6 ± 13.1 (range 0–47). The 15 newly diagnosed, untreated subjects had a mean score of 24.7 ± 16.4 (range of 2–56.5). The mean symptom score for all treated patients was lower than untreated patients (p=0.046). Out of the treated subjects, those on diet therapy (N=14) had a PEESS score of 15.6 ± 12.8 (range 0–36). Subjects receiving topical steroids (N=19) had a PEESS score of 14.3 ± 12.8 (range 0–47). The subject who received oral prednisone had a PEESS score of 40.
Figure 1.
PEESS scores categorized by subject treatment type. For treatments, Elim/elemental = patients on either elemental or elimination diet; Flovent = subjects receiving swallowed fluticasone propionate; Pred = prednisone. Untreated subjects scored higher on the PEESS compared to treated patients (p=0.046).
Based upon histology from endoscopic biopsies, 17/34 (50%) of the treated subjects were found to be in remission with ≤5 eosinophils per 400× HPF found on peak eosinophil count. Twelve of these 34 subjects (35%) had ≤1 eosinophil per HPF and were in complete remission. The mean symptom score for treated patients in histologic remission (≤5 eosinophils/HPF) was 17.1 ± 11.9 (range 0–38) which was statistically the same as treated patients who continued to have active histologic EE [16.7 + 15.1, (range 0–47), p=0.94]. Three subjects had eosinophil counts between 6–23 eos/HPF.
Symptom score as a function of eosinophil count
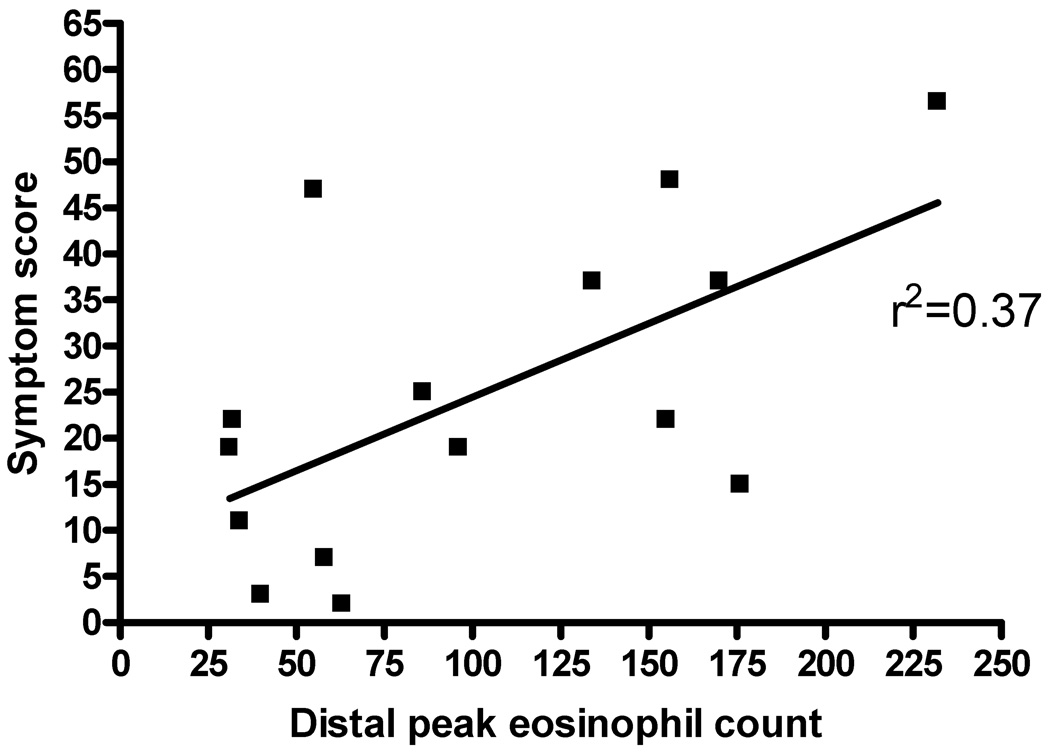
In looking at the effects of various treatment regimens on subject histology and symptoms, untreated patients (N=15) demonstrated a correlation with the PEESS (Figure 2, r2=0.37). Controlling for treatment with elemental diet, elimination diet, or swallowed fluticasone did not improve the correlation between eosinophil numbers and symptom scores on the PEESS. No difference was found in the symptom score when controlling for age (data not shown).
Figure 2.
Peak esophageal eosinophil count versus symptom score for subjects with untreated EE. The peak number of eosinophils was plotted against the total PEESS for untreated EE subjects (N=12).
Of the 6 patients who were used twice in the study, all were initially newly diagnosed, untreated subjects. Four had complete response to therapy with 0–1 eosinophils/HPF on repeat endoscopy; 1 had an incomplete response (from 155 to 86 eos/HPF), and another had an increase in the eosinophil count (from 34 to 130 eos/HPF). The symptom scores for the complete responders all improved (untreated mean symptom score of 20.0 versus treated mean score of 9.5) but none of these subjects became completely asymptomatic. The symptom score for the subject with partial response remained essentially unchanged (initial score of 22 versus treated score of 25). The subject with continued active EE did have resolution of symptoms (untreated score of 11 versus treated score of 0).
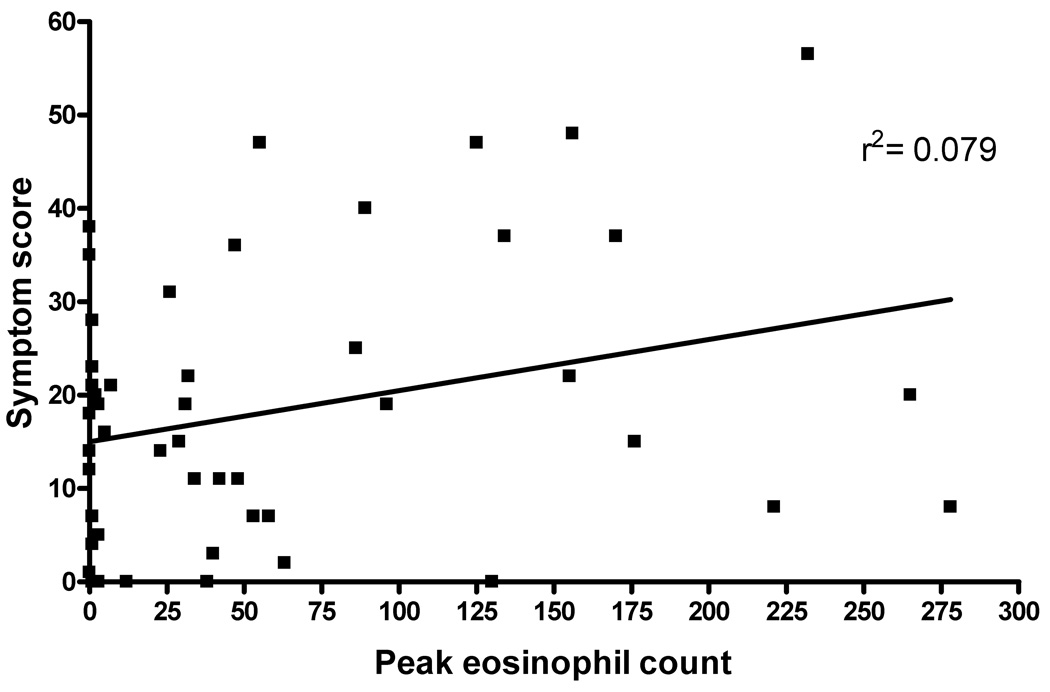
The overall symptom score was not predictive of the degree of eosinophilia found on histology (Figure 3, r2=0.079). Rank correlation gave a value of Rho=0.28 which approached significance (p=0.056). However, cluster analysis failed to demonstrate any significant breakpoints supporting the inability of the symptom score to distinguish the presence or absence of EE (data not shown).
Figure 3.
Peak esophageal eosinophil count versus symptom score. Subject score on the PEESS was plotted against the distal peak eosinophil count for all subjects.
Of the 17 treated subjects in histological remission, 15 (88%) continued to report symptoms. Further stratification of this group demonstrated that 11 (65%) of the subjects with 0–5 eos/HPF, had symptom scores >10 and 9/17 (53%) having PEESS scores >15. Conversely, 3/29 subjects (10%) reported no symptoms (PEESS score = 0) despite having active EE with peak counts of 38, 38, and 130 eosinophils/HPF, respectively.
Symptoms
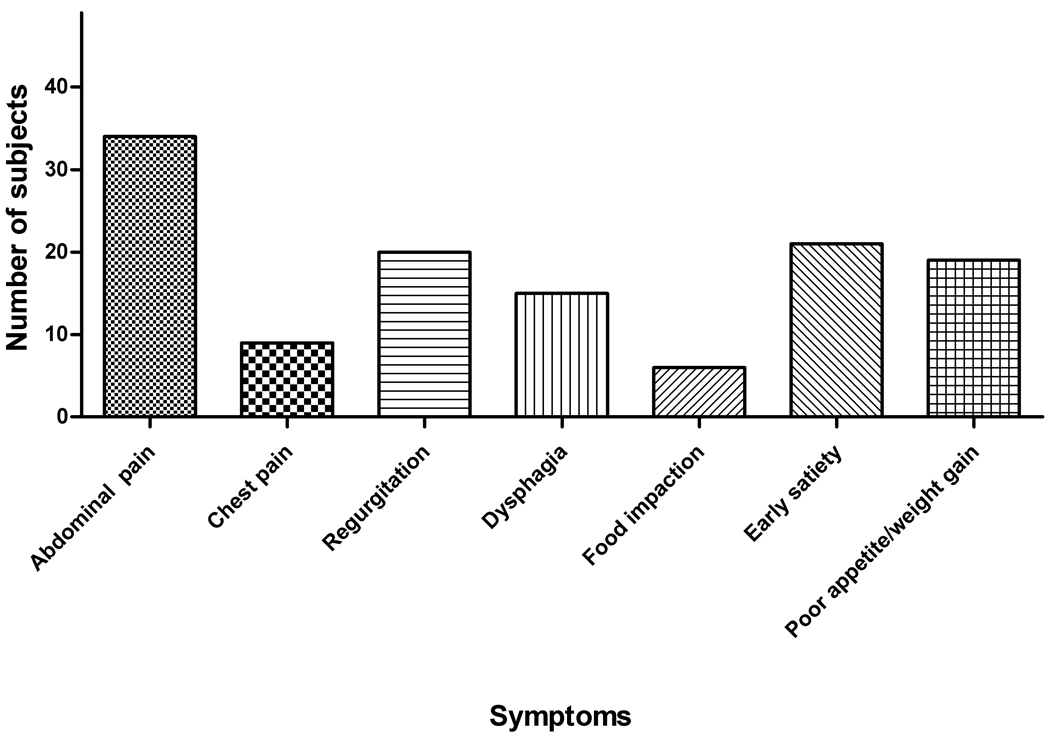
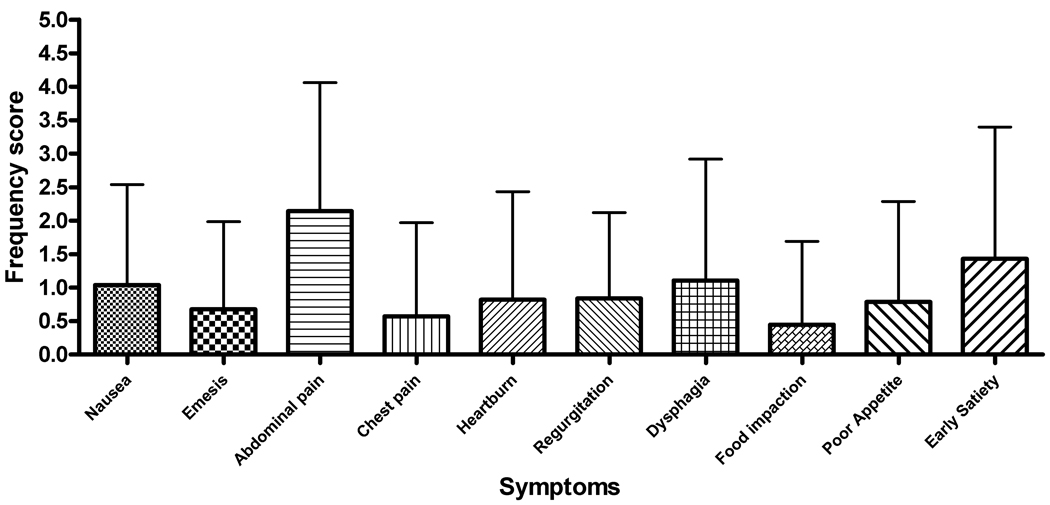
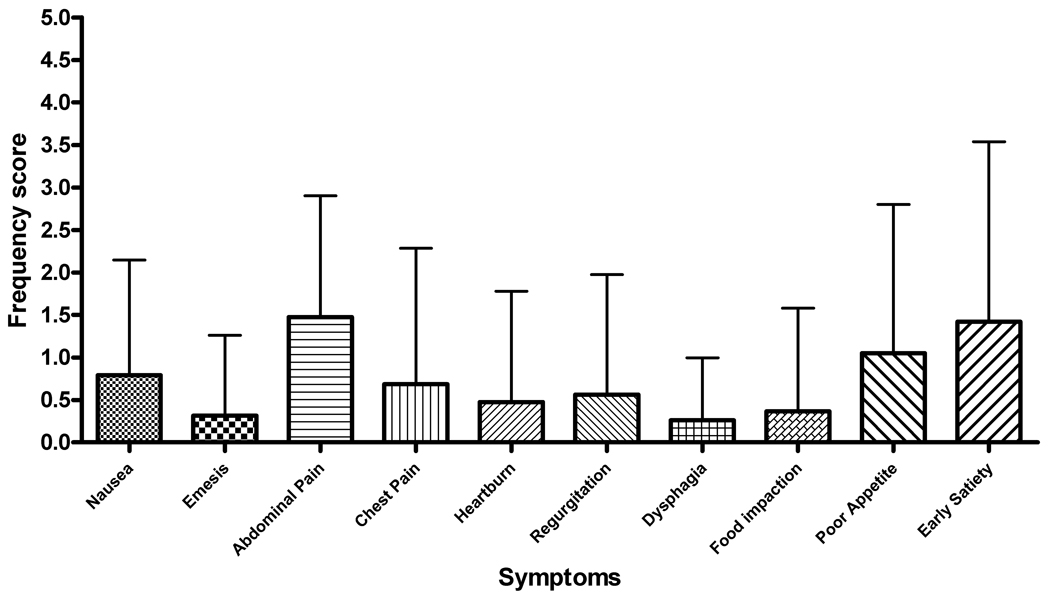
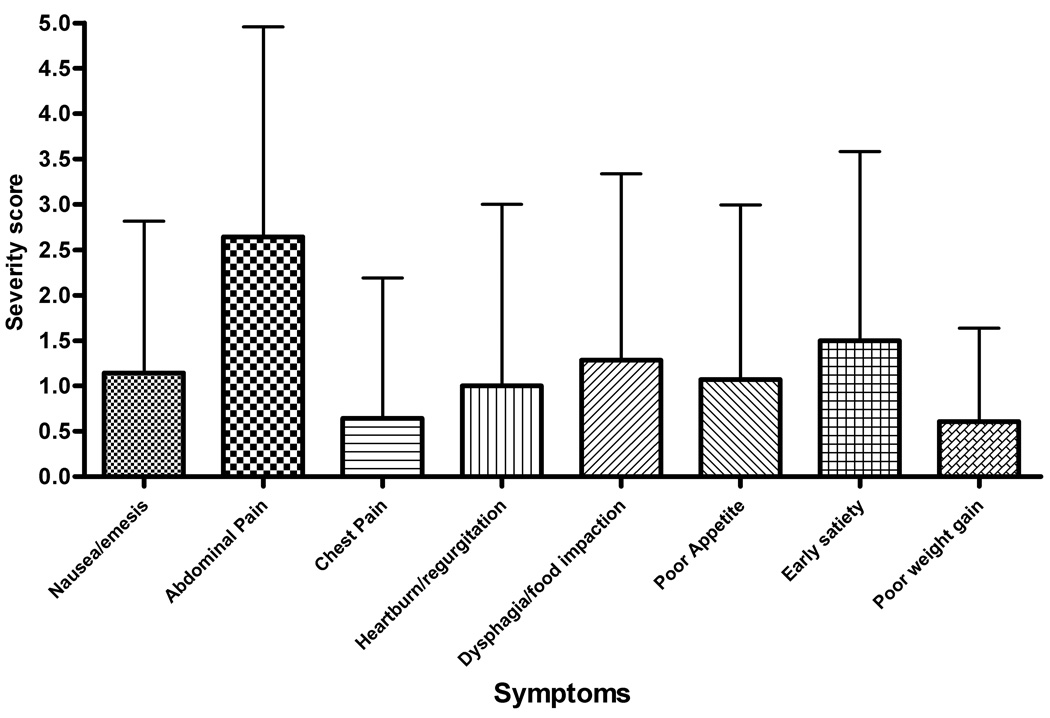
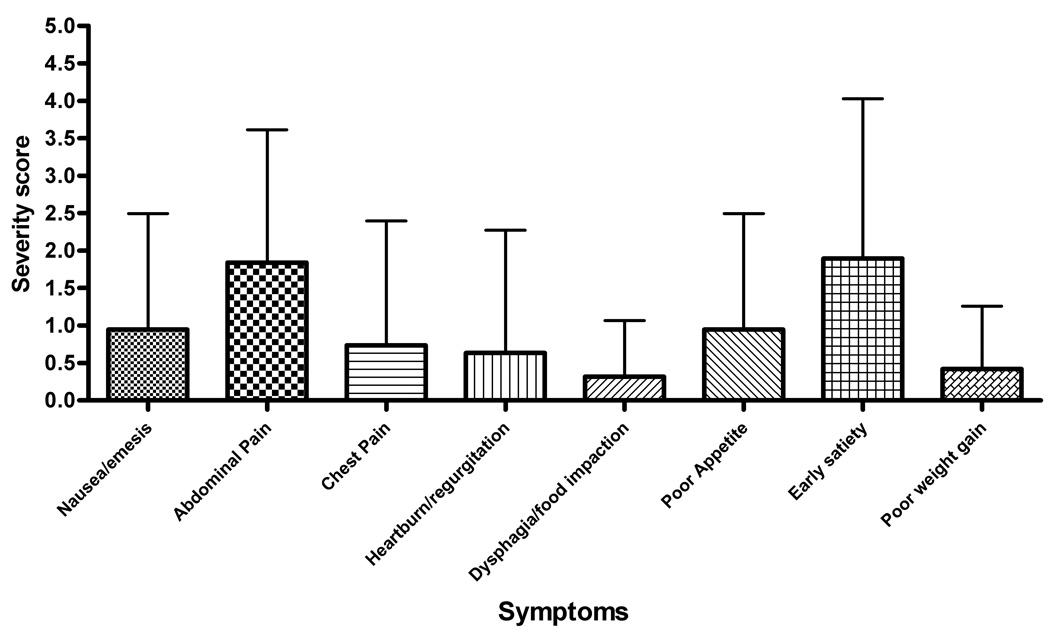
Abdominal pain was the most commonly reported symptom with 69% of subjects rating this factor (Figure 4). This was consistent for subjects with both active and inactive disease (Table 2). The breakdown between the frequency and severity subscales for the active and inactive subjects is shown in Figure 5. Patients with active EE had an individual frequency score for abdominal pain of 2.14 ± 1.92 with symptoms occurring at least 1x/week. Inactive EE subjects had a lower, but not significantly different frequency score of 1.47 ± 1.43 (Figure 5, a–b). Abdominal pain also received the highest severity scores for both active and inactive subjects (mean, S.D.− 2.64 ± 2.31 and 1.84 ± 1.77, respectively). The severity scores were not significantly different between inactive and active subjects (Figure 5, c–d).
Figure 4.
Reported symptoms for pediatric subjects with EE. Symptoms reported on the PEESS included abdominal pain, chest pain, regurgitation, dysphagia, food impactions, early satiety, and poor appetite/poor weight gain.
Table 2.
Symptom score differences between active and inactive EE subjects.
| Symptom | Inactive EE (n=20) |
Percentage | Active EE (n=29) |
Percentage | |
|---|---|---|---|---|---|
| Nausea/vomiting | 9 | 44% | 14 | 48% | |
| Abdominal Pain | 14 | 70% | 20 | 69% | |
| Chest Pain | 4 | 20% | 5 | 17% | |
| Heartburn/Regurgitation | 5 | 25%* | 15 | 52%* | |
| Dysphagia | 4 | 20%** | 11 | 38%** | |
| Food impaction | 2 | 10% | 4 | 14% | |
| Early satiety | 8 | 40% | 11 | 38% | |
| Poor appetite/poor weight gain | 9 | 45% | 12 | 41% |
The number of subjects with either active or inactive EE reporting the presence of individual symptoms on the PEESS is listed. Heartburn/regurgitation was reported in a significantly higher percentage of subjects with active EE (* p= 0.02).
Dysphagia was also noted to be greater in active EE subjects although this was not statistically significant (**p= 0.08).
Figure 5.
(A–D) Symptom score breakdown for subjects with active and inactive EE. A and B represent the mean values for each symptom frequency subscore for subjects with active and inactive EE, respectively. C and B represent the mean values for the severity subscore for subjects with active and inactive EE. Error bars represent the standard deviation for the scores.
Subjects with active EE were more likely to complain of heartburn (52% vs 25%, p=0.02) with a trend towards increased complaints of dysphagia (38% vs 20%, p= 0.08) compared to subjects with inactive disease (Table 2).
Discussion
A marked dissociation between histological findings and patient symptoms in EE patients is reported in this study. Eighty-five percent of treated subjects continued to report symptoms despite histological remission. One possible reason for this finding could be the long-term effects of eosinophil degranulation upon the esophageal tissue. Hogan et al, postulated that eosinophils may be responsible for damaged axons found in the intestines of a mouse model of eosinophilic gastrointestinal disease.26 In humans, eosinophil derived cytotoxic granule constituents could have local effects on neurons creating a “visceral hyperalgesia” that is not reflected by the histology. This concept corresponds with emerging literature in other areas of the gastrointestinal tract such as post-infectious irritable bowel syndrome.27, 28 Indeed, eosinophil products have been detected after eosinophilia resolves in other diseases (e.g. eczema).29 Histology also does not correlate with patient-reported symptoms in disorders such as inflammatory bowel disease (IBD).30 However, in IBD, mucosal healing is associated with lower rates of surgery and subsequent hospitalization.31, 32 These data could indicate that a longer follow-up period may be needed for patients with EE who have achieved disease remission and that symptom resolution will occur in time.
Another possibility for the continued symptoms in our study subjects is that EE may present as a patchy disease. Several subjects in our study may have had active EE despite normal biopsies. Although possible, Gonsalves et al. reported 100% sensitivity after taking 5 biopsies.33 The vast majority of our subjects had at least 6 total biopsies taken from the esophagus (3 from the distal esophagus and 3 from the proximal esophagus). In reviewing the slides, all 400× HPF fields were reviewed for the biopsies of each subject, as well as counted by the same observer (SP), so the reported number of eosinophils is likely accurate.
Interestingly, 3 subjects with active EE by histology were asymptomatic based upon their responses on the PEESS. This indicates that symptoms alone may not be used to determine disease remission. It is not known whether these asymptomatic patients are at risk for developing complications such as strictures or dysphagia as older children or adults. It is possible that these subjects may develop symptoms with time unless they achieve histological remission.
Untreated EE subjects in our study had significantly higher scores on the PEESS compared to treated subjects. These same subjects also had a stronger correlation between their peak eosinophil count and total score on the PEESS. No correlations were found when subjects were stratified by treatment type, although this may be due to the small sample size of the groups.
Abdominal pain was the most common symptom reported on the PEESS. This symptom was rated as both more frequent and more severe than dysphagia, heartburn, or food impactions which are classically associated with EE. The overall symptom reporting may be related to the mean age of our population (9.53 years). Noel et al. noted a high prevalence of abdominal pain reported as the chief complaint (27%), which was the same proportion they reported presenting with vomiting or dysphagia as the predominant symptom.2 Although our study lacked statistically significant numbers of subjects to confirm this finding, EE symptoms at presentation likely vary with age. Infants and toddlers with EE may present with a feeding disorder whereas older children present with vomiting, abdominal pain and heartburn-like symptoms. Adolescents and adults are more likely to present with food impactions and strictures. Larger scale studies will need to be performed to verify this correlation.
Our study had several limitations. The limited sample size made it difficult to stratify subjects by treatment type or symptoms. Also, we did not control for the presence of comorbid allergic disease or acid suppression therapy. The majority of our subjects were trialed on acid suppression at some time either prior to or during diagnosis. However, as this therapy was not standardized, it was not evaluated for the paper. It is important to note that in our experience (at Cincinnati Children’s Hospital Medical Center), the overlap of EE and GERD is not dramatic.17 Most notably, in our prior papers, we did not find that reflux medications had any impact on therapeutic responses to anti-inflammatory agents (e.g. fluticasone) indicating that the presence of acid reflux was not a major confounding variable in our EE population.11,23 Patients were not asked to recall how long their symptoms had been present which may have helped guide duration of disease prior to diagnosis. This information may have impacted patients’ histological findings or response to treatment. Another potential confounder is that parents were allowed to assist patients in the completion of the survey. There are several articles in the literature supporting the use of parental reporting of symptoms of young children with autism and functional abdominal pain.34,35 We did not discover any differences in the symptom scores of younger children compared to those of older patients; however, parental reporting may have introduced an additional bias into the results. Finally, we did not track how many patients refused to complete the survey or their stated reasons.
A key limitation of our study was the use of an unvalidated symptom score. We did not assess how the symptom score differs from normal children or those with other chronic conditions such as chronic abdominal pain. Unfortunately, there are no published, validated symptom scores for EE at this time. The purpose of our study was to compare EE subjects’ symptoms with their histology and the items on the PEESS are consistent with the spectrum of symptoms commonly accepted as occurring in children who have EE. A reliable way of tracking EE patients’ symptoms is needed.
Future avenues for study include validation of a symptom score for use in pediatric EE to monitor symptoms as well as symptom progression over time. It may be possible to detect gene expression differences between subjects using gene chip analysis as reported by Blanchard et al. which might begin to explain the differences among individuals with seemingly equivalent degrees of inflammation.36
Our study indicates that symptoms do not correlate well with histologic severity or the presence of active disease based upon esophageal biopsies in patients with longstanding EE. In contrast, a modest correlation was found between symptoms and histology in newly diagnosed, untreated patients. More work will need to be performed to validate a symptom score that can be used to follow patient symptoms in EE.
Supplementary Material
Acknowledgement
We are grateful to Ms. Cassie Kirby for her assistance in collecting subject responses and to Dr. Ranajit Chakraborty, PhD for help with the statistical analysis. This study was supported in part by the CURED (Campaign Urging Research for Eosinophilic Disorders) Foundation, Food Allergy Project, Food Allergy and Anaphylaxis Network, and the Buckeye Foundation.
Declaration of funding support: Food Allergy and Anaphylaxis Network (FAAN) (M.E.R.), Campaign Urging Research for Eosinophil Disorders (CURED), the Buckeye Foundation (M.E.R.), the Food Allergy Project (M.E.R) and the DDRDC (NIDDK 064403).
Abbreviations used in this paper
- EE
eosinophilic esophagitis
- HPF
high power field
- AEC
absolute eosinophil count
- EDN
eosinophil derived neurotoxin
- CCHMC
Cincinnati Children’s Hospital Medical Center
References
- 1.Fox VL, Nurko S, Furuta GT. Eosinophilic esophagitis: It's not just kid's stuff. Gastrointest Endosc. 2002;56:260–270. doi: 10.1016/s0016-5107(02)70188-0. [DOI] [PubMed] [Google Scholar]
- 2.Noel RJ, Putnam PE, Rothenberg ME. Eosinophilic esophagitis. N Engl J Med. 2004;351:940–941. doi: 10.1056/NEJM200408263510924. [DOI] [PubMed] [Google Scholar]
- 3.Straumann A, Simon H. Eosinophilic esophagitis: escalating epidemiology? J Allergy Clin Immunol. 2005;115:418–419. doi: 10.1016/j.jaci.2004.11.006. [DOI] [PubMed] [Google Scholar]
- 4.Orenstein SR, Shalaby T, Di Lorenzo C, et al. The spectrum of pediatric eosinophilic esophagitis beyond infancy: A clinical series of 30 children. Am J Gastroenterol. 2000;95:1422–1430. doi: 10.1111/j.1572-0241.2000.02073.x. [DOI] [PubMed] [Google Scholar]
- 5.Liacouras CA, Spergel J, Ruchelli E, et al. Eosinophilic esophagitis: An 8 year experience. Paris, France: Hepatology, and Nutrition; World Congress of Pediatric Gastroenterology. 2004
- 6.Kahn S, Orenstein SR, Di Lorenzo C, et al. Eosinophilic esophagitis: strictures, impactions, dysphagia. Dig Dis Sci. 2003;48:22–29. doi: 10.1023/a:1021769928180. [DOI] [PubMed] [Google Scholar]
- 7.Pentiuk SP, Miller CK, Kaul A. Eosinophilic esophagitis in infants and toddlers. Dysphagia. 2007;22:44–48. doi: 10.1007/s00455-006-9040-9. [DOI] [PubMed] [Google Scholar]
- 8.Markowitz J, Liacouras CA. Eosinophilic esophagitis. Gastroenterol Clin North Am. 2003;32:946–966. doi: 10.1016/s0889-8553(03)00047-5. [DOI] [PubMed] [Google Scholar]
- 9.Mishra A, Rothenberg ME. Intratracheal IL-13 induces eosinophilic esophagitis by an IL-5, eotaxin-1, and STAT6-dependent mechanism. Gastroenterology. 2003;125:1419–1427. doi: 10.1016/j.gastro.2003.07.007. [DOI] [PubMed] [Google Scholar]
- 10.Kelly K, Lazenby A, Rowe P, et al. Eosinophilic esophagitis attributed to gastroesophageal reflux: improvement with an amino-based formula. Gastroenterology. 1995;109:1503–1512. doi: 10.1016/0016-5085(95)90637-1. [DOI] [PubMed] [Google Scholar]
- 11.Noel RJ, Putnam PE, Collins MH, et al. Clinical and immunopathologic effects of swallowed Fluticasone for eosinophilic esophagitis. Clin Gastroenterol Hepatol. 2004;2:568–575. doi: 10.1016/s1542-3565(04)00240-x. [DOI] [PubMed] [Google Scholar]
- 12.Liacouras CA, Wenner WJ, Brown K, et al. Primary eosinophilic esophagitis in children: Successful treatment with oral corticosteroids. J Pediatr Gastroenterol Nutr. 1998;26:380–385. doi: 10.1097/00005176-199804000-00004. [DOI] [PubMed] [Google Scholar]
- 13.Faubion W, Perrault J, Bugart L, et al. Treatment of eosinophilic esophagitis with inhaled corticosteroids. J Pediatr Gastroenterol Nutr. 1998;27:90–93. doi: 10.1097/00005176-199807000-00016. [DOI] [PubMed] [Google Scholar]
- 14.Teitelbaum J, Fox V, Twarog F, et al. Eosinophilic esophagitis in children: Immunopathological analysis and response to Fluticasone Propionate. Gastroenterology. 2002;122:1216–1225. doi: 10.1053/gast.2002.32998. [DOI] [PubMed] [Google Scholar]
- 15.Furuta G, Liacouras C, Collins M, et al. Eosinophilic esophagitis in children and adults: a systematic review and consensus recommendations for diagnosis and treatment. Gastroenterology. 2007 doi: 10.1053/j.gastro.2007.08.017. (e-publication before print) [DOI] [PubMed] [Google Scholar]
- 16.Ruchelli E, Wenner W, Voytek T, et al. Severity of esophageal eosinophilia predicts response to conventional gastroesophageal reflux therapy. Pediatr Dev Pathol. 1999;2:15–18. doi: 10.1007/s100249900084. [DOI] [PubMed] [Google Scholar]
- 17.Rothenberg ME, Mishra A, Collins MH, et al. Pathogenesis and clinical features of eosinophilic esophagitis. J Allergy Clin Immunol. 2001;2001:891–894. doi: 10.1067/mai.2001.120095. [DOI] [PubMed] [Google Scholar]
- 18.Langdon D. Fluticasone in eosinophilic corrugated ringed esophagus. Am J Gastroenterol. 2001;96:926–927. doi: 10.1111/j.1572-0241.2001.03654.x. [DOI] [PubMed] [Google Scholar]
- 19.Sundaram S, Sunku B, Nelson S, et al. Adherent white plaques: An endoscopic finding in eosinophilic esophagitis. J Pediatr Gastroenterol Nutr. 2004;38:208–212. doi: 10.1097/00005176-200402000-00020. [DOI] [PubMed] [Google Scholar]
- 20.Müller S, Pühl S, Vieth M, et al. Analysis of symptoms and endoscopic findings in 117 patients with histological diagnoses of eosinophilic esophagitis. Endoscopy. 2007;39:339–344. doi: 10.1055/s-2007-966216. [DOI] [PubMed] [Google Scholar]
- 21.Ngo P, Furuta GT, Antonioli DA, et al. Eosinophils in the esophagus--peptic or allergic eosinophilic esophagitis? Case series of three patients with esophageal eosinophilia. Am J Gastroenterol. 2006;101:1666–1670. doi: 10.1111/j.1572-0241.2006.00562.x. [DOI] [PubMed] [Google Scholar]
- 22.Spechler SJ, Genta RM, Souza RF. Thoughts on the complex relationship between gastroesophageal reflux disease and eosinophilic esophagitis. Am J Gastroenterol. 2007;102:1301–1306. doi: 10.1111/j.1572-0241.2007.01179.x. [DOI] [PubMed] [Google Scholar]
- 23.Konikoff MR, Blanchard C, Kirby C, et al. A randomized, double-blind, placebo-controlled trial of Fluticasone Propionate for pediatric eosinophilic esophagitis. Gastroenterology. 2006;131:1381–1391. doi: 10.1053/j.gastro.2006.08.033. [DOI] [PubMed] [Google Scholar]
- 24.Konikoff MR, Blanchard C, Kirby C, et al. Potential of blood eosinophils, eosinophil-derived neurotoxin, and eotaxin-3 as biomarkers of eosinophilic esophagitis. Clin Gastroenterol Hepatol. 2006;4:1328–1336. doi: 10.1016/j.cgh.2006.08.013. [DOI] [PubMed] [Google Scholar]
- 25.Aceves S, Bastian JF, Newbury RO, et al. Oral viscous budesonide: A potential new therapy for eosinophilic esophagitis in children. Am J Gastroenterol. 2007;102:2271–2279. doi: 10.1111/j.1572-0241.2007.01379.x. [DOI] [PubMed] [Google Scholar]
- 26.Hogan S, Mishra A, Brandt E, et al. A pathological function for eotaxin and eosinophils in eosinophilic gastrointestinal inflammation. Nat Immunol. 2001;2:353–360. doi: 10.1038/86365. [DOI] [PubMed] [Google Scholar]
- 27.Quigley E. Current concepts of the irritable bowel syndrome. Scand J Gastroenterol Suppl. 2003;237:1–8. doi: 10.1080/00855910310001403. [DOI] [PubMed] [Google Scholar]
- 28.Bercík P, Wang L, Verdú EF, et al. Visceral hyperalgesia and intestinal dysmotility in a mouse model of postinfective gut dysfunction. Gastroenterology. 2004;127:179–187. doi: 10.1053/j.gastro.2004.04.006. [DOI] [PubMed] [Google Scholar]
- 29.Ott NL, Gleich GJ, Peterson EA, et al. Assessment of eosinophil and neutrophil participation in atopic dermatitis: Comparison with the IgE-mediated late-phase reaction. J Allergy Clin Immunol. 1994;94:120–128. doi: 10.1016/0091-6749(94)90078-7. [DOI] [PubMed] [Google Scholar]
- 30.Geboes K, Rutgeerts P, Opdenakker G, et al. Endoscopic and histologic evidence of persistent mucosal healing and correlation with clinical improvement following sustained infliximab treatment for Crohn's disease. Curr Med Res Opin. 2005;21:1741–1754. doi: 10.1185/030079905x65457. [DOI] [PubMed] [Google Scholar]
- 31.Frøslie K, Jahnsen J, Moum B, et al. Mucosal healing in inflammatory bowel disease: results from a Norwegian population-based cohort. Gastroenterology. 2007;133:412–422. doi: 10.1053/j.gastro.2007.05.051. [DOI] [PubMed] [Google Scholar]
- 32.Rutgeerts P, Feagan B, Lichtenstein G, et al. Comparison of scheduled and episodic treatment strategies of infliximab in Crohn's disease. Gastroenterology. 2004;126(2):402–413. doi: 10.1053/j.gastro.2003.11.014. [DOI] [PubMed] [Google Scholar]
- 33.Gonsalves N, Policarpio-Nicolas M, Zhang Q, et al. Histopathologic variability and endoscopic correlates in adults with eosinophilic esophagitis. Gastrointest Endosc. 2006;64:313–319. doi: 10.1016/j.gie.2006.04.037. [DOI] [PubMed] [Google Scholar]
- 34.Rogers SJ, Hepburn S, Wehner E. Parent reports of sensory symptoms in toddlers with autism and those with other developmental disorders. J Autism Dev Disord. 2003;33:631–642. doi: 10.1023/b:jadd.0000006000.38991.a7. [DOI] [PubMed] [Google Scholar]
- 35.Caplan A, Walker L, Rasquin A. Development and preliminary validation of the Questionnaire on Pediatric Gastrointestinal Symptoms to assess functional gastrointestinal disorders in children and adolescents. J Pediatr Gastroenterol Nutr. 2005:296–304. doi: 10.1097/01.mpg.0000172748.64103.33. [DOI] [PubMed] [Google Scholar]
- 36.Blanchard C, Wang N, Stringer K, et al. Eotaxin-3 and a uniquely conserved gene-expression profile in eosinophilic esophagitis. Gastroenterology. 2006;131:2018–2020. doi: 10.1172/JCI26679. [DOI] [PMC free article] [PubMed] [Google Scholar]
Associated Data
This section collects any data citations, data availability statements, or supplementary materials included in this article.


