

Abstract
The mechanical behavior of 316LVM 1×7 cables were evaluated in uniaxial tension, and in cyclic strain-controlled fatigue with the use of a Flex tester operated to provide fully reversed bending fatigue. The magnitude of cyclic strains imparted to each cable tested was controlled via the use of different diameter mandrels. Smaller diameter mandrels produced higher values of cyclic strain and lower fatigue life. Multiple samples were tested and analyzed via scanning electron microscopy. The fatigue results were analyzed via a Coffin-Manson-Basquin approach and compared to fatigue data obtained from the literature where testing was conducted on similar materials, but under rotating bending fatigue conditions.
Keywords: Stainless steel cables, Fatigue-life, Coffin-Manson-Basquin, S-N, Implantable electrodes
1. Introduction
A team of materials scientists at CWRU is supporting the development of Networked Implantable Neuroprostheses (NNPS) Systems on an NIH-Bioengineering Research Partnership. The Materials Group is leading the material and structural evaluation, analysis, and testing of implantable leadwires and interconnects that form part of the NNPS. These implantable electrodes are constructed from small diameter wires in order to develop systems for restoration of extremity function in patients with spinal cord injuries [1–4]. The electrodes in totally implantable functional electrical stimulation (FES) systems must be reliable and withstand both static and cyclic loading for long durations. In order to understand the factors affecting the performance of such implantable electrodes, the tensile and fatigue properties must be characterized on representative wires/cables of candidate materials. Previous studies have investigated the rotating bending fatigue behavior of a range of wire/cable geometries and chemistries [5–8].
In the present study, the response of 316LVM 1×7 cables to static and cyclic mechanical loading is reported. Monotonic tensile tests were performed and the fracture surfaces of the cables were observed under a scanning electron microscope (SEM) to reveal the fracture mechanisms involved. Fully reversed cyclic bending fatigue tests of the cables were conducted in a flex tester under various strain loading conditions in order to determine the fatigue behavior of the cables both in the low cycle and high cycle regime. The fatigue behavior of the cables was modeled using the Coffin-Manson-Basquin relationship and compared to studies conducted under rotating bending fatigue. This work is part of a larger study investigating the cyclic bending fatigue behavior of a range of different candidate materials for use in next generation FES systems.
2. Experimental Procedures
2.1 Materials
The 316 LVM stainless steel cables evaluated in the present study utilize a 1×7 configuration [9], right angle twisted with lay length of 0.0423″ (inverse of twists per inch). The cable is comprised of seven wires (1 core and 6 outer wires) of equal diameter (0.00135″ ± 0.0001″). All cables used in the present study were coated with Teflon producing an overall cable diameter of 0.01025″ (±0.00075″). The 316LVM stainless steel used in these cables was prepared in accordance with ASTM F138-92 [10], Grade 2 specifications, and supplied by Fort Wayne Metals, Fort Wayne, IN in the “Hard” condition. The Teflon coating was removed prior to testing via the use of “hot tweezers” that remove the Teflon layer without affecting the stainless steel. This enabled imaging of the each individual wire of the cable via Scanning Electron Microscopy (SEM) as well as eliminating the effect of the polymer coating during testing. SEM examination confirmed the removal of the Teflon coating via the use of the “hot tweezers”.
2.2 Tensile Testing
Tensile testing of small size wires with conventional friction grips typically produces failure at the grips. However, due to the relatively low load required to break the 316LVM wires (because of their small diameter), they were directly glued to the grips (without the need to use the gripping action) using acetocyanoacrylate (i.e. super glue). In all cases, this produced tensile failure in the gage section away from the grip region. All tensile tests were carried out to failure using a 25 mm span with displacement rate of 0.5 mm/min using a screw driven tabletop Instron Model 1130, Instron corporation, Norwood, MA equipped with a 10 lb load cell and MTS Testworks software, MTS systems, Eden Prairie, MN. Both load and displacement were monitored via the MTS Testworks data acquisition system at a rate sufficient to capture the load and displacement data past the UTS. The load vs. displacement data were analyzed using 0.2% offset for yield stress, while UTS was calculated at maximum load. Engineering stress was calculated using the applied load divided by the total area of the cable (i.e. number of wires × cross sectional area of each wire). Elastic modulus was obtained from the manufacturer, while the reduction in area (Equation 1), was determined by examining the final cross sectional area of each of the wires in a Philips XL30 ESEM (Philips Electron Optics, Eindhoven, Netherlands) operated at 5Kv in secondary electron imaging mode.
| (1) |
where, Ao is the initial cross sectional area of each wire in the 1×7 cable, Afw is the final cross sectional area of each wire in the 1×7 cable.
The true fracture strain, εf, for each wire in the 1×7 cable was calculated via equation 2
| (2) |
While the true fracture stress of the 1×7 cable, σf, was calculated via equation 3
| (3) |
where, Pf is the fracture load of the 1×7 cable, and Af is the final cross sectional area of all the 7 wires in the 1×7 cable. The fracture load was obtained using the high speed data acquisition system.
2.3 Fatigue Testing
Fatigue tests were carried on the 316LVM 1×7 multi-strand cable using the Flex tester shown in Figure 1. Techniques using this device were developed for the determination of the ductility and low cycle fatigue behavior of thin metallic foils used in the electronics industry, as summarized in an ASTM-STP [11] and an ASTM standard [12]. Results obtained on thin foils using this technique are also provided elsewhere [13–15]. As reviewed elsewhere [13–15] some of the advantages of the Flex tester include: the ability to apply symmetric load; cyclic strain application; cyclic fatigue in strain-controlled mode; constant strain amplitude throughout test duration; and the capability to impose strain amplitudes for the range from low cycle fatigue to high cycle fatigue.
Figure 1.

Flex tester machine showing configuration of mandrels, wire sample, and break detector.
As shown in Figure 1, the sample is first placed between identically-sized mandrels of chosen dimensions. Reciprocal movements shown by the double-sided arrow, will impose a well-defined radius of curvature to the wire, and hence definite strain amplitude as calculated below. The cyclic frequency can be varied from 1 – 17 Hz, although all current tests were conducted with 1 Hz (i.e. 60 cycles/min). The sample is also connected to a small break detector that shuts off the machine when a current/voltage break is detected. A small dead load (e.g. 84 gms) is used to keep the sample from wandering off the mandrels. Tests can be run under fully reversed (i.e. R = −1) conditions by placing the sample as shown in Figure 1 and using the full range of motion of the machine. R = 0 tests can be conducted by simply limiting the range of motion of the machine, thereby loading the sample with the mandrel in only one direction. In the present work, multiple tests were conducted at R = −1 for the following mandrel diameters: 1.15mm, 1.95mm, 3.95mm, 5.92mm, 7.92mm, 9.88mm, 12.6mm, 19.05mm.
2.4 Fracture Surface Analysis
The failed tension and fatigue samples were examined in a Philips XL30 ESEM operated at 5Kv. Tension samples were examined to determine the mechanism(s) of failure (e.g. dimpled fracture, ductile rupture, shear, etc), while samples failed in fatigue were examined to determine any differences in the fracture surface appearance of any of the wires in the 1×7 configuration.
3. Results
The tensile properties of the 316LVM 1×7 multi-strand cable are summarized in Table 1. Included in Table 1 is other data [7] reported on as-drawn, and annealed, 316LVM single wires. The true fracture stress, true fracture strain, and percentage reduction in cross sectional area were calculated by using the cross-sectional area measured from the fracture surface as shown in Figure 2. A magnified view of wire #1 in the 1×7 cable is shown in Figure 3. The fracture surface of each individual wire in the cable exhibited similar features, with extremely high reduction in area (e.g. ~ 90%) and a dimpled fracture surface. The effect of changes in the mandrel diameter on the cycles to failure, Nf, is summarized in Figure 4, while Table 2 provides the individual data. As expected, the cycles to failure increased with an increase in the mandrel diameter. This results because an increase in mandrel diameter produces a smaller applied strain, as discussed below. The samples tested with mandrel diameters 9.88mm and 12.6 mm did not fail after >1,623,123 and >2,710,000 cycles respectively, and were removed from the machine.
Table 1.
Tensile properties of 316LVM 1×7 cable tested presently. Tensile properties of 316LVM as-drawn and 316LVM annealed wire [7] also provided.
| ID | Wire diameter (mm) | Cable diameter (mm) | 0.2% offset yield stress σy (MPa) | UTS (MPa) | Elastic modulus E* (GPa) | RA (%) | True fracture stress, σf′ (MPa) | True fracture strain, εf′ (MPa) |
|---|---|---|---|---|---|---|---|---|
| 316LVM 1×7 | 0.034 | 0.1 | 1135 | 1239 | 193 | 89.9±3.8 | 5400±1490 | 2.3±0.3 |
| 316LVM as-drawn [7] | 0.1 | N/A | 2224 | 2550 | 225 | 40 | 4250 | 0.5 |
| 316LVM annealed [7] | 0.1 | N/A | 592 | 884 | 196 | 90 | 8840 | 2.3 |
Manufacturer data
Figure 2.

Fracture surface of 316LVM 1×7 cable tested in tension.
Figure 3.

Magnified view of wire #1 in 1×7 cable shown in Figure 2. Dimpled fracture with high RA(~ 90%) is demonstrated.
Figure 4.

Effect of mandrel diameter on the cycles to failure for 316LVM 1×7 cable.
Table 2.
Effect of mandrel diameter on cyclic strain range and cycles to failure for 316 LVM 1×7 cable tested presently. DNF denotes sample did not fail after number of cycles listed
| Mandrel diameter (mm) | Cycles to failure (Nf) | Δε |
|---|---|---|
| 1.15 | 1145 | 0.05973 |
| 1.15 | 1333 | 0.05973 |
| 1.15 | 1647 | 0.05973 |
| 1.15 | 1893 | 0.05973 |
| 1.95 | 3088 | 0.03524 |
| 1.95 | 3103 | 0.03524 |
| 1.95 | 3171 | 0.03524 |
| 1.95 | 3474 | 0.03524 |
| 3.95 | 6818 | 0.01739 |
| 3.95 | 9422 | 0.01739 |
| 3.95 | 19355 | 0.01739 |
| 3.95 | 23981 | 0.01739 |
| 5.92 | 17271 | 0.0116 |
| 5.92 | 20837 | 0.0116 |
| 5.92 | 23993 | 0.0116 |
| 5.92 | 45227 | 0.0116 |
| 7.92 | 265792 | 0.00867 |
| 9.88 | 1602123 (DNF) | 0.006958 |
| 12.6 | 2710000 (DNF) | 0.005453 |
4. Discussion
4.1 Tensile properties
The high tensile strength and ductility (i.e. RA, εf) exhibited by the 316LVM 1×7 cable is not unusual, as it is known that austenitic stainless steels are highly ductile, while the cold work imparted in the wire drawing process significantly increases the strength. The combination of high strength and high ductility has been demonstrated in a number of drawn wires, including patented steel wire, as reviewed elsewhere [16]. For comparison, handbook values for annealed AISI 316LN are yield stress-205MPa, UTS-515MPa, RA-60% [17].
The values for true fracture stress reported in Table 1 include those calculated in earlier work [7]. Previous data [7] utilized the peak load divided by the final cross sectional area, thereby producing a very large true fracture stress due to the extremely high reduction in area (i.e. fracture strain) reported in that work [7]. Unfortunately, this early work [7] was not conducted with sufficiently high data acquisition rates to capture the non-uniform strain and resulting load drop that occurs in this regime. The present work was conducted with data acquisition rate of 20,000 Hz, thereby enabling the load reduction past the peak load (as well as the fracture load) to be recorded accurately. The true failure load was then divided by the final cross sectional area in order to obtain the true fracture stresses reported in Table 1. This still produces a true fracture stress in excess of 5,000 MPa for the present wires due to the extremely high (e.g. approx. 90%) reduction in area, Figures 2 and 3, although still less than the theoretical strength, estimated as E/strength. Such high fracture stresses are not necessarily unreasonable in the light of other work [16] on patented steel wires which exhibit significantly higher strengths in addition to non-zero failure strains.
4.2 Strain range (Δε) calculation for 316LVM 1×7 cable
The general observation of a decrease in fatigue life with decrease in mandrel diameter is expected and is consistent with much previous work on similar testing conducted on thin foils [13–15]. In those works [13–15] as well as the ASTM standard [12], the results are analyzed via a Coffin-Manson-Basquin strain-life approach [18–20] since the mandrel imparts a fully reversed and repeatable cyclic strain. The present work adopts a similar analysis and builds upon detailed analyses for stresses and strains in stranded cables which can be found elsewhere [7, 21]. For the purpose of the present study, it is known [7, 21] that the strains and stresses for the straight core wire in the cable are higher than the helically twisted outer wires. As analyzed elsewhere [7, 21], consider pure bending of a thin straight wire of diameter, d, around a well-defined and much larger radius, ρ. This can be approximated as bending of a thin slender rod, where the radius of curvature, ρ, is related to the bending moment, M, as:
| (4) |
and the normal stress due to bending is given by
| (5) |
The strain range for a fully reversed strain cycle under this situation is given by
| (6) |
Where d is the diameter of the individual wires in the cable, and ρ is the mandrel radius. The calculated strain ranges, Δε for the various mandrel sizes used presently are listed in Table 2. It should be noted that, although these calculations provide a conservative estimate for the strain range in the cable, the contact stresses between the wires in the cable are not included. A detailed analysis to account for contact and frictional stresses between the wires is beyond the scope of the present work and requires finite element modeling.
Examination of the cables fatigued to failure revealed similar features in each of the individual wires comprising the 1×7 cables as shown in Figure 5. A higher magnification view of wire #1 is shown in Figure 6. SEM examination of each of the wires in the 1×7 cable revealed that fatigue fracture initiated at the top and bottom of each wire, Figure 6. Fatigue fracture then propagated towards the center of each wire producing catastrophic fracture in each wire that was located roughly at the central axis of each wire. The final fracture exhibited ductile rupture (i.e. necking to a point) while some degree of lateral strain was also present as shown in Figure 6. This indicates that each individual wire in the 316LVM 1×7 cable experiences very similar cyclic strain values for a give mandrel size.
Figure 5.
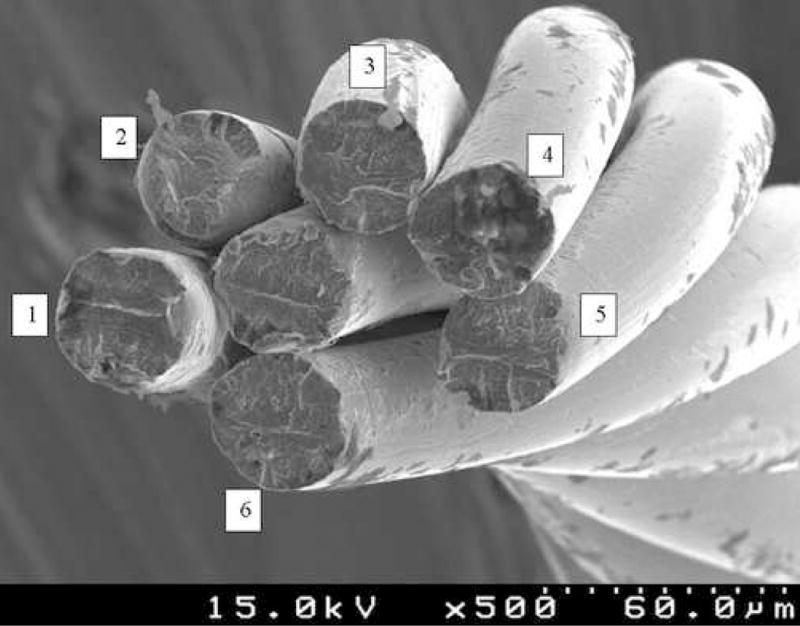
Fatigue fracture surface of 316LVM 1×7 cable tested using mandrel diameter 1.15mm and 1647 cycles to failure.
Figure 6.

Magnified view of fatigue fracture surface of wire #1 (Figure 5) from 316 LVM 1×7 cable tested using mandrel diameter 1.15mm and 1647 cycles to failure.
4.3. Strain-life relationship for 316LVM 1×7 cable
The strain-life approach to fatigue considers the plastic deformation that may occur in localized regions where fatigue cracks begin. The relationship between the strain range and the number of cycles to failure obtained by flex fatigue tests conducted using various mandrels is summarized in Table 2 and is plotted in Figure 7. The data points with an arrow indicate that the specimen did not fail after the number of cycles listed. As expected, bending over a small mandrel produces a larger cyclic strain, thereby reducing the fatigue life, as shown in much previous work on thin metal foils [13–15].
Figure 7.

Presently obtained fatigue (Table II) data plotted as Δε vs Nf. Arrows indicate sample did not fail.
In order to put the present data into perspective, Figure 8 combines the present data from Figure 7 with those obtained in other fatigue evaluations of similar materials [5–8]. It should be noted that all of the other fatigue studies [5–8] summarized in Figure 8 were conducted whereby the wires/cables were rotated around a fixed radius so that the complete circumference of the wire was stressed alternately in a tensile manner followed by a compressive manner, analogous to rotating bending fatigue testing. This technique enables the generation of high cycle fatigue data in relatively short periods of time since the rotational speed can be set to high RPM, although it does not necessarily stress/strain the material in the same way that is encountered in the biomedical applications considered presently. Deformation-induced heating of the wires/cables at high cyclic strains may also become a factor in the high RPM tests. The present testing cycles the wires/cables over a fixed mandrel radius, thereby imparting a fully reversed strain cycle, but not around the whole circumference of the wire/cable. The low cyclic frequency (i.e. 1 Hz) used presently will also minimize any temperature rise in the wires/cables. The fracture surfaces (Figures 5 and 6) illustrate that fracture starts at opposite sides of each wire in the cable and subsequently propagates towards the center of each wire, eventually producing catastrophic fracture of the wires/cables in the manner shown in Figures 5 and 6. This is somewhat different than that reported in the other studies [5, 8] where fracture initiates and propagates both around the circumference of the wires as well as into the cross section of each of the wires. The larger volume of material sampled (i.e. circumference of the wires/cables) in addition to the fatigue crack propagation both around the circumference and into the cross section of each wire is one of the sources of the lower fatigue lives exhibited in those studies [5, 8] in comparison to those obtained presently in Figures 7 and 8. However, the same general relationship is obeyed whereby cycling around a smaller radius (i.e. higher cyclic strain) produces a reduction in fatigue life.
Figure 8.

Literature data [5–8] along with the presently obtained fatigue data shown in Figure7.
4.4. Analysis of fatigue behavior
The fatigue-life behavior exhibited in Figures 7 and 8 has been analyzed in a number of ways. One of the popular approaches to analyzing fatigue life utilizes the Coffin-Manson-Basquin relationship whereby the total strain amplitude and fatigue life is given by
| (7) |
where, Δε/2 is the strain amplitude (half the total strain range), σ′f is the fatigue strength coefficient, ε′f is the fatigue ductility coefficient, b is the fatigue strength exponent, c is the fatigue ductility exponent and E is the elastic modulus [18–20]. This approach relates the uniaxial tensile behavior to the strain-life behavior through an equation of the type shown in Equation 7. Attempts at predicting the strain-life behavior via the use of uniaxial tensile data have evolved from earlier works [22, 23] while just the present data is analyzed in the light of these previous works [22, 23].
Equation 8, the Universal slopes equation [22] was proposed in 1965 after correlating the fatigue data of 29 different materials and assumes
| (8) |
| (9) |
where, Su is the ultimate tensile stress, D is the ductility, and %RA is the percentage reduction in area.
The modified universal slopes equation [23], equation 10, was proposed using the fatigue data of 50 different materials.
| (10) |
The uniaxial tensile data determined in Table 1 have been used in conjunction with equations 8 and 10 in order to compare the predicted response of the 316LVM 1×7 cable to that obtained experimentally, noting that the value for elastic modulus was that provided by the manufacturer. Figure 9 reveals that the modified universal slopes equation (i.e. equation 10) significantly under-predicts the fatigue life, particularly in the low cycle regime. While the universal slopes equation (i.e. equation 8) more closely represents the low cycle fatigue data, it under-predicts the high cycle fatigue data. Figure 10 provides the best fit Coffin-Manson-Basquin curve obtained by fitting Equation 7 with the fatigue strength and ductility coefficients obtained from the tensile tests and manufacturer supplied elastic modulus (Table 1). The fatigue strength exponent, b= −0.14 and fatigue ductility exponent, c= −0.65 calculated from the present data, are consistent with that exhibited by most engineering metals. For example, the fatigue strength and ductility exponent ranges from −0.14 to −0.05 and −0.8 to −0.5, respectively, for the range of structural metals reported elsewhere [24, 25]. While it would be useful to fit the rest of the data shown in Figure 8 using a Coffin-Manson-Basquin type analysis, the uniaxial tension data was only provided for one of the other studies [7] conducted on 316LVM as-drawn and annealed wire and is included in Table 1. Figure 11 summarizes only the fatigue data obtained by Meyer [7] on 316LVM single wires in the as-drawn and annealed conditions, respectively. The uniaxial tension data of these wires [7], summarized in Table 1, was used to calculate the fatigue strength and ductility exponents in order to fit the data with the Coffin-Manson-Basquin relationship. The fatigue strength exponents were b = −0.16, −0.2 for the as-drawn and annealed wires, respectively, while the fatigue ductility exponents were c = −0.5, −1.0 respectively. The fitted curves are shown in Figure 11 along with the original data [7]. While the scatter in the data for a fixed cyclic strain combined with the fewer number of cyclic strains tested contributes to the poorer fit of this previous data in comparison to the present data, some general trends are clear. The as-drawn 316LVM wire possesses higher tensile strength and lower ductility in comparison to the annealed 316LVM wire [7]. This is reflected in the fatigue performance whereby the higher strength, as-drawn 316LVM wire exhibits longer life when cycled at low strain amplitudes in comparison to the lower strength, annealed 316LVM wire. However, the high ductility, annealed 316LVM, exhibits longer life than the low ductility, as-drawn 316LVM when cycled at high strain amplitudes, generally consistent with observations on a number of different materials [18, 19, 22, 23, 25].
Figure 9.

Predicted strain-life behavior of 316LVM 1×7 cable using universal slopes equation [22] and modified universal slopes equation [23] in comparison to experimental data obtained presently. Arrows indicate sample did not fail.
Figure 10.

Strain-life behavior of 316LVM 1×7 cable using Coffin-Manson-Basquin relationship [18–20] with b = −0.14, c = −0.65, obtained from fitting fatigue data to equation 7 with uniaxial tension data obtained presently, Table 1. Arrows indicate sample did not fail.
Figure 11.

Data of Meyer [7] on individual wires of as-drawn 316LVM and annealed 316LVM fitted with Coffin-Manson-Basquin relationship. Uniaxial tension data of Meyer [7] used for analysis.
4.5. Stress-life behavior for 316LVM 1×7 cable
Figure 12 presents a summary of previous work [5, 7] on 316LVM wires conducted in rotating bending, where the bending stress is plotted against the number of cycles to failure. Stress-life data from the present work is also included in Figure 12. The data generated presently is included in Figure 12 by calculating the maximum bending stress in the cables, assuming that the core wire is subjected to maximum bending stress [21]. As shown in the strain-life plots in Figures 7 and 8, the present flex bend testing also produces a longer fatigue life for an equivalent bending stress compared to the rotating bending experiments also summarized in Figure 12 [5, 7]. As discussed with the strain-life plots, this likely results from the larger volume of material sampled (i.e. circumference of the wires/cables) in the rotating bending tests, in addition to the fatigue crack propagation both around the circumference and into the cross section of each wire/cable [5,7] in contrast to that exhibited by the samples tested in flex bending.
Figure 12.

Stress-life data of previous work [5,7] along with the presently obtained data.
5. Conclusions
The mechanical behavior of 316LVM 1×7 cables was evaluated in uniaxial tension, and in fully reversed cyclic strain-controlled bending fatigue with the use of a Flex tester. Cyclic strains were controlled via the use of different diameter mandrels. The following was observed:
The 316LVM 1×7 cables exhibited high tensile strength and fracture strain. Each of the individual wires in the 1×7 cables tested in tension exhibited similar fracture surface features (i.e. ductile fracture) and reduction in area/fracture strain.
The fatigue life of the 1×7 cables increased with an increase in mandrel diameter (i.e. decreasing cyclic strain). SEM analysis revealed similar fracture surface features in each of the wires present in the fatigued 1×7 cables. Fatigue failure started at the top and bottom surfaces of each individual wire and propagated toward the center of each wire, eventually producing tensile failure near the mid-plane of each wire.
The present fatigue results were analyzed with the Coffin-Manson-Basquin relationship with the aid of the presently generated uniaxial tension data. The fatigue strength coefficient, b, and fatigue ductility coefficient, c, were determined to be −0.14 and −0.65, respectively, for the presently tested 316LVM 1×7 cables. These values are in the range of those exhibited by other structural materials.
The fatigue behavior of other 316 LVM wires/cables tested in rotational bending fatigue [5–8] was compared to the present data. In all cases, the fatigue life obtained in rotating bending fatigue [5–8] was lower than that exhibited presently where fatigue was conducted in flexural bending using the flex tester shown in Figure 1. This likely results from the initiation and propagation of fatigue from the whole circumference of the wires/cables in the rotating bending fatigue tests, thereby producing shorter fatigue life than flexural bending fatigue when compared at the same cyclic strain.
Acknowledgments
This research is supported by NIH-NINDS Grant No. NS-041809 and NIH-NIBIB Grant No. EB-001740. Principal Investigator P. Hunter Peckham. The authors appreciate discussions with various members of the Functional Electrical Stimulation (FES) Center housed at CWRU.
Footnotes
Publisher's Disclaimer: This is a PDF file of an unedited manuscript that has been accepted for publication. As a service to our customers we are providing this early version of the manuscript. The manuscript will undergo copyediting, typesetting, and review of the resulting proof before it is published in its final citable form. Please note that during the production process errors may be discovered which could affect the content, and all legal disclaimers that apply to the journal pertain.
Contributor Information
John J. Lewandowski, Department of Materials Science and Engineering, Case Western Reserve University, Cleveland, OH 44106
Ravikumar Varadarajan, Department of Materials Science and Engineering, Case Western Reserve University, Cleveland, OH 44106.
Brian Smith, Department of Biomedical Engineering, Case Western Reserve University, Cleveland, OH 44106.
Chris Tuma, Department of Materials Science and Engineering, Case Western Reserve University, Cleveland, OH 44106.
Mostafa Shazly, Department of Materials Science and Engineering, Case Western Reserve University, Cleveland, OH 44106.
Luciano O. Vatamanu, Department of Materials Science and Engineering, Case Western Reserve University, Cleveland, OH 44106
References
- 1.Smith B, Peckham PH, Roscoe DD, Keith MW. IEEE Trans Biomed Eng, BME. 1987;34(7):499–508. doi: 10.1109/tbme.1987.325979. [DOI] [PubMed] [Google Scholar]
- 2.Scheiner A, Marsolais EB. Proc. 13th Annual RESNA conf; 1990. [Google Scholar]
- 3.Memberg WD, Peckham PH, Keith MW. IEEE Trans Rehab Eng. 1994;2(2):80–91. [Google Scholar]
- 4.Kilgore KL, Peckham PH, Keith MW, Montague FW, Hart RL, Gazdik MM, Bryden AM, Snyder SA, Stage TG. J Rehab Res Develop. 2003;40(6):457–468. doi: 10.1682/jrrd.2003.11.0457. [DOI] [PubMed] [Google Scholar]
- 5.Altman PA, Meagher JM, Walsh DW, Hoffmann DA. J Biomed Mat Res, App Biomat. 1997;43(1):21–37. doi: 10.1002/(sici)1097-4636(199821)43:1<21::aid-jbm3>3.0.co;2-o. [DOI] [PubMed] [Google Scholar]
- 6.Iguchi Y, Narushima T, Suzuki K, Watanabe M, Kinami T, Nishikawa T, Hoshimiya N, Handa Y. Intl Func Elec Stim Soc. 2000 [Google Scholar]
- 7.Meyer A. MS Thesis, Mechanical and Aerospace Engineering. Case Western Reserve University; Cleveland: 1985. [Google Scholar]
- 8.Scheiner A, Mortimer JT, Kicher TP. J Biomed Mat Res. 1991;25:589–608. doi: 10.1002/jbm.820250504. [DOI] [PubMed] [Google Scholar]
- 9.ASTM F 2180–02, Annual Book of ASTM Standards (2002).
- 10.ASTM F 138–92, Annual Book of ASTM Standards (1992).
- 11.W. Engelmaier, ASTM STP 753. (1981).
- 12.ASTM E 796-94, Annual Book of ASTM Standards (1994).
- 13.Merchant HD, Clouser SJ. IPC Flex circuit Conf; 1996. [Google Scholar]
- 14.Merchant HD, Minor MG, Liu YL. J Electronic Mat. 1999;28(9):998–1007. [Google Scholar]
- 15.Merchant HD, Wang JT, Glannuzzi LA, Liu YL. Circuit world. 2000;26(4):7–14. [Google Scholar]
- 16.Taleff EM, Lewandowski JJ, Pourlodian B. J TMS Soc. 2002;54(7):25–30. [Google Scholar]
- 17.Metals Handbook. ASM, Materials Park; Ohio: 1985. Desk edition. [Google Scholar]
- 18.Manson SS. National Advisory Commission on Aeronautics: Report 1170. Cleveland: Lewis Fight Propulsion Laboratary; 1954. [Google Scholar]
- 19.Coffin LF. Trans ASME. 1954;76:931–950. [Google Scholar]
- 20.Manson SS, Hirschberg MH. Fatigue: An Interdisciplinary Approach. Syracuse University Press; Syracuse, New York: 1964. [Google Scholar]
- 21.Costello G. Mechanical Engineering Series. 2. Springer; Newyork: 1997. Theory of wire rope. [Google Scholar]
- 22.Manson SS. Exp Mech. 1965;5(7):193–226. [Google Scholar]
- 23.Muralidharan U, Manson SS. Winter Annual Meeting ASME; 1986. [Google Scholar]
- 24.Mitchell MR. Fatigue and microstructure. ASM, Materials Park; Ohio: 1978. pp. 385–438. [Google Scholar]
- 25.Dowling NE. Mechanical behavior of materials. Prentice Hall; Upper Saddle River, New Jersey: 1998. [Google Scholar]