

Summary
The impact of IFNα secretion on disease progression was assessed by comparing phenotypic changes in the lupus-prone B6.Sle1Sle2Sle3 (B6.Sle123) strain and the parental B6 congenic partner using an adenovirus expression vector containing a recombinant IFNα gene cassette (IFN-ADV). A comprehensive comparison of cell lineage composition and activation in young B6 and B6.Sle123 mice revealed a variety of cellular alterations in the presence and absence of systemic IFNα. Most IFNα-induced phenotypes were similar in B6 and B6.Sle123, however, B6.Sle123 mice uniquely exhibited increased B1 and plasma cells after IFNα exposure, although both strains had an overall loss of mature B cells in the bone marrow, spleen and periphery. Although most of the cellular effects of IFNα were identical in both strains, severe GN only occurred in B6.Sle123 mice. Mice injected with IFN-ADV showed an increase in immune complex deposition in the kidney, together with an unexpected decrease in serum ANA levels. In summary, the predominant impact of systemic IFNα in this murine model is an exacerbation of mechanisms mediating end organ damage.
Keywords: SLE, IFN, congenic
Introduction
Systemic lupus erythematosus (SLE) is a chronic, systemic autoimmune disease characterised by the production of anti-nuclear antibodies (ANAs) that initiate an inflammatory disease via immune complex (IC) deposition. The immunological events leading to the initiation and progression of SLE are not well understood. Evidence to date suggests that a complex array of genetic interactions coupled with environmental influences confer susceptibility [1-3]. Although polyclonal B cell activation is a consistent characteristic of SLE in humans and animal models, other cells of the immune system, including activated T cells, dendritic cells (DCs) and myeloid cells, have been shown to play key roles in disease progression [4-6].
A variety of studies support a role for the pro-inflammatory Type I interferon-alpha (IFNα) in the pathogenesis of SLE in humans [7-14]. Investigations by Ronnblom and colleagues have shown that sera from SLE patients stimulated the production of interferon-alpha (IFNα) from PBMCs[8, 9]. In addition, global gene expression analyses have identified an IFN gene signature that is prevalent in the peripheral blood cells of SLE patients with severe disease [15-19].
The extent by which IFNα modifies or contributes to spontaneous murine models of SLE appears to be complex and may depend on genetic background of the susceptible strain. The majority of data suggests that IFN is pathogenic, but there are a few exceptions. Deletion of the receptor for IFNα is beneficial in some lupus-prone strains but not for others [20-22]. In the polygenic lupus-prone NZB/W mice, chronic administration of IFNα using adenovirus (ADV)-mediated delivery of IFNα induces the rapid development of kidney disease with associated proteinuria [23]. However, intermittent administration of recombinant IFNα in the Sle2 appears to be therapeutic. Taken together, these findings suggest that the role of IFNs in disease pathogenesis may be dependent upon genetic predisposition and specific pathogenic processes.
We have focused our efforts on understanding the genetic basis of lupus via a congenic dissection of disease susceptibility in the NZM2410 strain [24]. Our ongoing analyses have revealed clusters of susceptibility loci on chromosomes 1 (Sle1), 4 (Sle2), and 7 (Sle3) (Sle5), each of which contribute specific components to disease pathogenesis[25-29]. None of these Sle loci mediate fatal lupus as single locus B6-congenics, however, several combinations of specific loci lead to severe disease pathology and fatal lupus. Most notably, the B6.Sle1Sle2Sle3 triple congenic strain (B6.Sle123), develops highly penetrant severe systemic autoimmunity and fatal glomerulonephritis (GN) beginning at 6 months of age.
To determine whether lupus susceptibility loci influence immune system responses to type I interferons, we compared the effects of IFNα between age and gender matched C57BL6J (B6) and B6.Sle123 mice using an adenoviral vector system to drive transient expression of IFNα in vivo. Our results identified a variety of effects of IFNα on the immune system which were comparable in B6 and B6.Sle123 mice. However, only B6.Sle123 mice develop severe GN as a consequence of this treatment. Our findings suggest that IFNα predominantly operates to exacerbate mechanisms mediating end organ disease in mice with active disease.
Results
In vivo transduction of IFNα with recombinant adenovirus
Groups of B6 or B6.Sle123 mice were injected intravenously with either a recombinant ADV vector expressing interferon alpha (IFN-ADV) or the empty vector system (ADV). Sera from all mice were assayed for IFNα to assess the efficacy of IFN-ADV injection. IFNα was detectable in serum 3 days post-injection only in mice injected with IFN-ADV with levels peaking around 10 days post injection and decreasing to an average of 600 pg/ml at 8 weeks post-injection (Fig 1A). There were no significant differences in the circulating levels of IFN between B6 and B6.Sle123 mice. Other inflammatory molecules such as MCP-1, TNFα, IL-6, IL-12p70, IFN-γ and IL-10 were also assessed at this time, using a CBA kit. MCP-1 was detected only in IFN-ADV injected mice (Fig 1B) in both B6 and B6.Sle123 mice with comparable levels. TNF and IL-6 were detectable in untreated B6.Sle123 mice at higher levels than in B6 mice and treatment with IFN-ADV comparably increased these cytokines in both strains (Figure 1C and 1D).
Figure 1. Systemic cytokine levels after IFNα-ADV administration.
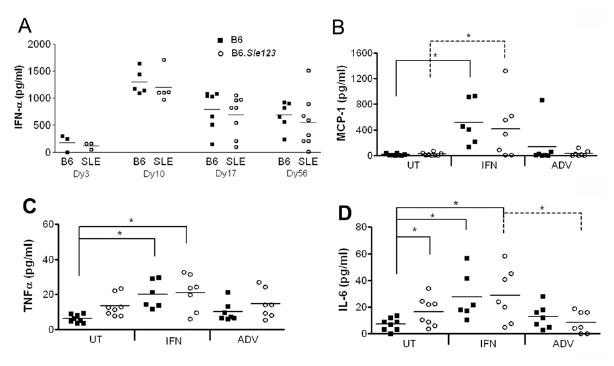
At the end of the study, sera from all mice were analyzed for cytokine levels using an IFN Elisa kit (a) or a CBA mouse inflammation cytokine kit, measuring MCP-1 (b), TNF (c) and IL-6 (d). *p<0.05.
IFNα promotes GN in B6.Sle123mice
Mice were euthanized at 8 weeks post-injection and their immune systems and kidneys were analysed for evidence of disease. IFN-ADV significantly increased the proteinuria in the B6.Sle123 mice with no effect on the B6 mice (Fig 2A). Histological analysis of the kidneys revealed severe GN in IFN-ADV treated mice, compared to mild levels in untreated B6.Sle123 mice or IFN-ADV treated B6 (Fig 2B, Fig 2C). B6 mice did not demonstrate GN scores higher than 2, regardless of treatment. The GN induced by IFN also promoted inflammation in the tubules and interstitium (Fig 2D). These results indicate that increased IFNα expression accelerates severe kidney disease leading to compromised kidney function in genetically predisposed B6.Sle123.
Figure 2. IFN promotes nephritis in the SLE mice.
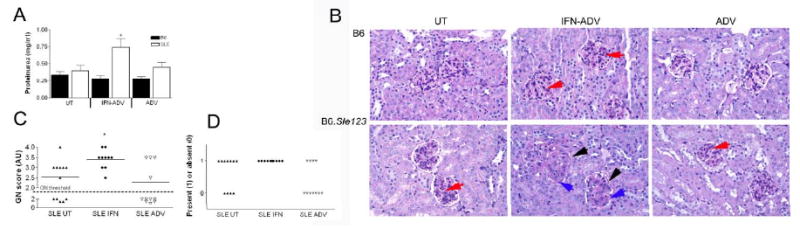
Proteinuria was quantified using Coumassie Blue (a) Kidney pathology was assessed using H&E staining (b). IFN-ADV B6 mice showed some mesangial proliferation within the glomeruli (red arrow). IFN-ADV SLE mice demonstrated thickened glomeruli walls (black arrow), extensive mesangial proliferation (blue arrow) and presence of larger phagocytes in the endocapillary space. Blind analysis of GN score according to WHO classifications (c) and inflammation in the tubules and interstitium was graded as absent or present (d).
IFNα promotes IC deposition B6.Sle123 mice
Fluorescent microscopy showed that B6.Sle123 mice which were untreated or injected with ADV had low levels of IgG deposition, in contrast to B6 mice which had little or none (Fig 3A). IFN-ADV treatment resulted in high levels of Ig deposition in B6.Sle123 mice and to a much lesser extent in the B6 controls (Fig 3B-D). Quantitation of this fluorescence demonstrated that both the area of deposition and intensity of fluorescence was increased, reflecting higher levels of IgG.
Figure 3. IFN promotes IC deposition in B6.Sle123 mice.
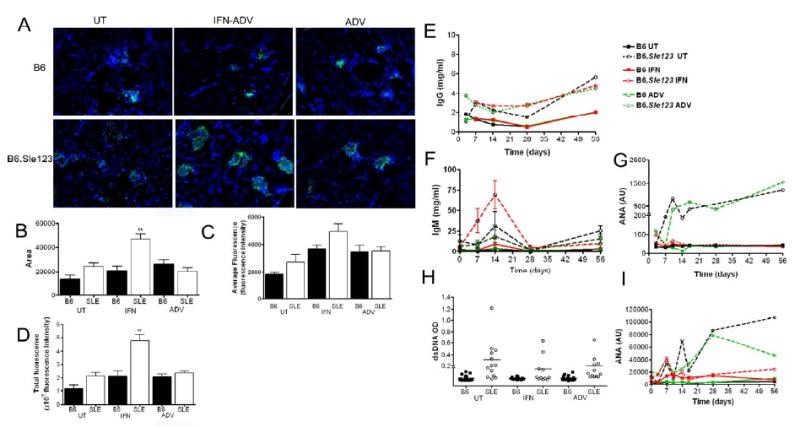
IgG deposition was analyzed using immunohistochemistry (a). IFN-ADV was associated increased areas of the kidney with IgG deposition (b) and within these areas increased intensity, or amount of IgG complex deposition (c). Integrated intensity analyses both extent and intensity of deposition (d). Sera were analyzed for total IgG (e), total IgM (f) IgG ANAs (g) IgG dsDNA (h),, and IgM ANAs (i) by Elisa.
Sera were analysed for total IgG and IgG autoantibodies (autoAbs) specific for chromatin and dsDNA by Elisa. B6.Sle123 developed higher levels of total serum IgG compared to B6, regardless of treatment (Fig 3E). Analysis of total serum IgM revealed an increase 14 days post-injection in B6.Sle123 mice, which was transient, falling back to baseline by 28 days post-injection (Fig 3F). Consistent with their lupus-prone phenotype, B6.Sle123 mice that were untreated or injected with ADV alone had high levels of autoAbs to chromatin at approximately 10 weeks of age (2 weeks post-injection), which increased throughout the course of the experiment (Fig 3G). Surprisingly, B6.Sle123 mice that were injected with IFN-ADV did not show any increase in the levels of IgG autoAbs specific for chromatin or dsDNA (4 months, Fig 3H). Analysis of IgM autoreactive antibodies revealed a similar profile to IgG anti-chomatin antibody titer (Fig 3I). Analysis of anti- SN RNP_U1 also demonstrated that IFN did not amplify serum autoantigen levels (Supplemental fig 1). In addition, we then assessed the spectrum of autoantigens recognized by sera of B6.Sle1Sle2Sle3 mice with and without IFN-ADV using proteomic arrays [30]. As shown in Supplemental Fig 2, the decreased titer of serum autoantibodies subsequent to IFN-ADV injection does not reflect a shift in the spectrum of autoantibodies produced by these mice away from chromatin or dsDNA. These findings indicate that high levels of systemic IFN did not strongly impact the levels of humoral autoimmunity that develop in this spontaneous model of SLE.
IFNα induces peripheral leukopenia and splenomegaly
Peripheral blood was assessed for phenotypic and cellular alterations during the course of the experiments. Analysis of peripheral blood populations throughout the duration of the study detected an overall leukopenia in IFN-ADV injected mice of both strains beginning at 7 days post-injection and persisting throughout the investigation (Table I and data not shown). Following euthanasia, peripheral blood, bone marrow and spleens were harvested for cellular analysis by flow cytometry. A characteristic phenotype of lupus-prone mice is splenomegaly. Consistent with this, untreated and ADV mice had significantly larger spleens compared to their B6 counterparts. IFN-ADV induced an approximate two fold increase in splenic size in both B6 and B6.Sle123 mice (Table I). Cellular analysis in young B6 versus B6.Sle123 mice revealed a variety of phenotypic variations (Supp. Table I) and increased activation of most cell types in the myeloid, B and T cell lineages in the bone marrow and spleen. However, most IFNα induced phenotypes were similar in B6 and B6.Sle123, with the most interesting differences between the strains occurring in the B cell population.
Table I.
IFNα induces splenomegaly and bone marrow lymphopenia in both B6 and B6.Sle123 mice.
| Spleen Weight (g) | Splenocytes (Total ×108) | Bone Marrow Cells (×107) | Peripheral Blood (×106) | |||||
|---|---|---|---|---|---|---|---|---|
| B6 (n=9) | SLE (n=8) | B6 (n=7) | SLE (n=7) | B6 (n=8) | SLE (n=8) | B6 (n=5) | SLE (n=5) | |
| Untreated | 0.11± 0.1 | 0.22± 0.3# | 1.13 ± 0.16 | 2.09# ± 0.33 | 6.26 ± 0.55 | 5.18 ± 0.53# | 2.1 ± 0.3 | 1.9 ± 0.2 |
| IFN-ADV | 0.27±0.3* | 0.43±0.5*# | 1.97 ± 0.47 | 5.10 ± 1.95 | 3.44± 0.37* | 1.92 ± 0.50* | 1.4 ± 0.5 | 1.5 ± 0.2 |
| ADV-CTL | 0.11±0.1 | 0.26±0.2# | 1.25 ± 0.10 | 2.41 ± 0.28 | 6.46 ± 0.88 | 4.86 ± 0.42# | 1.8 ± 0.3 | 1.8 ± 0.2 |
Results are expressed as mean ± SE with significant differences between treatment
p<0.05, and strain
p<0.05.
IFN induces lymphopenia and activation of B cells
Untreated B6.Sle123 mice have a lower percentage of circulating B cells compared to B6 controls (37.7±0.7 and 32.7 ±2.2 for B6 and B6.Sle123 mice respectively, n=5, p<0.05). Untreated young B6.Sle123 mice also had a lower percentage of resident splenic B cells (Supp Table I) compared to the B6 control mice (p<0.05), although the total splenic B cell count was slightly increased. B cell subpopulations were analysed using antibodies to CD23, CD21, IgM, CD5, CD11b and B220 [31]. B6.Sle123 mice also had a significantly reduced percentage of T2 (B220+, IgM++, CD21++, CD23+) cells and a visible increase in T1 (B220+, IgM+, CD21-, CD23-) B cells, suggesting an inhibition in maturity at the T1-T2 stage. These were young mice (14-16 weeks old) and therefore the disease severity should be mild with few major cellular alterations. Treatment with IFN-ADV resulted in a significant reduction in the percentage and total number of splenic B cells in B6 and B6.Sle123 mice and this persisted over the entire study. (Fig 4a and b). Splenic B cells were activated, with a higher expression of CD86 and CD69. In addition, they had significantly lower expression of IgD, suggesting memory or antibody-producing cells were increased as a consequence of IFN-ADV [32]. IFNα significantly increased the percentage and number of B1b cells in both strains of mice where they comprised 60% of total B220 cells. IFN-ADV treatment also resulted in an increase in plasma cells (Fig 4c). This was to a greater extent in B6.Sle123 mice, which also showed an increase in the number of GL7+B220+ cells, unlike B6, indicative of germinal centre formation [33]. IFN-ADV injection also resulted in a reduction in the percentage and number of follicular B cells (CD23+, CD21+, IgMint/lo).
Figure 4. IFN results in B cell leukopenia.
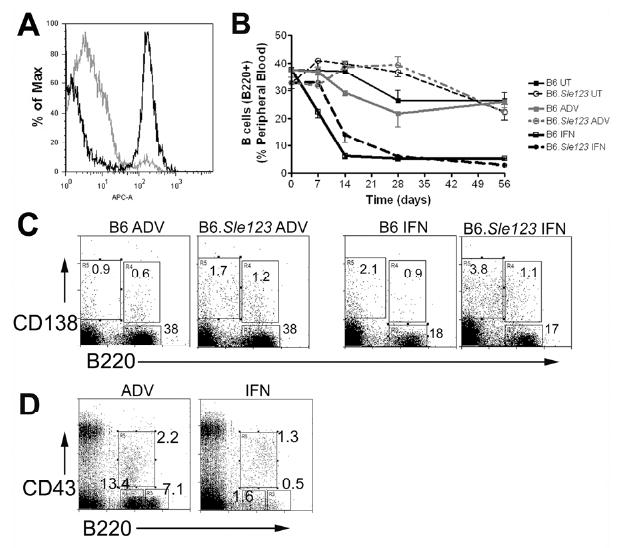
In a subset of mice (n=5 per group), peripheral blood lymphocytes were analyzed using flow cytometry. A representative B220 histogram is shown in (a) with a time course in (b). Representative plots for splenic B cells (B220+, CD138-) or plasma cells (B220-CD138+) is shown in (c). Early bone marrow B cell progenitors, ProB cells (CD43+B220+), PreB (CD43- B220+) and Immature B cells (CD43-B220++) are shown in a representative plot (d).
There was a reduction in the overall retrieval of bone marrow cells from B6.Sle123 when compared to B6, (Table I, p<0.05). B.Sle123 mice had fewer immature B cells and overall B220+ cells when compared to B6 control mice (Supp Table II). Cooper et al have shown that IFNα suppresses the IL-7 induced growth and survival of early B lineage cells [34-36]. Consistent with this, IFN-ADV induced a significant reduction in the total number of bone marrow cells (Table I) and immature B cells (Supp Table II) (Fig 4D). In addition, there was a significant loss in both PreB (B220+CD43-) and immature (B220++ CD43-) cells. The effect on Pro-B (B220+CD43+) cells was less obvious, but analysis of cell numbers demonstrated that ProB cells from B6.Sle123 mice were reduced after IFN-treatment (Supp Table II).
Overall, B6.Sle123 mice uniquely exhibited increased B1 and plasma cells after IFNα exposure, although both strains had an overall loss of mature B cells in the bone marrow, spleen and periphery.
IFN induces activation of myeloid cells, T cells, and apcs
Myeloid Cells
The CD11b lineage was examined in peripheral blood using the markers 7/4, CD62L and Gr1 recognizing Neutrophil 7/4 antigen (Neu7/4), L-selectin and Ly6C/Ly6G respectively, in accordance with previous characterizations[37-39]. Peripheral PMNs were Gr1+++, highly granular, CD62L+ and were Neu7/4-/+ (gate 1, Fig 5A). Analyses on pre-treated mice showed that B6.Sle123 mice have higher levels (percentage and number) of circulating PMNs which also expressed a higher expression of FcγRII/III (Fig 5B). Injection of IFN-ADV resulted in a sustained increase in the percentage of peripheral PMNs in B6 mice and a more transient increase in B6.Sle123 mice (Fig 5C). The overall cell numbers were unaltered, suggesting that the leukopenia was a result of leukocyte depletion and that IFN has no effect on PMN release from the bone marrow (data not shown). We identified 2 major populations peripheral monocyte in untreated mice, consistent with earlier reports [37, 38, 40]. We revealed the resident monocyte population which has been identified as 7/4+Gr1-CD11b+ 57. The Gr1+ CD11b+ population (G2, Fig 5d) was sub-gated using the marker 7/4+ to reveal the inflammatory monocyte population (G3, Fig 5e) which was CD11b+, Gr1+, CD62L+, 7/4+, and low granularity[37]. This gating strategy is consistent with an earlier report which confirmed that the Gr1 intermediate population are monocytes using microscopy and functional assays [37, 38, 40]. A backgating analysis using the neutrophil specific-Ly6G marker also demonstrated the defined resolution using 7/4 and Gr1 was correct (Supplemental figure 3).
Figure 5. Myeloid and T cell populations are affected by treatment with IFN.
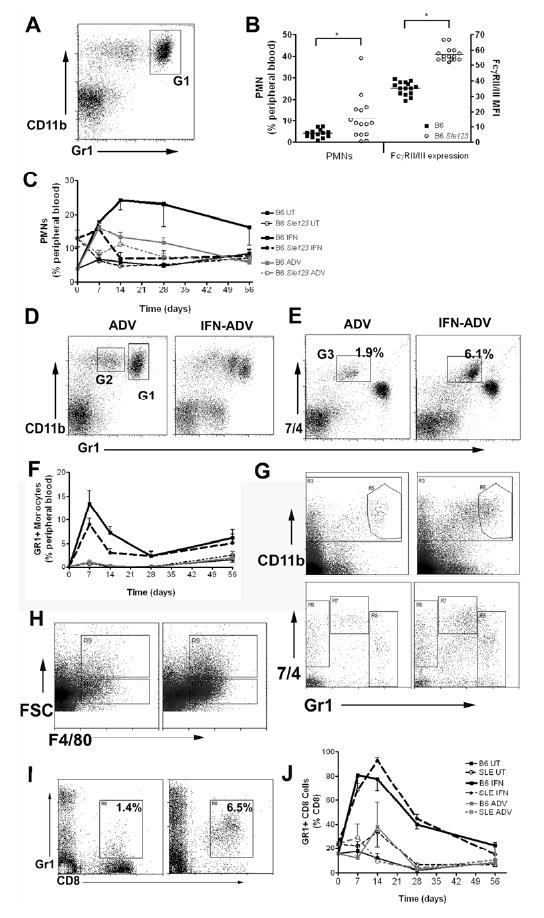
Peripheral blood myeloid cells were gated on the CD11b positive population and PMNs are Gr1hi and CD11b+ (a; Gate1). The number of PMNs, and expression of FcγRII/III is shown in (b). IFN resulted in an increase in the percentage of circulating PMNs (c). IFN results in an increase of a Gr1+CD11b+ population in the spleen in both strains (d; Gate2). Analysis using a 7/4 antibody pulls out the inflammatory population (e; G2). Effect of IFN on the percentage Gr1+ monocytes over 8 weeks (f). Gr1+ monocytes are increased in the spleen in IFN-treated mice (g). IFN results in an increase in the F4/80 positive population (h); both larger macrophage-like cells (high FSC) and smaller monocyte-like cells (low FSC). IFN induced an increase in expression of GR1+ on CD8+ cells in both strains of mice in response to IFN (representative plot; I, time course in (j)).
Treatment with IFN-ADV resulted in a dramatic increase in this population in both B6 and B6.Sle123 mice (Fig 5D and E). This peaked at day 7 and levels remained higher than basal levels throughout the 8 weeks of study (Fig 5F). Treatment with IFNα induced an increase in splenic Gr1+ monocytes in both strains (Fig 5G), similar to the results observed in the periphery. In addition, PMNs increased post-IFNα, also reflecting peripheral results (Supp Table I). The number and percentage of F4/80+ macrophages (FSChi) cells was higher in IFN-ADV injected mice, with a large expansion of the smaller F4/80+ cells (Fig 5H). The majority of these were not CD11b+. The extent to which this population increased (almost 4-fold) was greater than the degree of splenomegaly in both strains.
T lymphocytes
B6.Sle123 mice have lower percentages (and total numbers) of CD4 and CD8 cells in peripheral blood compared to B6. Untreated B6.Sle123 mice also have an increased expression of Ly6C, on peripheral CD8 cells (15.4±0.7 and 23.8±1.8 % Gr1+ on CD8+ for B6 and B6.Sle123 respectively, p<0.01). IFN-ADV also induced expression of Ly6C, on peripheral CD8+ T cells consistent with previous reports (Fig 5i) [41, 42]. This upregulation was transient, peaking at 7-14 days post-injection, returning to baseline levels by the end of the 8 weeks (Fig 5j). Infection of IFN-ADV had a similar effect on both B6.Sle123 and B6 mice, causing an overall decrease in CD4+ and CD8+ T cell numbers. Untreated or ADV-CTL injected B6.Sle123 mice had increased splenic CD8 cells in the spleens compared to B6 control mice (Supp Table I). IFN treatment resulted in an increase in total CD8+ and CD4+ numbers in B6.Sle123 mice.
In addition, there was an increase in the CD4+CD25+ population in B6.Sle123 mice, in contrast to the control B6 population. Although the CD4+CD25+ subpopulation of T cells contains T regulatory cells, it has become apparent that IL-2R (CD25) is upregulated upon activation and that to identify T regulatory cells requires the addition of Foxp3 and a suppressor assay. In our study, CD69 is also upregulated on CD4+ cells, which suggests that the upregulation of CD25 is most likely a reflection of increased activation. Further studies demonstrating that these cells suppress activation would be necessary to clarify their cell type.
DCs
In these studies we analysed DCs as B220+CD11c+MHC+CD86+, or CD11b+CD11c+MHC+CD86+, or CD8+CD11c+MHC+CD86+ subsets defining plasmacytoid DCs, myeloid DCs, and CD8+ DCs respectively [43-45]. In untreated mice, the numbers of CD11c+CD11b+ were greater in the B6.Sle123 spleen (Supp Table I p<0.05). The splenic numbers of CD11c+ B220+ and CD11c+CD8+ DCs were also 2-fold greater in B6.Sle123 mice compared to B6 (data not shown), but this was not significant (p=0.06 and p=0.05 respectively). IFN-ADV treatment resulted in a 2 fold increase in the splenic population of CD11b+ and CD8+ subsets (Supp Table I), with B6.Sle123 mice having significantly more CD11b+ cells after IFN treatment compared to B6.
Flow Cytometry Summary
Taken together these findings demonstrate that the IFN-ADV in B6.Sle123 mice increases the number of plasma and germinal center cells within the spleen, whilst increasing the numbers of inflammatory cells, including neutrophils and inflammatory monocytes. Furthermore, most leukocytes identified within the spleen and periphery demonstrated an increase in activation markers. This suggests that the addition of IFN drives the development of an inflammatory cellular mileu which culminates in the augmentation of disease.
Kidney Leukocyte Infiltration
Analysis of leukocyte infiltration into the kidney demonstrated that IFN induces leukocyte infiltration in non-autoimmune prone B6 mice (figure 6A). The cells were primarily CD8+CD3+ T cells (figure 6B and E) and Gr1+ monocytes (figure 6E). The overall percentage of macrophages (F4/80 high, figure 6F) decreased following IFN administration. The increase in these populations was associated with a concomitant decrease in the CD19+ lineage, consistent with data from the periphery, bone marrow and spleen (figure 6B). The triple congenic autoimmune prone strain had high levels of leukocyte infiltration regardless of treatment (Figure 6A). In addition, the variability was extremely high and may be reflective of the stochastic events of the spontaneous disease. The cells infiltrating the kidney were primarily CD3+ CD4 and CD8 cells (figure 6C and D). In addition, the Gr1+ monocyte population demonstrated increases in CD11c and MHC II expression without treatment (data not shown), indicating an activated phenotype. The variability observed within the B6.Sle123 CD45+ population was a constant observation throughout the lymphocyte and myeloid analysis and overall there was no overwhelming difference following IFN administration.
Figure 6. Analysis of Leukocyte infiltration within the kidney.
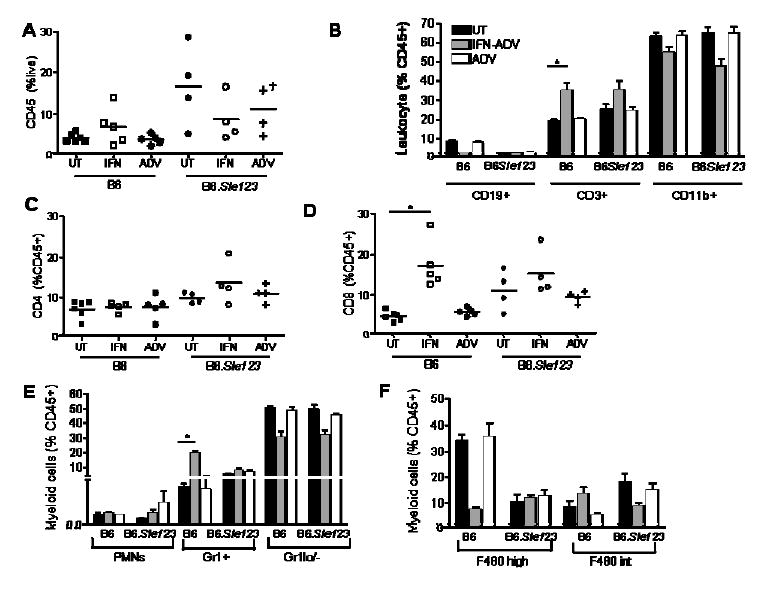
Kidneys were perfused and processed as described in the methods and flow cytometry was used to assess leukocyte infiltration and activation. IFN-ADV cause an increase in CD45+ cells into the kidney in B6 mice, whilst B6.Sle123 mice had higher levels regardless of treatment (a). Infiltrating cells were primarily CD3+ (b), with CD4+ increasing in B6.Sle123 mice (c) and CD8+ increasing in both strains (d). Within the myeloid lineage, Gr1+ cells were the predominant infiltrating cell (e). Examination of the Gr1 negative population (f) demonstrated that macrophages (F480 high) were not a dominant infiltrating cell.
Discussion
We have compared the cellular alterations and disease pathogenesis that develop in B6.Sle1Sle2Sle3 versus B6 subsequent to induction of systemic IFN levels using an adenovirus vector system. By comparing the impact of IFN on these congenic partners, which only differ by defined congenic intervals that contain SLE disease alleles, we have eliminated other complicating genetic factors that confound comparisons of classic lupus prone strains (such as NZB/W) with “normal” strains such as BALB/c.
Our results indicate that systemic treatment with IFN in B6.Sle123 accelerates kidney disease without dramatically increasing humoral autoimmunity. The kidney disease induced by IFN is not unlike the nephritis that develops in older B6.Sle123 mice, consisting of immune complex deposition, mesangial proliferation and thickened glomeruli walls. Systemic IFN does not lead to the development of kidney disease in B6 mice, although the overall impact of IFN on the immune system is comparable between B6 and B6.Sle123. This suggests that the major effect of IFN treatment on disease pathogenesis in this model is to drive end organ disease, possibly through its ability to activate a plethora of immune cells and cytokines and by promoting the development of immune complex deposition in the kidney.
The results also demonstrated that this augmentation of end organ disease was not associated with a concomitant increase in circulating ANA titer. Whilst levels of circulating IgG, and autoreactive dsDNA antibodies were unaffected, the autoantibodies specific for chromatin (DNA bound with histones) did not rise to their characteristic titer. This is most likely due to the deletion of autoreactive B cells in the bone marrow following IFN administration. This effect is not sufficient to remove all autoreactive cells within the system, since dsDNA antibodies are unaffected. In a previous study, anti-dsDNA antibodies were slightly increased by IFNα in a little over 50% of injected NZB/W mice at the end of the study[23]. We did not observe this effect. However, multiple studies suggest that this effect may depend on the specific pathways engaged following stimulation. Exogenous TLR stimuli which may induce production of IFNα, enhance lupus phenotypes, with differing effects on the progression of nephritis and/or circulating autoreactive Ig. In vivo administration of CpG, which stimulates the secretion of IFN from pDCs, drives the progression of nephritis in the MRL/lpr strain, whilst upregulating circulating IgG. However, when either TLR3 or TLR7 agonists are administered, the nephritis is augmented with no effect on serum Ig [46-50]. Furthermore, augmentation of kidney disease in the Nba2.NZW following TLR3 stimulation is reduced when the type I IFN receptor is eliminated [51] demonstrating the end organ pathogenic role of IFN. These results suggest that augmentation of innate immune responses may drive end-organ disease severity distinct from immune complex deposition, and this may depend on genetic background.
Examination of the spleen suggested that whilst many subsets were depleted post-IFN treatment, B1a and B1b cells were increased in both strains of mice, which would account for the observed increased levels of serum IgM. IFN also increased the percentage of Gr1+ Neu7/4+ cells in the periphery and spleen. This compartment probably contains the CX3CR1+CCR2+Gr1+ monocytes population which has been described by Geissmann et al as having greater migratory properties compared to a different subset with the phenotype CX3CR1++CCR2+Gr1-[38]. This subset preferentially migrates into inflammatory tissue where they may differentiate into DCs. This is consistent with our finding of an increase in CD11b+CD11c+ cells in the spleen.
Our investigations have demonstrated that IFN treatment of B6.Sle123 mice results in amplified B cell differentiation compared to B6 treated controls. In addition there is heightened CD4 proliferation and activation, increased inflammatory monocyte subset and increased numbers of conventional DCs compared to IFN-treated B6 mice. Together, these effects can provide the cellular milieu which results in antigen presentation, inflammation and kidney destruction. This is consistent with the model described earlier in humans, where pDCs drive B cell differentiation into plasma cells via IFNα and IL-6, after an infection from a pathogenic organism. In addition, IFNα drives monocytes to differentiate into myeloid DCs which may then activate and delay apoptosis of antigen-specific CD4 cells[52]. In our model, the infection has been bypassed by using IFNα expressed in an adenoviral system, providing the bridge between innate and adaptive immunity.
We are investigating the role of monocytes and macrophages to a greater extent since our studies showed an extensive upregulation in the myeloid lineage, and inhibition of their recruitment to the kidney ameliorates disease[53, 54]. We have demonstrated that the susceptibility to IFN-induced-disease-augmentation lies within the Sle1, Sle2 and/or Sle3 regions. Therefore, the examination of IFN on the B6.Sle1 B6.Sle2 and B6.Sle3 congenic strains will help to determine the necessary events required for development of GN.
Materials and Methods
Reagents and mice
All mice were bred in the University of Texas Southwestern Medical Center using breeding pairs originally obtained from the Jackson laboratory. Mice were 8-10 week old females. The derivation of B6.Sle1Sle2Sle3Sle5 (B6.Sle123) congenic mice bearing NZM2410-lupus susceptibility intervals has been detailed previously [55]. The care and use of laboratory animals conformed to the National Institutes of Health guidelines and all experimental procedures conformed to an IACUC approved animal protocol. The IFN adenovirus (IFN-ADV) or control (ADV) was purchased from Q-Biogene (Montreal, CA). Ad5.CMV-mIFN-α expresses the murine IFNα5 gene under the control of the Cytomegalovirus–IE promoter/enhancer. Ad5.Null contains an empty expression vector and was used as a control. Mice were injected with 3×10⁹ viral particles and monitored for up to 8weeks post-injection. Groups of mice were set up in 4 separate experiments with a minimum of 3 mice per group per experiment. Urine, sera and peripheral blood were taken throughout the monitoring period.
Assessment of Renal Disease
Mice were caged in metabolic cages and urine was collected over a 24h period. Protein was measured using Coommassie® Blue (Pierce Biotechnology Inc. Rockford, IL) as per manufacturer's instructions. BSA (Pierce) was used as a standard. Following euthanasia kidneys were fixed in formulin, and embedded in paraffin for blinded analysis by an independent pathologist (JZ) to assess the degree of glomerularnephritis (GN), as previously described[56]. Kidneys were also analyzed for Ig deposition at the BIIR Imaging Core. Kidneys were frozen in OCT media (Sakura, Tokyo, JP) and stored at -70°C and stained for Complement and IgG as previously described [23]. Briefly, sections were stained with a cocktail of FITC-conjugated rat anti-mouse IgG1, IgG2a, IgG2b and IgG3 (BD Pharmingen, San Jose CA) for 1h at room temp. Sections were analyzed using an Olympus BX51 fluorescence microscope equip with planapo 10× NA 0.40, and 20× NA 0.70 dry objectives. Post acquisition image quantization was assessed using Metamorph 6.2 (Universal Imaging, Molecular Devices, Downington, PA) software.
Cell Quantification and Flow Cytometry
Cells were counted using Turks solution (0.01% crystal violet and 3% acetic acid in distilled water) which stains nucleated cells. In addition, Sphero™ AccuCount particles (Spherotech, Libertyville, IL) were used to count via flow cytometry, as per the manufacturer's instructions. Cell suspensions were washed with staining buffer and suspended in Fc-block (mAb 24G2) together with a combination of up to 6 directly conjugated fluorescent antibodies and 1 biotinylated antibody (fitc, pe, pecy5, pecy7, apc and apccy7 all from BD Pharmingen, except Neu7/4pe (Serotec)). Cells were incubated for 40min in the dark on ice. Cells were washed 3 times in staining buffer and then incubated in Streptavidin Pe-Texas Red (BD Pharmingen) at 1:400 dilution of stock for 30mins in the dark. Red Blood cell lysis and cellular fixation was completed using BD Facs Lysing solution (BD Biosciences). Cells were washed as above and samples were maintained in 1% paraformaldehyde and run within 24hs on a Cytomation Cyan® flow cytometer. Acquisition and analysis was completed using the Cytomation Summit® 4.0 software. Kidneys were prepared as described previously [57] and as out lined in the methods. Briefly they were minced and resuspended into 0.75mls of PBS. Cells were spun down and the supernatant was kept at -20°C for cytokine analysis. Cells were resuspended in digestion buffer, consisting of Collagenase (1mg/ml) and DNase (1ug/ml) in RPMI Complete Media and incubated at 37°C for 30mins. Cells were centrifuged and filtered through a 70uM mesh and then mixed 1:1 with 40% Percoll solution. This was centrifuged 3000rpm/20mins/RT/brake off. The loose pellet was washed, counted and resuspended in staining buffer. Acquisition and analysis was completed using a BD LSR II with Diva software, and Flowjo 7.2 for Windows, Treestar.
Elisas and Cytokine Analysis
IFNα was detected using an Elisa kit from PBL as per protocol. The detection range was between 12.5-5000pg/ml. Serum cytokines were analyzed using the murine inflammation CBA kit (BD).
Serum ANAs were analyzed using an anti-histone-DNA antibody Elisa as described previously [58]. Briefly, Immulon II plates (Dynatech Laboratories, Chantilly, VA), precoated with methylated BSA, were coated overnight with 50μg/ml dsDNA (Sigma-Aldrich) and 10μg/ml total histones (Roche Applied Science, Indianapolis, IN) at 4°C. After blocking with PBS/3% BSA/0.1% gelatin/3mM EDTA, 1/100 dilutions of the test sera were incubated in duplicate for 2h at room temperature. Bound IgG was detected with alkaline phosphatase (AP)-conjugated anti-mouse IgG (Jackson ImmunoResearch Laboratories, West Grove, PA or IgM–AP (Southern Biotech)) using pNPP as a substrate. Raw OD was converted to U/ml using positive control serum from an NZM2410 mouse. The reactivity of a 1/100 dilution of this serum was arbitrarily set to 100 U/ml.
For total Ig, 96 well, Immulon II plates (Dynatech Laboratories) plates were coated with 4ug/ml of goat anti-mouse IgG or IgM (IgG; GAMκ Caltag, Burlingame, CA or IgM; Southern Biotech, Birmingham, AL) and incubated for 30min at 37°C. Plates were washed and blocked with 3% BSA/3mM EDTA overnight at 4°C. Serial dilutions of the standard IgG (Southern Biotech)/IgM (Sigma) or diluted samples were added and incubated for 2hs at room temp. After washing 50ul of the secondary HRP-conjugated goat anti-mouse gamma (-HRPO-GAMγ Caltag or IgM-HRP (Jackson ImmunoResearch)) was added and the plates incubated at 4°C overnight. TMB substrate solution was then used to detect binding as per manufacturer's instructions (Promega, Madison WI).
Statistical Analysis
Results are expressed as the arithmetic mean ± standard error of the mean (SE). Comparative means were assessed using either an unpaired t-test or 1 way ANOVA with Dunn post-hoc test. Significance is represented by a probable value, p<0.05. Kinetic changes were analysed using 1-way ANOVA. Significant changes, p<0.05, were then analyzed using the Bonferroni Dunn post-hoc test that analyzes associations between every combination of two parameters within the data. Analyses were completed, InSTAT version 3.0 for Windows, GraphPad Software, San Diego CA, USA and Statview, version 5.0.1 for Windows, SAS Institute Inc., Cary, NC, USA.
Supplementary Material
Acknowledgments
This work was supported by grants from the NIH and the Alliance for Lupus Research to EKW. The BIIR group is supported in parts by the BHCS Foundation and the NIH through grants: RO-1-AI 068842 to JB and P50-CORT-Center for Lupus Research AR054083(PI: Virginia Pascual). JC is supported by NIH U19 AI057234. We thank Angie Mobley, Department of Immunology at UT Southwestern Medical Center for assistance with flow cytometry and Sandra Clayton, BIIR for assistance with microscopy. We also thank Jose Casco for breeding all the mice used in these studies.
Abbreviations
- SLE
Systemic Lupus Erythematosus
- ANA
anti-nuclear antibodies
- ADV
Adenovirus
- IC
Immune complex
- GN
glomerulonephritis
- DC
Dendritic Cell
Footnotes
Disclosures: Jacques Banchereau has a financial interest in the development of an anti-IFN anti-IFN antibody for management of SLE.
References
- 1.Wakeland EK, Liu K, Graham RR, Behrens TW. Delineating the genetic basis of systemic lupus erythematosus. Immunity. 2001;15:397–408. doi: 10.1016/s1074-7613(01)00201-1. [DOI] [PubMed] [Google Scholar]
- 2.Vyse TJ, Kotzin BL. Genetic susceptibility to systemic lupus erythematosus. Annu Rev Immunol. 1998;16:261–292. doi: 10.1146/annurev.immunol.16.1.261. [DOI] [PubMed] [Google Scholar]
- 3.Harley JB, Moser KL, Gaffney PM, Behrens TW. The genetics of human systemic lupus erythematosus. Curr Opin Immunol. 1998;10:690–696. doi: 10.1016/s0952-7915(98)80090-3. [DOI] [PubMed] [Google Scholar]
- 4.Marrack P, Kappler J, Kotzin BL. Autoimmune disease: why and where it occurs. Nat Med. 2001;7:899–905. doi: 10.1038/90935. [DOI] [PubMed] [Google Scholar]
- 5.Lipsky PE. Systemic lupus erythematosus: an autoimmune disease of B cell hyperactivity. Nat Immunol. 2001;2:764–766. doi: 10.1038/ni0901-764. [DOI] [PubMed] [Google Scholar]
- 6.Desai-Mehta A, Lu L, Ramsey-Goldman R, Datta SK. Hyperexpression of CD40 ligand by B and T cells in human lupus and its role in pathogenic autoantibody production. J Clin Invest. 1996;97:2063–2073. doi: 10.1172/JCI118643. [DOI] [PMC free article] [PubMed] [Google Scholar]
- 7.Wandl UB, Nagel-Hiemke M, May D, Kreuzfelder E, Kloke O, Kranzhoff M, Seeber S, Niederle N. Lupus-like autoimmune disease induced by interferon therapy for myeloproliferative disorders. Clin Immunol Immunopathol. 1992;65:70–74. doi: 10.1016/0090-1229(92)90250-r. [DOI] [PubMed] [Google Scholar]
- 8.Vallin H, Perers A, Alm GV, Ronnblom L. Anti-double-stranded DNA antibodies and immunostimulatory plasmid DNA in combination mimic the endogenous IFN-alpha inducer in systemic lupus erythematosus. J Immunol. 1999;163:6306–6313. [PubMed] [Google Scholar]
- 9.Vallin H, Blomberg S, Alm GV, Cederblad B, Ronnblom L. Patients with systemic lupus erythematosus (SLE) have a circulating inducer of interferon-alpha (IFN-alpha) production acting on leucocytes resembling immature dendritic cells. Clin Exp Immunol. 1999;115:196–202. doi: 10.1046/j.1365-2249.1999.00772.x. [DOI] [PMC free article] [PubMed] [Google Scholar]
- 10.Schilling PJ, Kurzrock R, Kantarjian H, Gutterman JU, Talpaz M. Development of systemic lupus erythematosus after interferon therapy for chronic myelogenous leukemia. Cancer. 1991;68:1536–1537. doi: 10.1002/1097-0142(19911001)68:7<1536::aid-cncr2820680713>3.0.co;2-b. [DOI] [PubMed] [Google Scholar]
- 11.Ronnblom LE, Alm GV, Oberg KE. Autoimmunity after alpha-interferon therapy for malignant carcinoid tumors. Ann Intern Med. 1991;115:178–183. doi: 10.7326/0003-4819-115-3-178. [DOI] [PubMed] [Google Scholar]
- 12.Preble OT, Rothko K, Klippel JH, Friedman RM, Johnston MI. Interferon-induced 2′-5′ adenylate synthetase in vivo and interferon production in vitro by lymphocytes from systemic lupus erythematosus patients with and without circulating interferon. J Exp Med. 1983;157:2140–2146. doi: 10.1084/jem.157.6.2140. [DOI] [PMC free article] [PubMed] [Google Scholar]
- 13.Dall'era MC, Cardarelli PM, Preston BT, Witte A, Davis JC., Jr Type I interferon correlates with serological and clinical manifestations of SLE. Ann Rheum Dis. 2005;64:1692–1697. doi: 10.1136/ard.2004.033753. [DOI] [PMC free article] [PubMed] [Google Scholar]
- 14.Blanco P, Palucka AK, Gill M, Pascual V, Banchereau J. Induction of dendritic cell differentiation by IFN-alpha in systemic lupus erythematosus. Science. 2001;294:1540–1543. doi: 10.1126/science.1064890. [DOI] [PubMed] [Google Scholar]
- 15.Kirou KA, Lee C, George S, Louca K, Peterson MG, Crow MK. Activation of the interferon-alpha pathway identifies a subgroup of systemic lupus erythematosus patients with distinct serologic features and active disease. Arthritis Rheum. 2005;52:1491–1503. doi: 10.1002/art.21031. [DOI] [PubMed] [Google Scholar]
- 16.Han GM, Chen SL, Shen N, Ye S, Bao CD, Gu YY. Analysis of gene expression profiles in human systemic lupus erythematosus using oligonucleotide microarray. Genes Immun. 2003;4:177–186. doi: 10.1038/sj.gene.6363966. [DOI] [PubMed] [Google Scholar]
- 17.Crow MK, Wohlgemuth J. Microarray analysis of gene expression in lupus. Arthritis Res Ther. 2003;5:279–287. doi: 10.1186/ar1015. [DOI] [PMC free article] [PubMed] [Google Scholar]
- 18.Bennett L, Palucka AK, Arce E, Cantrell V, Borvak J, Banchereau J, Pascual V. Interferon and granulopoiesis signatures in systemic lupus erythematosus blood. J Exp Med. 2003;197:711–723. doi: 10.1084/jem.20021553. [DOI] [PMC free article] [PubMed] [Google Scholar]
- 19.Baechler EC, Batliwalla FM, Karypis G, Gaffney PM, Ortmann WA, Espe KJ, Shark KB, Grande WJ, Hughes KM, Kapur V, Gregersen PK, Behrens TW. Interferon-inducible gene expression signature in peripheral blood cells of patients with severe lupus. Proc Natl Acad Sci U S A. 2003;100:2610–2615. doi: 10.1073/pnas.0337679100. [DOI] [PMC free article] [PubMed] [Google Scholar]
- 20.Santiago-Raber ML, Baccala R, Haraldsson KM, Choubey D, Stewart TA, Kono DH, Theofilopoulos AN. Type-I interferon receptor deficiency reduces lupus-like disease in NZB mice. J Exp Med. 2003;197:777–788. doi: 10.1084/jem.20021996. [DOI] [PMC free article] [PubMed] [Google Scholar]
- 21.Hron JD, Peng SL. Type I IFN protects against murine lupus. J Immunol. 2004;173:2134–2142. doi: 10.4049/jimmunol.173.3.2134. [DOI] [PubMed] [Google Scholar]
- 22.Braun D, Geraldes P, Demengeot J. Type I Interferon controls the onset and severity of autoimmune manifestations in lpr mice. J Autoimmun. 2003;20:15–25. doi: 10.1016/s0896-8411(02)00109-9. [DOI] [PubMed] [Google Scholar]
- 23.Mathian A, Weinberg A, Gallegos M, Banchereau J, Koutouzov S. IFN-alpha induces early lethal lupus in preautoimmune (New Zealand Black × New Zealand White) F1 but not in BALB/c mice. J Immunol. 2005;174:2499–2506. doi: 10.4049/jimmunol.174.5.2499. [DOI] [PubMed] [Google Scholar]
- 24.Morel L, Rudofsky UH, Longmate JA, Schiffenbauer J, Wakeland EK. Polygenic control of susceptibility to murine systemic lupus erythematosus. Immunity. 1994;1:219–229. doi: 10.1016/1074-7613(94)90100-7. [DOI] [PubMed] [Google Scholar]
- 25.Morel L, Yu Y, Blenman KR, Caldwell RA, Wakeland EK. Production of congenic mouse strains carrying genomic intervals containing SLE-susceptibility genes derived from the SLE-prone NZM2410 strain. Mamm Genome. 1996;7:335–339. doi: 10.1007/s003359900098. [DOI] [PubMed] [Google Scholar]
- 26.Morel L, Blenman KR, Croker BP, Wakeland EK. The major murine systemic lupus erythematosus susceptibility locus, Sle1, is a cluster of functionally related genes. Proc Natl Acad Sci U S A. 2001;98:1787–1792. doi: 10.1073/pnas.031336098. [DOI] [PMC free article] [PubMed] [Google Scholar]
- 27.Mohan C, Yu Y, Morel L, Yang P, Wakeland EK. Genetic dissection of Sle pathogenesis: Sle3 on murine chromosome 7 impacts T cell activation, differentiation, and cell death. J Immunol. 1999;162:6492–6502. [PubMed] [Google Scholar]
- 28.Mohan C, Alas E, Morel L, Yang P, Wakeland EK. Genetic dissection of SLE pathogenesis. Sle1 on murine chromosome 1 leads to a selective loss of tolerance to H2A/H2B/DNA subnucleosomes. J Clin Invest. 1998;101:1362–1372. doi: 10.1172/JCI728. [DOI] [PMC free article] [PubMed] [Google Scholar]
- 29.Mohan C, Morel L, Yang P, Wakeland EK. Genetic dissection of systemic lupus erythematosus pathogenesis: Sle2 on murine chromosome 4 leads to B cell hyperactivity. J Immunol. 1997;159:454–465. [PubMed] [Google Scholar]
- 30.Li QZ, Xie C, Wu T, Mackay M, Aranow C, Putterman C, Mohan C. Identification of autoantibody clusters that best predict lupus disease activity using glomerular proteome arrays. J Clin Invest. 2005;115:3428–3439. doi: 10.1172/JCI23587. [DOI] [PMC free article] [PubMed] [Google Scholar]
- 31.Loder F, Mutschler B, Ray RJ, Paige CJ, Sideras P, Torres R, Lamers MC, Carsetti R. B cell development in the spleen takes place in discrete steps and is determined by the quality of B cell receptor-derived signals. J Exp Med. 1999;190:75–89. doi: 10.1084/jem.190.1.75. [DOI] [PMC free article] [PubMed] [Google Scholar]
- 32.Youinou P, Jamin C, Pers JO, Berthou C, Saraux A, Renaudineau Y. B lymphocytes are required for development and treatment of autoimmune diseases. Ann N Y Acad Sci. 2005;1050:19–33. doi: 10.1196/annals.1313.003. [DOI] [PubMed] [Google Scholar]
- 33.Han S, Zheng B, Schatz DG, Spanopoulou E, Kelsoe G. Neoteny in lymphocytes: Rag1 and Rag2 expression in germinal center B cells. Science. 1996;274:2094–2097. doi: 10.1126/science.274.5295.2094. [DOI] [PubMed] [Google Scholar]
- 34.Wang J, Lin Q, Langston H, Cooper MD. Resident bone marrow macrophages produce type 1 interferons that can selectively inhibit interleukin-7-driven growth of B lineage cells. Immunity. 1995;3:475–484. doi: 10.1016/1074-7613(95)90176-0. [DOI] [PubMed] [Google Scholar]
- 35.Su DM, Wang J, Lin Q, Cooper MD, Watanabe T. Interferons alpha/beta inhibit IL-7-induced proliferation of CD4- CD8- CD3- CD44+ CD25+ thymocytes, but do not inhibit that of CD4- CD8- CD3- CD44- CD25-thymocytes. Immunology. 1997;90:543–549. doi: 10.1046/j.1365-2567.1997.00205.x. [DOI] [PMC free article] [PubMed] [Google Scholar]
- 36.Lin Q, Dong C, Cooper MD. Impairment of T and B cell development by treatment with a type I interferon. J Exp Med. 1998;187:79–87. doi: 10.1084/jem.187.1.79. [DOI] [PMC free article] [PubMed] [Google Scholar]
- 37.Taylor PR, Brown GD, Geldhof AB, Martinez-Pomares L, Gordon S. Pattern recognition receptors and differentiation antigens define murine myeloid cell heterogeneity ex vivo. Eur J Immunol. 2003;33:2090–2097. doi: 10.1002/eji.200324003. [DOI] [PubMed] [Google Scholar]
- 38.Geissmann F, Jung S, Littman DR. Blood monocytes consist of two principal subsets with distinct migratory properties. Immunity. 2003;19:71–82. doi: 10.1016/s1074-7613(03)00174-2. [DOI] [PubMed] [Google Scholar]
- 39.Brown NJ, Hutcheson J, Bickel E, Scatizzi JC, Albee LD, Haines GK, 3rd, Eslick J, Bradley K, Taricone E, Perlman H. Fas death receptor signaling represses monocyte numbers and macrophage activation in vivo. J Immunol. 2004;173:7584–7593. doi: 10.4049/jimmunol.173.12.7584. [DOI] [PubMed] [Google Scholar]
- 40.Henderson RB, Hobbs JA, Mathies M, Hogg N. Rapid recruitment of inflammatory monocytes is independent of neutrophil migration. Blood. 2003;102:328–335. doi: 10.1182/blood-2002-10-3228. [DOI] [PubMed] [Google Scholar]
- 41.Schlueter AJ, Krieg AM, de Vries P, Li X. Type I interferon is the primary regulator of inducible Ly-6C expression on T cells. J Interferon Cytokine Res. 2001;21:621–629. doi: 10.1089/10799900152547885. [DOI] [PubMed] [Google Scholar]
- 42.Dumont FJ, Coker LZ. Interferon-alpha/beta enhances the expression of Ly-6 antigens on T cells in vivo and in vitro. Eur J Immunol. 1986;16:735–740. doi: 10.1002/eji.1830160704. [DOI] [PubMed] [Google Scholar]
- 43.Shortman K, Liu YJ. Mouse and human dendritic cell subtypes. Nat Rev Immunol. 2002;2:151–161. doi: 10.1038/nri746. [DOI] [PubMed] [Google Scholar]
- 44.Rizzitelli A, Hawkins E, Todd H, Hodgkin PD, Shortman K. The proliferative response of CD4 T cells to steady-state CD8+ dendritic cells is restricted by post-activation death. Int Immunol. 2006;18:415–423. doi: 10.1093/intimm/dxh382. [DOI] [PubMed] [Google Scholar]
- 45.O'Keeffe M, Grumont RJ, Hochrein H, Fuchsberger M, Gugasyan R, Vremec D, Shortman K, Gerondakis S. Distinct roles for the NF-kappaB1 and c-Rel transcription factors in the differentiation and survival of plasmacytoid and conventional dendritic cells activated by TLR-9 signals. Blood. 2005;106:3457–3464. doi: 10.1182/blood-2004-12-4965. [DOI] [PubMed] [Google Scholar]
- 46.Pawar RD, Patole PS, Zecher D, Segerer S, Kretzler M, Schlondorff D, Anders HJ. Toll-like receptor-7 modulates immune complex glomerulonephritis. J Am Soc Nephrol. 2006;17:141–149. doi: 10.1681/ASN.2005070714. [DOI] [PubMed] [Google Scholar]
- 47.Anders HJ, Banas B, Linde Y, Weller L, Cohen CD, Kretzler M, Martin S, Vielhauer V, Schlondorff D, Grone HJ. Bacterial CpG-DNA aggravates immune complex glomerulonephritis: role of TLR9-mediated expression of chemokines and chemokine receptors. J Am Soc Nephrol. 2003;14:317–326. doi: 10.1097/01.asn.0000042169.23931.73. [DOI] [PubMed] [Google Scholar]
- 48.Anders HJ. A Toll for lupus. Lupus. 2005;14:417–422. doi: 10.1191/0961203305lu2102rr. [DOI] [PubMed] [Google Scholar]
- 49.Patole PS, Grone HJ, Segerer S, Ciubar R, Belemezova E, Henger A, Kretzler M, Schlondorff D, Anders HJ. Viral double-stranded RNA aggravates lupus nephritis through Toll-like receptor 3 on glomerular mesangial cells and antigen-presenting cells. J Am Soc Nephrol. 2005;16:1326–1338. doi: 10.1681/ASN.2004100820. [DOI] [PubMed] [Google Scholar]
- 50.Anders HJ, Vielhauer V, Eis V, Linde Y, Kretzler M, Perez de Lema G, Strutz F, Bauer S, Rutz M, Wagner H, Grone HJ, Schlondorff D. Activation of toll-like receptor-9 induces progression of renal disease in MRL-Fas(lpr) mice. Faseb J. 2004;18:534–536. doi: 10.1096/fj.03-0646fje. [DOI] [PubMed] [Google Scholar]
- 51.Jorgensen TN, Thurman J, Izui S, Falta MT, Metzger TE, Flannery SA, Kappler J, Marrack P, Kotzin BL. Genetic susceptibility to polyI:C-induced IFNalpha/beta-dependent accelerated disease in lupus-prone mice. Genes Immun. 2006;7:555–567. doi: 10.1038/sj.gene.6364329. [DOI] [PubMed] [Google Scholar]
- 52.Jego G, Pascual V, Palucka AK, Banchereau J. Dendritic cells control B cell growth and differentiation. Curr Dir Autoimmun. 2005;8:124–139. doi: 10.1159/000082101. [DOI] [PubMed] [Google Scholar]
- 53.Shimizu S, Nakashima H, Masutani K, Inoue Y, Miyake K, Akahoshi M, Tanaka Y, Egashira K, Hirakata H, Otsuka T, Harada M. Anti-monocyte chemoattractant protein-1 gene therapy attenuates nephritis in MRL/lpr mice. Rheumatology (Oxford) 2004;43:1121–1128. doi: 10.1093/rheumatology/keh277. [DOI] [PubMed] [Google Scholar]
- 54.Inoue A, Hasegawa H, Kohno M, Ito MR, Terada M, Imai T, Yoshie O, Nose M, Fujita S. Antagonist of fractalkine (CX3CL1) delays the initiation and ameliorates the progression of lupus nephritis in MRL/lpr mice. Arthritis Rheum. 2005;52:1522–1533. doi: 10.1002/art.21007. [DOI] [PubMed] [Google Scholar]
- 55.Morel L, Croker BP, Blenman KR, Mohan C, Huang G, Gilkeson G, Wakeland EK. Genetic reconstitution of systemic lupus erythematosus immunopathology with polycongenic murine strains. Proc Natl Acad Sci U S A. 2000;97:6670–6675. doi: 10.1073/pnas.97.12.6670. [DOI] [PMC free article] [PubMed] [Google Scholar]
- 56.Xie C, Zhou XJ, Liu X, Mohan C. Enhanced susceptibility to end-organ disease in the lupus-facilitating NZW mouse strain. Arthritis Rheum. 2003;48:1080–1092. doi: 10.1002/art.10887. [DOI] [PubMed] [Google Scholar]
- 57.Wang A, Fairhurst AM, Tus K, Subramanian S, Liu Y, Lin F, Igarashi P, Zhou XJ, Batteux F, Wong D, Wakeland EK, Mohan C. CXCR4/CXCL12 dysregulation plays a pivotal role in murine lupus nephritis. 2008 doi: 10.4049/jimmunol.0801920. Submitted. [DOI] [PMC free article] [PubMed] [Google Scholar]
- 58.Mohan C, Morel L, Yang P, Watanabe H, Croker B, Gilkeson G, Wakeland EK. Genetic dissection of lupus pathogenesis: a recipe for nephrophilic autoantibodies. J Clin Invest. 1999;103:1685–1695. doi: 10.1172/JCI5827. [DOI] [PMC free article] [PubMed] [Google Scholar]
Associated Data
This section collects any data citations, data availability statements, or supplementary materials included in this article.