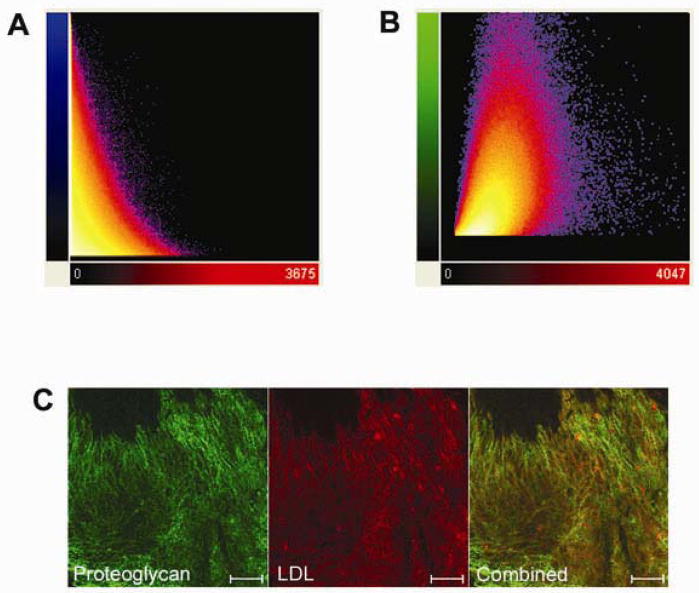
Figure 7.
Co-localization analysis of LDL binding at porcine coronary arterial branch points. A, Quantification of colocalization between collagen and LDL. Pixel codistribution was calculated for blue (collagen) and red (LDL) channels for z-series two-photon data sets. Two-dimensional histogram (fluorogram) show the distribution of pixel intensities for collagen vs. LDL with poor co-localization (n = 3). B, Quantification of co-localization between proteoglycans and LDL. Pixel co-distribution was calculated for green (proteoglycan) and red (LDL) channels. Two-dimensional histogram showed that the distribution of pixel intensities for proteoglycans vs. LDL revealing a positive spatial correlation. Pearson correlation coefficient demonstrates that there is significantly greater co-localization between LDL and proteoglycans (0.469 ± 0.030) compared with LDL and collagen (0.056 ± 0.075). (1 = perfect correlation, 0 = no correlation, and −1 = perfect inverse correlation). C, Two-photon image of LDL (red) colocalization with immunolabeled proteoglycans (green).

