

Abstract
Objective
To investigate whether a diet with a reduced glycaemic index (GI) has effects on appetite, energy intake, body weight and composition in overweight and obese female subjects.
Design
Randomised crossover intervention study including two consecutive 12-week periods. Lower or higher GI versions of key carbohydrate-rich foods (breads, breakfast cereals, rice and pasta/potatoes) were provided to subjects to be incorporated into habitual diets in ad libitum quantities. Foods intended as equivalents to each other were balanced in macronutrient composition, fibre content and energy density.
Subjects
19 overweight and obese women, weight-stable, with moderate hyperinsulinaemia (age: 34-65 years, BMI: 25-47 kg/m2, fasting insulin: 49-156 pmol/l).
Measurements
Dietary intake, body weight and composition after each 12-week intervention. Subjectively-rated appetite and short-term ad libitum energy intake at a snack and lunch meal following fixed lower and higher GI test breakfasts (GI 52 vs. 64) in a laboratory setting.
Results
Free-living diets differed in GI by 8.4 units (55.5 vs. 63.9), with key foods providing 48% of carbohydrate intake during both periods. There were no differences in energy intake, body weight or body composition between treatments. On laboratory investigation days, there were no differences in subjective ratings of hunger or fullness, or in energy intake at the snack or lunch meal.
Conclusion
This study provides no evidence to support an effect of a reduced GI diet on satiety, energy intake or body weight in overweight/obese women. Claims that the GI of the diet per se may have specific effects on body weight may therefore be misleading.
Keywords: Glycaemic index, carbohydrate, satiety, energy intake, body weight
Introduction
Low glycaemic index (GI) foods have been highlighted as a possible aid to weight control [1]. A number of short-term intervention studies have shown that low compared with high GI meals increase satiety and delay the return of hunger, and/or reduce energy intake at a later meal [2]. Other mechanisms for a beneficial effect of low versus high GI diets have also been suggested, including reduced decreases in resting energy expenditure on low versus high GI hypoenergetic diets [3], promotion of nutrient oxidation rather than storage [4-7] and selective loss of fat rather than lean mass [8]. Despite these findings, together with the physiological plausibility of these mechanisms, results of intervention studies have been mixed and others have seen no effects on them [9-11]. A number of the studies have been confounded by dietary differences other than GI, and have compared foods or meals with differing energy, macronutrient and/or fibre contents. .
Similarly, a number of the longer-term intervention studies investigating the effect of GI on the outcome of body weight have not used well-matched diets. In addition, others have used fixed energy prescriptions, which may reduce the likelihood of effects on intake via satiety mechanisms. Two well-controlled longer-term studies investigating the effects of ad libitum low and high GI diets matched for fibre and macronutrient content did not find a significant effect on body weight [8, 12].
This study aimed to explore the effects of lower and higher GI foods, independently of changes to other dietary factors, on both appetite and energy intake in the short-term, and the impact on body weight and composition over 12 weeks.
Methods
Subjects
Female subjects with a body mass index (BMI) >25 kg/m2 and fasting plasma insulin concentration >50 pmol/l at screening were recruited from the community to participate in a 24-week dietary intervention study at MRC Human Nutrition Research (HNR). Subjects were excluded if they were following a weight-reducing diet or had not been weight-stable over the preceding 2 months (weight change of no more than 2 kg). Subjects were also excluded if they suffered from chronic medical conditions (including diabetes, cardiovascular disease, hypertension (BP >160/100 mmHg), malignancy, clotting or bleeding disorders, renal, liver or respiratory disease), were anaemic, allergic or intolerant to any of the provided intervention foods, or were pregnant or breastfeeding; or if they were taking regular steroids or non-steroidal anti-inflammatory drugs, lipid-lowering drugs or anti-coagulants. The study was approved by the Cambridge Local Research Ethics Committee and subjects gave written informed consent.
Study design
The study was a crossover dietary intervention including two 12-week periods of incorporation of provided lower or higher GI foods into habitual diets in random order. Subjects were randomised to treatment order using a computer-generated randomisation chart, in order of recruitment. Intervention periods were consecutive with no washout period in-between. Weight, body mass index (BMI; weight (kg) / height (m)2), waist circumference and body composition (whole-body dual energy x-ray absorptiometry (DXA) scan; Lunar DPX-IQ, Lunar Corp., Madison, WI, USA) were measured at baseline and at the end of each intervention period.
Dietary intervention
Subjects were provided with lower or higher GI versions of key ‘staple’ carbohydrate-rich foods, according to intervention period, to incorporate into their habitual diet. These comprised lower or higher GI breads, breakfast cereals and rice, plus pasta on the lower GI diet and potatoes during the higher GI period. GI values of intervention foods were measured at HNR [13] and differed significantly for all equivalent ‘low’ and ‘high’ GI foods (P<0.05), with a mean difference of 28.5 units (for GI values of intervention foods, see table 1 and [14]).
Table 1.
GI values of intervention foods
| Lower GI foods | Higher GI foods | ||
|---|---|---|---|
| Food | GI | Food | GI |
| Breakfast cereals | 55 * | Breakfast cereals | 77 * |
| Basmati rice | 43 | Easy-cook basmati rice | 68 |
| Penne pasta | 43 | White potatoes | 88 # |
| Bread | 55 * | Bread | 75 * |
Mean value for all types provided
Mean value for various cooking methods
Data from the UK National Diet and Nutrition Survey (NDNS) reveals that these foods provide around 60% of total dietary carbohydrate [15, 16]. An estimated achievable difference in dietary GI of 12 units was calculated from the GI values and the average daily intakes of the foods in NDNS. Subjects were instructed to maintain their habitual diets for the duration of the study, but to substitute the supplied foods into their diets on at least 3 occasions per day in the quantity which they would normally consume. No other advice was given regarding quantity and amounts provided were unlimited. Subjects were given simple advice regarding other foods to chose or avoid, both verbally and in writing, based around the staple carbohydrate choices and excluding reference to pulses, fruits and vegetables to avoid wider dietary changes. Subjects were not informed of the GI difference of study foods. Subjects kept 4-day diet diaries at baseline and during the final week of each intervention period. Data was coded into an in-house database based on McCance and Widdowson’s The Composition of Foods [17].
Appetite investigation
Appetite investigation days were performed during the final week of each intervention period to determine whether a fixed breakfast including lower vs. higher GI cereal (GI 60 vs. 74) and bread (GI 48 vs. 71) reduced energy intake of a mid-morning snack 2 hours after breakfast, and whether any differences in energy intake were modulated at lunch, 4 hours after breakfast. Subjects attended HNR following an overnight fast. Following cannulation and a fasting blood sample, they consumed breakfast including a low or high GI cereal and bread according to intervention period. Breakfasts differed in GI by 12 units, provided identical amounts of energy (2.5 MJ) and were closely matched for available carbohydrate, fibre, protein and fat contents. Further blood samples were taken at 15, 30, 45, 60, 90 and 120 minutes following breakfast for measurement of plasma glucose, insulin and non-esterified fatty acids (NEFA). Immediately following the final blood sample, subjects were presented with a pre-weighed ad libitum snack of crisps, mini savoury and mini sweet biscuits, with tea or coffee. This was removed after 30 minutes and remaining food weighed. A pre-weighed ad libitum lunch of pizza, undressed green salad, yoghurt and water was served in small discreet units at 4 hours following breakfast. The remaining food was weighed once subjects had consumed as much as desired. Subjects completed 10 cm visual analogue scale (VAS) questionnaires regarding their hunger and fullness at half-hour intervals throughout the investigation, and palatability VAS questionnaires following meals.
Statistical analysis
Statistical analyses were carried out using Microsoft Excel 2000 (Microsoft Corporation, USA) and Stata version 9.1 (StataCorp LP, Texas, USA). Normality of distribution of variables was checked using quantile plots, and data were log-transformed to achieve normality where necessary. Endpoint outcome measures were compared within-person using a fixed-effects linear regression model including subjects as variables, into which period was included to check for period effects. Graphs of endpoints were examined by randomisation group to give an indication of any differing effects by treatment order.
Results
26 subjects were recruited, of which 7 dropped out of the study (1 before starting the diet, and 6 during the first diet treatment; 4 were on the low GI diet and 2 on the high GI diet). Of these, 3 cited time commitments, 2 were prescribed medications on the exclusion list, 1 had a bad reaction to initial blood samples and 1 cited an unspecified health condition. These subjects had a mean BMI of 32.5 (SD 6.3) kg/m2, and did not differ from completing subjects in any baseline measures. The 19 subjects to complete the study were aged between 34 and 65 years at baseline (mean 51.9 (SD 7.6) years). All were overweight or obese, with BMI ranging from 25.6 to 46.7 kg/m2 (mean 33.1 (SD 4.9) kg/m2), and body fat from 38.8 to 52.6% (mean 47.8 (SD 3.5) %).
Reported dietary intakes
Dietary data was collected from 4-day diet diaries at baseline (before intervention) and during the final week of each intervention period. Dietary data is presented in table 2 (intervention data for 18 subjects only as one diary was lost in the post). Subjects reported similar intakes to the nationally-representative NDNS sample of the UK female population for all macronutrients expressed as a percentage of energy intake, with reported intakes of energy and non-starch polysaccharide (NSP) similar, although slightly higher, than in NDNS [15, 16]. Foods for which GI values had been specifically measured contributed 25% total carbohydrate intake. 55% total carbohydrate intake was from foods for which there were published values for identical or closely equivalent foods. A further 10% was provided by foods for which a nominal low/medium/high GI value had been ascribed (45/63/85), and the final 10% was provided by foods for which there was no data available (GI value of 70 assigned).
Table 2.
Baseline (n=19) and intervention (n=18) diets
| Baseline Diet | High GI Diet | Low GI Diet | Difference between High & Low GI Diets | |||||||||
|---|---|---|---|---|---|---|---|---|---|---|---|---|
| Mean | SD | Mean | SD | Mean | SD | Mean | SE | 95% CI | P | |||
| Glycaemic index | 62.2 | 3.8 | 63.9 | 3.0 | 55.5 | 3.8 | -8.4 | 1.0 | -10.4 | -6.3 | <0.001 | |
| Glycaemic load | 138.9 | 35.0 | 138.8 | 30.5 | 133.8 | 22.9 | -5.0 | 5.0 | -14.5 | 4.6 | 0.3 | |
| Energy | kJ | 7784 | 1810 | 7844 | 1629 | 8071 | 1523 | +227 | 175 | -143 | 597 | 0.2 |
| Energy density | kJ/g | 2.8 | 0.8 | 2.9 | 0.7 | 3.0 | 0.7 | +0.1 | 0.1 | -0.1 | 0.3 | 0.4 |
| Available carbohydrate |
%E | 48.8 | 5.5 | 47.6 | 6.1 | 51.4 | 6.0 | +3.8 | 1.3 | 1.1 | 6.5 | 0.01 |
| Starch | %E | 27.1 | 6.1 | 26.8 | 4.9 | 29.4 | 6.1 | +2.7 | 1.4 | -0.3 | 5.6 | 0.07 |
| Sugars | %E | 21.5 | 5.4 | 20.9 | 5.7 | 21.5 | 5.1 | +0.6 | 0.8 | -1.2 | 2.4 | 0.5 |
| Non-starch polysaccharide |
g | 15.4 | 4.4 | 15.6 | 4.5 | 18.4 | 5.0 | +2.7 | 1.2 | 0.2 | 5.3 | 0.04 |
| Protein | %E | 16.7 | 2.9 | 17.6 | 3.3 | 17.0 | 2.4 | -0.6 | 0.6 | -1.8 | 0.6 | 0.3 |
| Fat | %E | 34.4 | 6.1 | 34.1 | 5.7 | 32.2 | 5.1 | -1.9 | 1.4 | -4.8 | 0.9 | 0.2 |
%E = expressed as % total energy intake
All subjects reduced dietary GI on the lower compared with the higher GI diet, with a mean difference of 8.4 units (P<0.001; range 2.8-18.4). Glycaemic load was not significantly reduced on the lower GI diet due to a small but statistically significant increase in carbohydrate intake (51 vs. 48% of total energy, P=0.01). There was also a small but significant increase in intake of NSP on the lower compared with the higher GI diet (18.4 vs. 15.6 g, P=0.04). There were no other differences between diets. GI was lower at all main meals during the lower compared with the higher GI period, but there were no differences in the GI of foods eaten between meals. The weighted average GI difference from the main meals only was calculated to be 10.0 units (65.8 vs. 55.8, P<0.001).
Body weight and composition
There were no differences in body weight, waist circumference or fatness between intervention periods (table 3). Weight increased during both intervention periods, although weight gain did not differ between treatments (1.1 (SD 1.5) kg on the low GI diet vs. 1.4 (SD 1.7) kg on the higher GI diet; P=0.7).
Table 3.
Effect of dietary intervention on body weight and composition (n=19)
| Baseline | High GI Diet | Low GI Diet | Difference | |||||||||
|---|---|---|---|---|---|---|---|---|---|---|---|---|
| Mean | SD | Mean | SD | Mean | SD | Mean | SE | 95% CI | P | |||
| Weight | kg | 87.5 | 15.0 | 89.2 | 16.1 | 89.1 | 15.6 | -0.1 | 0.5 | -1.1 | 0.9 | 0.8 |
| Waist # | cm | 103 | 0.12 | 106 | 0.13 | 105 | 0.12 | +0.99 | 1.01 | 0.96 | 1.02 | 0.4 |
| Fat mass | kg | 42.3 | 8.4 | 42.9 | 8.9 | 44.54 | 9.2 | +0.22 | 0.34 | -0.50 | 0.94 | 0.9 |
| Lean mass | kg | 43.8 | 5.2 | 44.6 | 5.7 | 43.13 | 5.6 | -0.02 | 0.03 | -0.61 | 0.57 | 0.5 |
| Body fat | % | 47.8 | 3.5 | 47.6 | 3.6 | 47.72 | 3.8 | +0.07 | 0.32 | 0.60 | 0.74 | 0.8 |
Loge transformed for statistical analysis; geometric mean and SD of logged data, ratio of geometric means and confidence interval around ratio of geometric means presented.
Short-term appetite investigation
Energy intakes of the ad libitum snack and lunch meals are presented in figure 1. There were no differences at either meal, or in the total energy intake over the day. Neither were there any differences in subjective ratings of appetite at any time point between investigation days.
Figure 1.

Energy intakes of ad libitum snack and lunch following a higher/lower GI meal
There were no differences in glucose, insulin and NEFA responses to the lower vs. higher GI breakfasts, with no differences either in total area under the curve or single measurements at any time point (figure 2).
Figure 2.

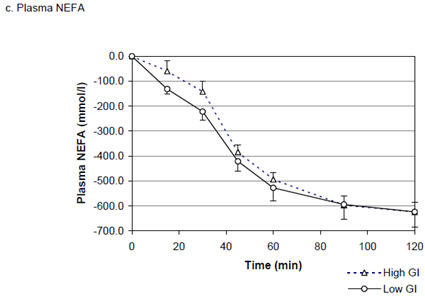
Plasma glucose, insulin and NEFA responses to higher and lower GI mixed breakfast meals (mean ± SEM)
Discussion
This study found no effect of a reduction in the GI of the diet on short- or longer-term energy intake, or on body weight or composition in a group of 19 overweight but weight-stable, hyperinsulinaemic female subjects. This intervention was longer than many previous studies, the diets were well matched for energy, macronutrient and fibre intakes, and the crossover design minimised any effects of differences in background diet. Although subjects in this study were selected on a criterion of being overweight/obese, this was not a weight-loss study. Subjects were not attempting to lose weight and were not given advice about quantities to consume, being instructed to maintain habitual intakes. Simple ad libitum (in terms of quantity) substitution of reduced GI versions of key ‘staple’ carbohydrate foods did not reduce energy intake in this study, indeed there was a modest weight gain during both periods, possibly as a function of receiving ‘free’ food.
The difference in GI of 8.4 units was lower than the planned difference of 12 units, due to a lower than expected intake of the key ‘staple’ foods. These provided less than 50% of total available carbohydrate intake compared with around 60% estimated from a national survey [15, 16]. Although this difference was smaller than achieved in some previous studies, the intervention diets were representative of habitual diets, and so perhaps more achievable and sustainable long-term than more extreme dietary manipulations. The aim of the intervention was to be non-prescriptive, with no advice given regarding portion sizes and foods consumed ad libitum. Commercially-available lower and higher GI versions of key staple foods were provided to aid compliance, and advice on foods such as pulses, whole-grains and fruit and vegetables was avoided to prevent broader changes to diet. The intention was that intakes of macronutrients and fibre would remain constant between intervention periods. There were statistically significant increases in both carbohydrate and fibre intakes on the low compared with the high GI diet, although absolute differences were small. An increase in fibre intake is commonly seen on low GI diets, with differences of up to 15 g/d in some previous studies [18, 19].
Few previous longer-term intervention studies have been designed to compare ad libitum macronutrient-matched low and high GI diets without accompanying weight-loss advice. Of those which have, no significant differences have been seen in weight or energy intake, although a trend towards a reduction on low GI diets have been observed [8, 12]. Several studies have compared low GI diets with standard low-fat hypoenergetic diets, and have seen greater weight loss on the low GI diet, however these are confounded by other broader differences between intervention diets [20, 21]. Other interventions investigating low versus high GI dietary advice for weight loss have seen no added beneficial effect on weight loss [22, 23]. Many, but by no means all, short-term studies have observed reduced hunger and/or energy intake following low compared with high GI meals [2, 24], although it is unclear whether short-term effects of low GI meals on energy intake are maintained at later meals.
This study found no effect on satiety or energy intake in the short-term, with a GI difference at breakfast of 12 units. Some previous studies that did observe an effect have used test meals with larger GI differences, but these have often also had differences in macronutrient and fibre contents. It was notable that the fixed breakfasts incorporating lower and higher GI foods did not result in differing postprandial glucose responses. This was particularly surprising as the breakfast cereals and breads had differing GI values from each other when tested separately (cereals 59 vs. 74, breads 48 vs. 71). Whilst a number of studies show that the glycaemic response to a mixed meal can be predicted reasonably accurately from the GI values of the constituent foods [25-27], this finding is not universal and a recent study found no association between predicted and measured GI, with GI being best predicted by fat and protein contents of the meals [28]. The GI of cereals had been measured with milk and breads with butter, so the only additions as part of this breakfast were jam/marmalade and tea/coffee. It is possible that the greater overall quantity of food being consumed here, relative to the GI testing methodology, resulted in a larger amount of glucose entering the circulation which masked differences in the glucose response attributable to GI. A previous study has found no significant differences in the glycaemic and insulinaemic reponses to low or high GI foods consumed in isolation ad libitum, despite no differences in energy or macronutrient intake [9]. Neither were there any differences in hunger or fullness. The weights of the foods consumed ad libitum in this previous study were around one-third higher than the loads provided for the prior determination of the GI values.
An additional alternative explanation for the lack of a difference in the glucose responses to the high and low GI breakfasts in the present study could be the use of venous plasma for the measurement of glucose. Capillary whole blood was previously used in the GI testing and is recommended by FAO/WHO as it results in lower within-subject variation than venous blood [29, 30]. It should also be noted that as the appetite tests were performed at the end of each intervention period, the possibility that there were chronic effects of adaptation in the acute responses to lower or higher GI meals cannot be ruled out.
In conclusion, this controlled laboratory investigation and free-living dietary intervention study has found no evidence to support a beneficial effect of a reduction in GI of the diet on satiety, energy intake, body weight or fatness through simple substitution of staple carbohydrate foods. It does not preclude an impact on weight from a greater reduction in dietary GI, but this is likely to involve wider dietary changes. Claims that the GI of the diet per se may have specific effects on body weight may therefore be misleading.
Acknowledgements
This study was funded by the Medical Research Council. With thanks to Adrian Mander for statistical guidance; Darren Cole for work on the GI database; Sue Bryant and staff of the Volunteer Suite at HNR for assistance with volunteer work; and staff the Nutritional Biochemistry Laboratory at HNR and Fiona Tulloch at Addenbrooke’s Hospital Department of Biochemistry for sample analysis.
References
- 1.WHO/FAO . Diet, nutrition and the prevention of chronic diseases. 2003. pp. i–viii.pp. 1–149. (World Health Organisation Technical Report Series). backcover. [PubMed] [Google Scholar]
- 2.Roberts SB. High-glycemic index foods, hunger, and obesity: is there a connection? Nutr Rev. 2000;58(6):163–9. doi: 10.1111/j.1753-4887.2000.tb01855.x. [DOI] [PubMed] [Google Scholar]
- 3.Agus MS, et al. Dietary composition and physiologic adaptations to energy restriction. Am J Clin Nutr. 2000;71(4):901–7. doi: 10.1093/ajcn/71.4.901. [DOI] [PMC free article] [PubMed] [Google Scholar]
- 4.Ludwig DS. Dietary glycemic index and obesity. J Nutr. 2000;130(2S Suppl):280S–283S. doi: 10.1093/jn/130.2.280S. [DOI] [PubMed] [Google Scholar]
- 5.Brand-Miller JC, et al. Glycemic index and obesity. Am J Clin Nutr. 2002;76(1):281S–5S. doi: 10.1093/ajcn/76/1.281S. [DOI] [PubMed] [Google Scholar]
- 6.Pawlak DB, Ebbeling CB, Ludwig DS. Should obese patients be counselled to follow a low-glycaemic index diet? Yes. Obes Rev. 2002;3(4):235–43. doi: 10.1046/j.1467-789x.2002.00079.x. [DOI] [PubMed] [Google Scholar]
- 7.Kabir M, et al. A high glycemic index starch diet affects lipid storage-related enzymes in normal and to a lesser extent in diabetic rats. J Nutr. 1998;128(11):1878–83. doi: 10.1093/jn/128.11.1878. [DOI] [PubMed] [Google Scholar]
- 8.Bouché C, et al. Five-week, low-glycemic index diet decreases total fat mass and improves plasma lipid profile in moderately overweight nondiabetic men. Diabetes Care. 2002;25(5):822–8. doi: 10.2337/diacare.25.5.822. [DOI] [PubMed] [Google Scholar]
- 9.Alfenas RC, Mattes RD. Influence of glycemic index/load on glycemic response, appetite, and food intake in healthy humans. Diabetes Care. 2005;28(9):2123–9. doi: 10.2337/diacare.28.9.2123. [DOI] [PubMed] [Google Scholar]
- 10.Díaz EO, Galgani JE, Aguirre CA. Glycaemic index effects on fuel partitioning in humans. Obes Rev. 2006;7(2):219–26. doi: 10.1111/j.1467-789X.2006.00225.x. [DOI] [PubMed] [Google Scholar]
- 11.Díaz EO, et al. Effect of glycemic index on whole-body substrate oxidation in obese women. Int J Obes (Lond) 2005;29(1):108–14. doi: 10.1038/sj.ijo.0802592. [DOI] [PubMed] [Google Scholar]
- 12.Sloth B, et al. No difference in body weight decrease between a low-glycemic-index and a high-glycemic-index diet but reduced LDL cholesterol after 10-wk ad libitum intake of the low-glycemic-index diet. Am J Clin Nutr. 2004;80(2):337–47. doi: 10.1093/ajcn/80.2.337. [DOI] [PubMed] [Google Scholar]
- 13.Aston LM, et al. Determination of the glycaemic index of various staple carbohydrate-rich foods in the UK diet. Eur J Clin Nutr. 2007 doi: 10.1038/sj.ejcn.1602723. [DOI] [PMC free article] [PubMed] [Google Scholar]
- 14.Aston LM. Glycaemic index and metabolic disease risk. Proc Nutr Soc. 2006;65(1):125–34. doi: 10.1079/pns2005485. [DOI] [PubMed] [Google Scholar]
- 15.Henderson LK, et al. The National Diet and Nutrition Survey: adults aged 19 to 64 years. Energy, protein, carbohydrate, fat and alcohol intake. Volume 2. The Stationery Office; London: 2003. [Google Scholar]
- 16.Henderson LK, Gregory J, Swan G. The National Diet and Nutrition Survey: adults aged 19 to 64 years. Types and quantities of foods consumed. Volume 1. The Stationery Office; London: 2002. [Google Scholar]
- 17.Food Standards Agency . McCance and Widdowson’s The Composition of Foods. 6th Summary ed Royal Society of Chemistry; Cambridge: 2002. [Google Scholar]
- 18.Rizkalla SW, et al. Improved plasma glucose control, whole-body glucose utilization, and lipid profile on a low-glycemic index diet in type 2 diabetic men: a randomized controlled trial. Diabetes Care. 2004;27(8):1866–72. doi: 10.2337/diacare.27.8.1866. [DOI] [PubMed] [Google Scholar]
- 19.Wolever TM, Mehling C. High-carbohydrate-low-glycaemic index dietary advice improves glucose disposition index in subjects with impaired glucose tolerance. Br J Nutr. 2002;87(5):477–87. doi: 10.1079/BJNBJN2002568. [DOI] [PubMed] [Google Scholar]
- 20.Spieth LE, et al. A low-glycemic index diet in the treatment of pediatric obesity. Arch Pediatr Adolesc Med. 2000;154(9):947–51. doi: 10.1001/archpedi.154.9.947. [DOI] [PubMed] [Google Scholar]
- 21.Dumesnil JG, et al. Effect of a low-glycaemic index--low-fat--high protein diet on the atherogenic metabolic risk profile of abdominally obese men. Br J Nutr. 2001;86(5):557–68. doi: 10.1079/bjn2001427. [DOI] [PubMed] [Google Scholar]
- 22.Raatz SK, et al. Reduced glycemic index and glycemic load diets do not increase the effects of energy restriction on weight loss and insulin sensitivity in obese men and women. J Nutr. 2005;135(10):2387–91. doi: 10.1093/jn/135.10.2387. [DOI] [PubMed] [Google Scholar]
- 23.Carels RA, et al. Education on the glycemic index of foods fails to improve treatment outcomes in a behavioral weight loss program. Eat Behav. 2005;6(2):145–50. doi: 10.1016/j.eatbeh.2004.08.005. [DOI] [PubMed] [Google Scholar]
- 24.Raben A. Should obese patients be counselled to follow a low-glycaemic index diet? No. Obes Rev. 2002;3(4):245–56. doi: 10.1046/j.1467-789x.2002.00080.x. [DOI] [PubMed] [Google Scholar]
- 25.Wolever TM, Jenkins DJ. The use of the glycemic index in predicting the blood glucose response to mixed meals. Am J Clin Nutr. 1986;43(1):167–72. doi: 10.1093/ajcn/43.1.167. [DOI] [PubMed] [Google Scholar]
- 26.Wolever TM, Bolognesi C. Prediction of glucose and insulin responses of normal subjects after consuming mixed meals varying in energy, protein, fat, carbohydrate and glycemic index. J Nutr. 1996;126(11):2807–12. doi: 10.1093/jn/126.11.2807. [DOI] [PubMed] [Google Scholar]
- 27.Chew I, et al. Application of glycemic index to mixed meals. Am J Clin Nutr. 1988;47(1):53–6. doi: 10.1093/ajcn/47.1.53. [DOI] [PubMed] [Google Scholar]
- 28.Flint A, et al. The use of glycaemic index tables to predict glycaemic index of composite breakfast meals. Br J Nutr. 2004;91(6):979–89. doi: 10.1079/bjn20041124. [DOI] [PubMed] [Google Scholar]
- 29.Wolever TM, et al. Determination of the glycaemic index of foods: interlaboratory study. Eur J Clin Nutr. 2003;57(3):475–82. doi: 10.1038/sj.ejcn.1601551. [DOI] [PubMed] [Google Scholar]
- 30.FAO/WHO Carbohydrates in human nutrition. Report of a Joint FAO/WHO Expert Consultation. FAO Food Nutr Pap. 1998;66:1–140. [PubMed] [Google Scholar]