Abstract
Objective
To determine the glycaemic index (GI) of various staple carbohydrate-rich foods in the UK diet, and to consider the factors influencing the GI of foods.
Design
Subjects were served with 25 or 50 g portions of glucose on three occasions, followed by a selection of test foods providing an equal amount of available carbohydrate, in random order. Each test food was consumed by 10 subjects. Capillary blood glucose levels were measured in the fasted state and over the 120 minutes following commencement consumption of the foods.
Setting
The study was carried out in a research institute (MRC Human Nutrition Research, Cambridge, UK).
Subjects
42 healthy adult volunteers were studied.
Methods
The GI values of 33 foods were measured according to the WHO/FAO recommended methodology. These foods included various breads, breakfast cereals, pasta, rice and potatoes, all of which were commercially available in the UK.
Conclusions
The results illustrate a number of factors which are important in influencing the GI of a food, highlighting the importance of measuring the GI of a food, rather than assuming a previously published value for a similar food. This is useful both to researchers analysing dietary surveys or planning intervention studies, and also to health professionals advising individuals on their diets.
Keywords: Glycaemic index, Carbohydrate, UK diet
Introduction
There is currently much scientific and popular interest in the role of low glycaemic index (GI) foods in the management of weight and metabolic disease risk. However, both observational and intervention studies are hampered by a lack of knowledge of GI values for many foods. The wide-ranging and often subtle factors which can influence the GI of a food make it impossible to predict the GI of a particular food with any certainty from a published value for a food of similar description. There is also frequently a wide variation in published GI values for foods with the same description (Foster-Powell et al., 2002). Most of the published GI data is based upon analysis carried out in countries other than the UK, and at present, many of the brands and foods in the published tables are unobtainable in the UK. The aim of this study was to measure the GI of a number of key ‘staple’ carbohydrate-rich foods (breads, breakfast cereals, rice, pasta and potatoes) in the UK diet. This is important both for researchers seeking to quantify GI from UK dietary surveys or planning intervention studies, and for advising consumers. The study also enabled detailed investigation of various factors influencing the GI of a food.
Methods
42 healthy subjects were recruited. Subjects were excluded if they reported a history of gastrointestinal disorders, suffered from diabetes, were taking medication for any chronic disease conditions, or were pregnant, breastfeeding, or intolerant or allergic to any of the foods.
The method used for measuring and calculating the GI of the foods was in accordance with WHO/FAO recommendations (FAO/WHO, 1998). Subjects attended each testing session after a 10 hour overnight fast, having been instructed not to consume unusually large meals, drink alcohol or exercise vigorously on the previous day, and to avoid cycling or walking to the laboratory. On the first three visits, subjects were given the standard reference food of glucose (dextrose monohydrate; Unichem Limited, Chessington, UK). Thereafter, they tested foods which were randomly assigned to them, being requested to consume the foods within 15 minutes. Each food was consumed by 10 different subjects. Blood glucose level was measured in capillary whole blood obtained by finger prick (Accu-Chek Advantage System, Roche Diagnostics Limited, Lewes, UK) in the fasted state and at 15, 30 45, 60, 90 and 120 minutes after commencement of consumption of the food.
33 different foods were tested, comprising various breads, breakfast cereals, rice, pastas and potatoes. Portion sizes were calculated to provide 50 g available carbohydrate, according to manufacturers’ nutrition information (FAO/WHO, 1998; Wolever et al., 2003). The 50 g glucose reference was made up with 250 ml water, and subjects were given 250 ml glass of water to drink with test foods. For some of the breads, portion sizes providing 50 g available carbohydrate were found to be too large for subjects to consume comfortably within 15 minutes. Therefore, portions tested provided 25 g available carbohydrate, and the reference used for comparison was 25 g glucose, made up with 125 ml water. Portions of two breads providing 50 g available carbohydrate were also tested in order to enable comparison of the resulting GI values, and to determine whether the different portion sizes gave the same result.
Foods were tested as they would typically be consumed, with the addition of milk or margarine to improve palatability. Breakfast cereals were served with 150 ml semi-skimmed milk, which provided 7.5 g available carbohydrate. Portions of the breakfast cereals were therefore calculated to provide 42.5 g available carbohydrate. Breads, potatoes, rice and pasta were tested with the addition of 10 g margarine per 50 g available carbohydrate. All foods requiring cooking were prepared according to manufacturers’ instructions.
Data analysis and statistical methods
Data was analysed according to the method recommended by FAO/WHO (FAO/WHO, 1998). The incremental area under the blood glucose response curves (IAUCG) to test and reference foods were calculated geometrically using the trapezoid rule, ignoring the area below the fasting baseline. For each test food, the IAUCG was expressed as a percentage of the mean IAUCG for the three repeats of the iso-carbohydrate reference food consumed by the same subject. The GI of each food was then calculated as the mean value across all subjects consuming that food. IAUCG and GI were calculated using SPSS version 11.0 (SPSS Inc., Chicago, Illinois, USA). Statistical differences between GI values of different foods were investigated by comparing means with non-parametric Mann-Whitney U tests, in SPSS. Glucose response curves were constructed in SigmaPlot version 8.0 (SPSS Inc., Chicago, Illinois, USA).
Results
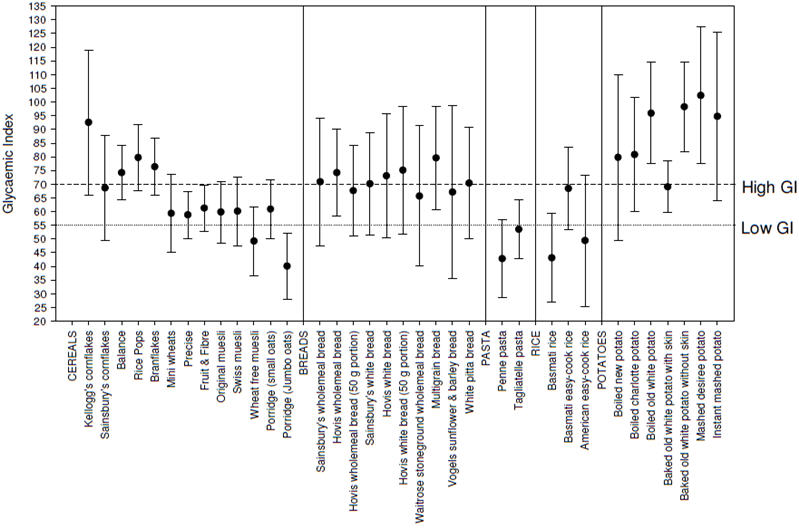
The measured GI values of the foods are shown in table 1 and figure 1. Breakfast cereals ranged from low (≤55) to high GI (≥70), with the majority having a moderate GI of around 60-65. Differences between the breads were much smaller, with the majority having high GI values. Both pastas tested were found to be low GI, whilst different types of rice were more variable. All potatoes tested had relatively high GI values.
Table 1.
Measured GI values of 33 foods
| Food | GI | SEM | 95% CI |
|---|---|---|---|
| Breakfast cereals with 150 ml semi-skimmed milk | |||
| Balance | 74.2 | 5.1 | 64.2 - 84.2 |
| Cornflakes | 65.3 | 5.4 | 25.7 - 121.5 |
| Kellogg’s cornflakes | 92.6 | 13.5 | 66.1 - 158.7 |
| Mini wheats | 59.4 | 7.3 | 45.1 - 73.7 |
| Rice pops | 79.7 | 6.2 | 67.5 - 91.9 |
| Branflakes | 76.3 | 5.4 | 65.7 - 86.9 |
| Precise | 58.8 | 4.4 | 50.2 - 67.4 |
| Fruit & fibre | 61.2 | 4.3 | 52.8 - 69.6 |
| Original muesli | 59.8 | 5.7 | 48.6 - 71.0 |
| Swiss muesli | 60.1 | 6.4 | 47.6 - 72.6 |
| Pertwee wheat free muesli | 49.2 | 6.5 | 36.5 - 61.9 |
| Porridge (small oats) | 60.9 | 5.5 | 50.1 - 71.7 |
| Porridge (jumbo oats) | 40.1 | 6.1 | 28.1 - 52.1 |
|
| |||
| Breads with 5 g margarine (25 g available carbohydrate) | |||
| Wholemeal | 70.9 | 11.9 | 47.6 - 94.2 |
| Hovis wholemeal | 74.2 | 8.1 | 58.3 - 132.5 |
| White | 70.1 | 9.5 | 51.5 - 88.7 |
| Hovis white | 73.1 | 11.6 | 50.4 - 123.4 |
| Waitrose stoneground wholemeal | 65.7 | 13.1 | 40.0 - 91.4 |
| Multigrain | 79.6 | 9.6 | 60.8 - 98.4 |
| Vogels sunflower & barley | 70.4 | 10.4 | 50.0 - 90.8 |
| White pitta | 67.1 | 16.1 | 35.5 - 98.7 |
|
| |||
| Breads with 10 g margarine (50 g available carbohydrate) | |||
| Hovis wholemeal | 67.6 | 8.5 | 51.1 - 118.7 |
| Hovis white | 75.1 | 11.9 | 51.8 - 126.9 |
|
| |||
| Pasta, rice and potatoes with 10 g margarine | |||
| Penne | 42.8 | 7.2 | 33.4 - 52.2 |
| Egg tagliatelle | 53.5 | 5.4 | 42.9 - 64.1 |
|
| |||
| Basmati rice | 42.8 | 8.3 | 26.5 - 59.1 |
| Basmati easy-cook rice | 68.4 | 7.7 | 53.3 - 83.5 |
| American easy-cook rice | 49.4 | 12.2 | 25.5 - 73.3 |
|
| |||
| Baked old white potato with skin | 69.0 | 4.8 | 59.6 - 78.4 |
| Baked old white potato without skin | 98.2 | 8.3 | 81.9 - 114.5 |
| Boiled old white potato | 95.9 | 9.5 | 77.3 - 114.5 |
| Boiled new potato | 79.8 | 15.4 | 49.6 - 110.0 |
| Boiled charlotte potato | 80.8 | 10.7 | 59.8 - 101.8 |
| Instant mashed potato | 94.8 | 15.7 | 64.0 - 125.6 |
| Mashed Desirée potato | 102.4 | 12.8 | 77.3 - 127.5 |
All products Sainsbury’s supermarket own-brand, except where otherwise stated.
Figure 1. Measured GI of 33 foods, with 95% confidence interval.
Effects of various processing and cooking methods on GI
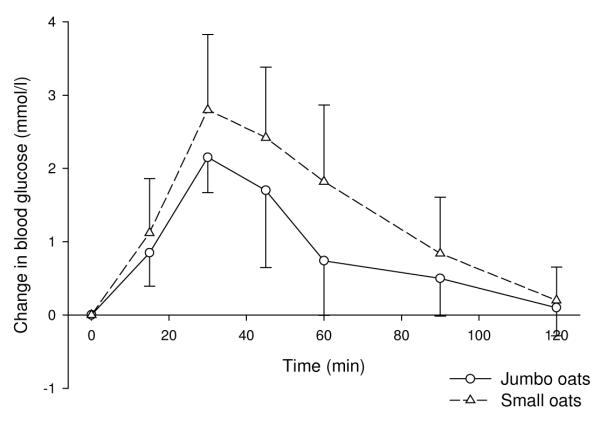
The GI of porridge made with the intact jumbo oats was significantly lower than that made with the smaller, more finely-processed oats (P=0.019; figure 2). However, although the GI of stoneground wholemeal bread was lower than that of conventionally (more finely) ground wholemeal bread, this difference was not significant.
Discussion
This study measured the GI values of 33 different carbohydrate-rich foods, including various breakfast cereals, breads, pastas, rice and potatoes. These food groups represent around 60% of the total carbohydrate intake in the typical UK adult’s diet (Henderson et al., 2002; Henderson et al., 2003). Substituting high for low GI versions of these foods will therefore make a significant contribution to the GI of the UK diet.
The variability in published GI values for foods of similar description could be explained by real differences between the foods, and/or by variations in the methodology used. Food factors which can influence the GI include the processing, preparation and cooking methods, the physical form of the food, the type of sugars and starch in the food, the presence of other macronutrients and anti-nutrients, and the ripeness or maturity of the food. The effects of several of these factors are illustrated by the findings of this study.
Use of varying methodology by different laboratories for the measurement and calculation of GI also contributes to the variation seen in published GI values. Although there is a recommended standard protocol for the determination of GI (FAO/WHO, 1998), there is scope within this for slight variations, and an inter-laboratory study has found that differences in GI of up to 18 units may in part be due to methodological factors rather than real differences between the foods (Wolever et al., 2003). Such variations shown to influence the GI include the use of venous rather than capillary blood, the use of differenct food composition tables to calculate the required portion size, and the method used for determining the AUC. The effect of using portion sizes providing differing amount of available carbohydrate on resulting GI values was investigated here. Insulin responses increase to a greater extent than glucose responses when portion sizes increase (Lee & Wolever, 1998). This could potentially affect the GI value obtained, although this is unlikely if the standard for comparison provides the same amount of available carbohydrate as the test food. However, the smaller insulin : glucose ratio resulting from a 25 g compared to a 50 g portion could in theory diminish the differences between foods, including that between the standard food and the test food. Two of the breads were tested using portions containing both 25 g and 50 g available carbohydrate, in order to compare the results obtained. There was not found to be a significant difference between GI values obtained with different portion sizes for either of these breads, indicating that it is acceptable to use a smaller portion size where necessary when measuring GI.
In this study, foods were tested as they would be expected to be consumed, with milk or margarine added. GI values are therefore for the food with milk/margarine. Milk has a low GI with published values ranging from 25 to 48 (Foster-Powell et al., 2002; Henry et al., 2005). This makes it lower GI than the majority of the breakfast cereals tested, so it would be expected to lower the resulting GI values of the meals. In addition, milk is known to have an insulinotropic effect, eliciting a much higher insulin response than would be expected from the glucose response (Björck et al., 2000; Östman et al., 2001). This could further lower the apparent GI of the breakfast cereals, as the enhanced insulin response to the milk would stimulate a more rapid removal of glucose from the circulation. As the same quantity of milk was added to each cereal, it could be expected to influence the glycaemic responses to all cereals in the same way. However, some previous findings suggest that this may not be the case, and that milk may have a greater effect in reducing the glucose response to high than low GI meals (Liljeberg Elmstahl & Björck, 2001; Östman et al., 2001). This may have reduced differences in GI values between cereals, and could in part explain the clustering of values seen.
The addition of margarine to the other foods may also be expected to lower their GI, as fat has been shown to flatten and reduce glycaemic responses by delaying gastric emptying and enhancing GIP secretion (Collier & O’Dea, 1983; Collier et al., 1984; Ercan et al., 1994). However, in these studies, much larger quantities of fat were added to meals (between half and equal amounts as carbohydrate by weight). Fat acts in a dose-dependent manner in lowering the IAUCG and the appearance of exogenous glucose in the blood (Normand et al., 2001). It is therefore likely that the quantities of fat added here would have only have had a small or negligible effect on the glycaemic responses to the foods.
The importance of measuring the GI of foods rather than assuming values from those published for similar foods is highlighted by the fact that the two brands of cornflakes tested here had very different GI values. Such differences between brands are most likely to be due to subtle differences in processing methods and/or formulations. Cornflakes contain resistant retrograded starch, which forms during production (Nugent, 2005). It could be that the different production methods employed by different manufacturers result in the production of different amounts of resistant starch, which could contribute to this difference in GI. However, in contrast to this, the white and wholemeal breads were found to have similar GI values between brands, and for the majority of foods tested, results were similar to those previously published for foods of the same description. Results for several of the breads tested were higher than expected from published values. Previous findings have shown that the GI of breads tends to decrease as the proportion of intact grains increases (Jenkins et al., 1988; Holm & Björck, 1992; Liljeberg et al., 1992). This may be a critical feature which is hard to objectively assess, and the published values could be for multigrain loaves with far higher proportions of intact grains than those used here.
Similarly, the more intact jumbo porridge oats gave a lower GI than the more finely processed oats. It may also have been expected that less finely ground flour would produce a bread with a lower GI. However, whilst the stoneground wholemeal bread (made from less finely ground flour than standard wholemeal bread flour) had a slightly lower GI than the standard wholemeal bread, this difference was not significant. This is supported by findings of previous studies which suggest that particle size probably exerts its greatest effect on glucose and insulin responses when large food or grain particles are present (Heaton et al., 1988; Behall et al., 1999).
The similarity between results for white and wholemeal breads demonstrates a lack of effect of wheat fibre on GI, which is consistent with findings that addition of wheat bran to breads and other high-carbohydrate foods has no effect on post-prandial glucose responses (Jenkins et al., 1983; Fontvieille et al., 1988; Jenkins et al., 2002b). In contrast to this, addition of β-glucan, a soluble fibre present in oats and barley, has consistently been shown to reduce the GI of breads and other products (Pick et al., 1996; Tappy et al., 1996; Battilana et al., 2001; Jenkins et al., 2002a). Wheat fibre is an insoluble fibre, which is not fermentable due to a high degree of lignification. It provides bulk to gastrointestinal tract contents, and slows transit time of matter through the tract, but does not seem to reduce the rate or extent of carbohydrate absorption from the gut. β-glucan is a viscous soluble fibre which slows gastric emptying and increases gastrointestinal transit time. Soluble fibres also slow the rate of starch digestion by pancreatic amylases in vitro, probably by delaying the interaction of the enzyme with the substrate. These factors cause delayed and reduced carbohydrate absorption from the gut (Battilana et al., 2001). In addition, the degree of viscosity of the fibre is positively related to the extent of flattening of the postprandial glucose response (Jenkins et al., 2002a).
The baked potato with skin was found to have a lower GI than that consumed without the skin. The skin is higher in fibre than the flesh, and is particularly high in soluble fibre.
This study found potatoes to have a high GI, regardless of variety, cooking method and maturity. Despite this, the difference in the GI of the new and old potatoes was still quite large (15-20 units), which will make an important contribution to dietary GI given the importance of potatoes in western diets. New potatoes have frequently been reported to have lower GI values than old potatoes (Foster-Powell et al., 2002), and findings have shown average tuber size to be significantly correlated with GI (Soh & Brand-Miller, 1999). As potatoes mature, the degree of amylopectin branching increases, rendering the starch in more mature potatoes more readily digestible than that in newer potatoes (Soh & Brand-Miller, 1999). In agreement with previously published values, both types of pasta were found to have low GI values. Published GI values for rice vary widely. This is largely due to variety, with the ratio of amylose : amylopectin being important. High amylose rices, such as basmati, have widely been found to have low GI values, as was the case in this study. Within variety, the easy-cook basmati had a significantly higher GI value than the standard basmati rice. This is therefore likely to be due to the processing method used in making the rice ‘easy-cook’.
In conclusion, this study has provided GI values for a number of common staple carbohydrate-rich foods in the UK diet. It has also highlighted some of the multiple factors affecting the GI of a food, which illustrates the importance of measuring the GI values of foods rather than applying values from foods of similar description. This information is useful to researchers interested in calculating the GI in dietary surveys to study diet-disease relationships, and in the planning of dietary intervention studies, in order to have a clear idea of the GI of the intervention diets and to ensure that the diets for comparison truly differ in GI. It also provides valuable data for practitioners who have responsibility for advising individuals on their diet.
Figure 2. Effects on blood glucose of porridge made with small or jumbo oats (mean ± SD).
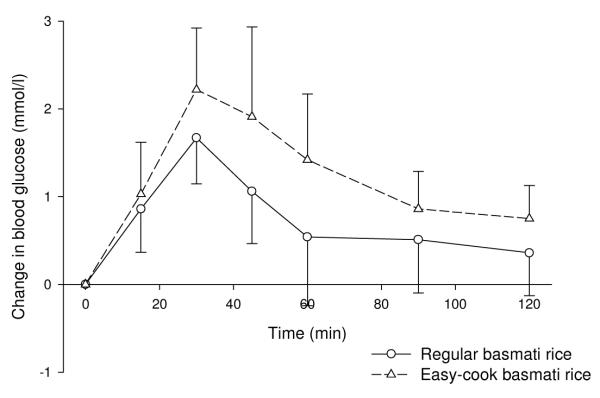
The GI of instant mashed potato was slightly lower than that for fresh mashed Desirée potato, although this difference was not significant and blood glucose curves were very similar. The GI of basmati rice was significantly lower than that of easy-cook basmati rice (P=0.035; figure 3).
Figure 3. Effects on blood glucose of regular and easy-cook basmati rice (mean ± SD).
The GI values of white potatoes cooked by a variety of methods and consumed without the skin all had high GI, which did not differ significantly from each other.
Effects of fibre on GI
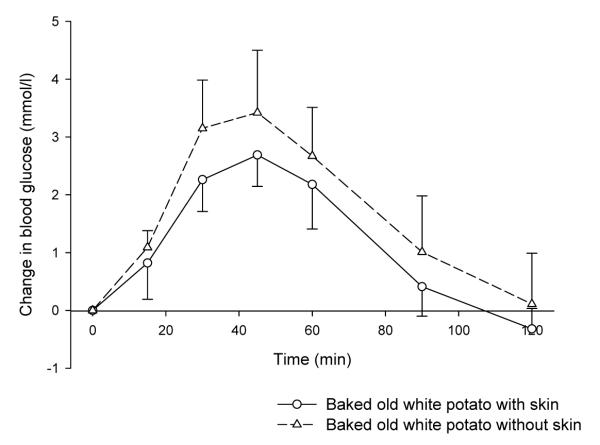
The GI values of wholemeal bread and white bread were virtually identical, with both breads causing similar peak rises in blood glucose. The fibre contents of the two white breads were 2.8 and 3.3 g per 100 g, and the wholemeal breads contained 6.0 g and 5.7 g per 100 g. The GI value of a baked potato eaten with skin was significantly lower than that for a baked potato eaten without skin (P=0.008; see figure 4).
Figure 4. Effects on blood glucose of baked potato consumed with and without skin (mean ± SD).
Effects of variety and brand on GI
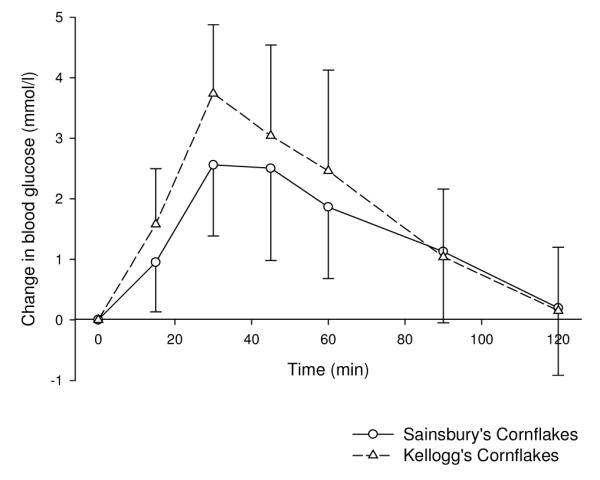
There were no significant differences between the GI values of the three different varieties of potato when cooked by boiling. Charlotte and new potatoes did have lower GI values than white potatoes, but this was not significant. The GI value of the Kellogg’s cornflakes was higher than that for the Sainsbury’s cornflakes, although this did not reach significance (P=0.09). The peak change in blood glucose was significantly greater for the Kellogg’s (3.7 mmol/l) than the Sainsbury’s cornflakes (2.6 mmol/l, P=0.04; figure 5). The GI values of both wholemeal breads and both white breads were very similar.
Figure 5. Effects on blood glucose of different brands of cornflakes (mean ± SD).
Effects of selected portion size on GI
There were no significant differences between GI values resulting from testing with different sized portions for any of the breads (table 2).
Table 2.
GI values of breads measured using 25 g and 50 g portions
| Bread | 25 g portion (mean ± SEM) |
50 g portion (mean ± SEM) |
|---|---|---|
| Wholemeal | 74 ± 8 | 68 ± 9 |
| White | 73 ± 12 | 75 ± 12 |
Breads both Hovis brand
Acknowledgments
Sponsorship: This study was funded by the Medical Research Council.
References
- Battilana P, Ornstein K, Minehira K, Schwarz JM, Acheson K, Schneiter P, Burri J, Jequier E, Tappy L. Mechanisms of action of beta-glucan in postprandial glucose metabolism in healthy men. Eur J Clin Nutr. 2001;55:327–333. doi: 10.1038/sj.ejcn.1601160. [DOI] [PubMed] [Google Scholar]
- Behall KM, Scholfield DJ, Hallfrisch J. The effect of particle size of whole-grain flour on plasma glucose, insulin, glucagon and thyroid-stimulating hormone in humans. J Am Coll Nutr. 1999;18:591–597. doi: 10.1080/07315724.1999.10718893. [DOI] [PubMed] [Google Scholar]
- Björck I, Liljeberg H, Östman E. Low glycaemic-index foods. Br J Nutr. 2000;83(Suppl 1):S149–155. doi: 10.1017/s0007114500001094. [DOI] [PubMed] [Google Scholar]
- Collier G, McLean A, O’Dea K. Effect of co-ingestion of fat on the metabolic responses to slowly and rapidly absorbed carbohydrates. Diabetologia. 1984;26:50–54. doi: 10.1007/BF00252263. [DOI] [PubMed] [Google Scholar]
- Collier G, O’Dea K. The effect of coingestion of fat on the glucose, insulin, and gastric inhibitory polypeptide responses to carbohydrate and protein. Am J Clin Nutr. 1983;37:941–944. doi: 10.1093/ajcn/37.6.941. [DOI] [PubMed] [Google Scholar]
- Ercan N, Gannon MC, Nuttall FQ. Effect of added fat on the plasma glucose and insulin response to ingested potato given in various combinations as two meals in normal individuals. Diabetes Care. 1994;17:1453–1459. doi: 10.2337/diacare.17.12.1453. [DOI] [PubMed] [Google Scholar]
- FAO/WHO Carbohydrates in human nutrition. Report of a Joint FAO/WHO Expert Consultation. FAO Food Nutr Pap. 1998;66:1–140. [PubMed] [Google Scholar]
- Fontvieille AM, Bornet F, Rizkalla SW, Le Francois P, Pichard P, Desplanque N, Chevalier A, Letanoux M, Verel A, Tchobroutsky G, et al. In vitro and in vivo digestibility and metabolic effects of 3 wheat-flour products (white bread, french toast (rusk) and french toast bran-enriched) in normal subjects. Diabete Metab. 1988;14:92–96. [PubMed] [Google Scholar]
- Foster-Powell K, Holt SH, Brand-Miller JC. International table of glycemic index and glycemic load values: 2002. Am J Clin Nutr. 2002;76:5–56. doi: 10.1093/ajcn/76.1.5. [DOI] [PubMed] [Google Scholar]
- Heaton KW, Marcus SN, Emmett PM, Bolton CH. Particle size of wheat, maize, and oat test meals: effects on plasma glucose and insulin responses and on the rate of starch digestion in vitro. Am J Clin Nutr. 1988;47:675–682. doi: 10.1093/ajcn/47.4.675. [DOI] [PubMed] [Google Scholar]
- Henderson LK, Gregory J, Irving K, Swan G. The National Diet and Nutrition Survey: adults aged 19 to 64 years. Energy, protein, carbohydrate, fat and alcohol intake. Volume 2. The Stationery Office; London: 2003. [Google Scholar]
- Henderson LK, Gregory J, Swan G. The National Diet and Nutrition Survey: adults aged 19 to 64 years. Types and quantities of foods consumed. Volume 1. The Stationery Office; London: 2002. [Google Scholar]
- Henry CJ, Lightowler HJ, Strik CM, Renton H, Hails S. Glycaemic index and glycaemic load values of commercially available products in the UK. Br J Nutr. 2005;94:922–930. doi: 10.1079/bjn20051594. [DOI] [PubMed] [Google Scholar]
- Holm J, Björck I. Bioavailability of starch in various wheat-based bread products: evaluation of metabolic responses in healthy subjects and rate and extent of in vitro starch digestion. Am J Clin Nutr. 1992;55:420–429. doi: 10.1093/ajcn/55.2.420. [DOI] [PubMed] [Google Scholar]
- Jenkins AL, Jenkins DJ, Zdravkovic U, Wursch P, Vuksan V. Depression of the glycemic index by high levels of beta-glucan fiber in two functional foods tested in type 2 diabetes. Eur J Clin Nutr. 2002a;56:622–628. doi: 10.1038/sj.ejcn.1601367. [DOI] [PubMed] [Google Scholar]
- Jenkins DJ, Kendall CW, Augustin LS, Martini MC, Axelsen M, Faulkner D, Vidgen E, Parker T, Lau H, Connelly PW, Teitel J, Singer W, Vandenbroucke AC, Leiter LA, Josse RG. Effect of wheat bran on glycemic control and risk factors for cardiovascular disease in type 2 diabetes. Diabetes Care. 2002b;25:1522–1528. doi: 10.2337/diacare.25.9.1522. [DOI] [PubMed] [Google Scholar]
- Jenkins DJ, Wesson V, Wolever TM, Jenkins AL, Kalmusky J, Guidici S, Csima A, Josse RG, Wong GS. Wholemeal versus wholegrain breads: proportion of whole or cracked grain and the glycaemic response. BMJ. 1988;297:958–960. doi: 10.1136/bmj.297.6654.958. [DOI] [PMC free article] [PubMed] [Google Scholar]
- Jenkins DJ, Wolever TM, Jenkins AL, Lee R, Wong GS, Josse R. Glycemic response to wheat products: reduced response to pasta but no effect of fiber. Diabetes Care. 1983;6:155–159. doi: 10.2337/diacare.6.2.155. [DOI] [PubMed] [Google Scholar]
- Lee BM, Wolever TM. Effect of glucose, sucrose and fructose on plasma glucose and insulin responses in normal humans: comparison with white bread. Eur J Clin Nutr. 1998;52:924–928. doi: 10.1038/sj.ejcn.1600666. [DOI] [PubMed] [Google Scholar]
- Liljeberg Elmstahl H, Björck I. Milk as a supplement to mixed meals may elevate postprandial insulinaemia. Eur J Clin Nutr. 2001;55:994–999. doi: 10.1038/sj.ejcn.1601259. [DOI] [PubMed] [Google Scholar]
- Liljeberg H, Granfeldt Y, Björck I. Metabolic responses to starch in bread containing intact kernels versus milled flour. Eur J Clin Nutr. 1992;46:561–575. [PubMed] [Google Scholar]
- Normand S, Khalfallah Y, Louche-Pelissier C, Pachiaudi C, Antoine JM, Blanc S, Desage M, Riou JP, Laville M. Influence of dietary fat on postprandial glucose metabolism (exogenous and endogenous) using intrinsically (13)C-enriched durum wheat. Br J Nutr. 2001;86:3–11. doi: 10.1079/bjn2001359. [DOI] [PubMed] [Google Scholar]
- Nugent AP. Health properties of resistant starch. Nutrition Bulletin. 2005;30:27–54. [Google Scholar]
- Östman EM, Elmstahl HG Liljeberg, Björck IM. Inconsistency between glycemic and insulinemic responses to regular and fermented milk products. Am J Clin Nutr. 2001;74:96–100. doi: 10.1093/ajcn/74.1.96. [DOI] [PubMed] [Google Scholar]
- Pick ME, Hawrysh ZJ, Gee MI, Toth E, Garg ML, Hardin RT. Oat bran concentrate bread products improve long-term control of diabetes: a pilot study. J Am Diet Assoc. 1996;96:1254–1261. doi: 10.1016/S0002-8223(96)00329-X. [DOI] [PubMed] [Google Scholar]
- Soh NL, Brand-Miller J. The glycaemic index of potatoes: the effect of variety, cooking method and maturity. Eur J Clin Nutr. 1999;53:249–254. doi: 10.1038/sj.ejcn.1600713. [DOI] [PubMed] [Google Scholar]
- Tappy L, Gugolz E, Wursch P. Effects of breakfast cereals containing various amounts of beta-glucan fibers on plasma glucose and insulin responses in NIDDM subjects. Diabetes Care. 1996;19:831–834. doi: 10.2337/diacare.19.8.831. [DOI] [PubMed] [Google Scholar]
- Wolever TM, Vorster HH, Björck I, Brand-Miller J, Brighenti F, Mann JI, Ramdath DD, Granfeldt Y, Holt S, Perry TL, Venter C, Xiaomei W. Determination of the glycaemic index of foods: interlaboratory study. Eur J Clin Nutr. 2003;57:475–482. doi: 10.1038/sj.ejcn.1601551. [DOI] [PubMed] [Google Scholar]


