Abstract
The human glucocorticoid receptor (GR) is phosphorylated on its N-terminus at three major sites (S203, S211 and S226) within activation function 1 (AF1). Although GR has been shown to assemble at glucocorticoid responsive elements (GREs) in the presence of hormone, the timing and specificity of GR phospho-isoform recruitment to receptor target genes has not been established. Using chromatin immunoprecipitation (ChIP) and GR phosphorylation-site specific antibodies, we examined GR phospho-isoform recruitment to several glucocorticoid-induced genes including tyrosine aminotransferase (tat) and sulfonyltransferase-1A1 (sult) in rat hepatoma cells, and the glucocorticoid-induced leucine zipper (gilz) gene in human U2OS cells. GR P-S211 and GR P-S226 isoforms were efficiently recruited to the tat, sult and gilz GREs in a hormone-dependent manner. In contrast, the GR P-S203 isoform displayed no significant recruitment to any GREs of the genes analyzed, consistent with its lack of nuclear accumulation. Interestingly, the kinetics of GR P-S211 and GR P-S226 recruitment differed among genes. Our findings indicate that GR phospho-isoforms selectively occupy GR target genes, and suggests gene specific requirements for GR phosphorylation in receptor-dependent transcriptional activation.
Keywords: glucocorticoid receptor, phosphorylation, gene expression, chromatin immunoprecipitation
1. Introduction
The glucocorticoid receptor (GR) is a ligand-activated transcription factor involved in metabolic and developmental responses to glucocorticoids [1, 2]. In the absence of ligand, GR resides in the cytoplasm associated with a Hsp90 molecular chaperone complex [3]. Upon ligand binding, the hormone-receptor complex translocates to the nucleus where it binds specific DNA sequences and modulates transcription [4, 5].
GR is phosphorylated in the absence of hormone, and receptor phosphorylation is enhanced upon glucocorticoid agonist (dexamethasone), but not antagonist (RU486) treatment, suggesting a link between GR hormone-dependent phosphorylation and transcriptional activity [6, 7]. Indeed, several of the GR phosphorylation sites (S203, S211 and S226 using the human GR number scheme) lie within the N-terminal AF1 region of the receptor involved in transcriptional regulation [8–10]. Support for the idea that GR phosphorylation affects receptor transcriptional regulatory functions stems from mutational analysis of the phosphorylated residues that have revealed modest effects on GR-dependent gene transcription in cell based reporter gene assays [11, 12]. Although the impact of site-specific GR phosphorylation on endogenous target genes is ongoing [13, 14], and our initial findings suggest gene specific effects of GR phosphorylation site mutations (Chen and Garabedian, unpublished observation), whether or not specific GR phospho-isoforms occupy receptor target genes have not been established.
We have generated antibodies that specifically recognize GR phosphorylated on S203, S211 or S226, and we have used these to investigate hormone-dependent GR phosphorylation [9, 14–16]. GR S203 and S226 are phosphorylated in both the absence and presence of agonists, such as dexamethasone, whereas phosphorylation of S211 is observed upon agonist treatment, but not understand basal conditions. Biochemical fractionation and indirect immunofluorescence from multiple cultured cell types revealed that upon dexamethasone treatment GR P-S211 and GR P-S226 isoforms resided in the nucleus, while the GR P-S203 form was confined to the perinuclear region of the cell, with only a small fraction of this phospho-isoform entering the nucleus [9]. Thus, the GR P-S211 and GR P-S226 likely contribute to transcriptional regulation by nuclear GR, whereas the GR P-S203 form may indirectly participate, if at all, in GR transcriptional regulatory functions.
Indeed mammalian cells lacking a Cdk inhibitor p27KIP1 display an increase GR phosphorylation at S211, a Cdk phosphorylation site [17], and enhanced receptor transcriptional activity [16]. In contrast, phosphorylation of S226 inhibits GR transcriptional activation and also been shown to promote GR export from the nucleus upon hormone withdrawal [18, 19]. These data support the hypothesis that differential phosphorylation of GR is associated with distinct activities of the receptor.
GR has been shown to assemble at GREs of target genes in the presence of hormone [20–23], but the pattern of GR phospho-isoform recruitment has not been determined. We examined GR phospho-isoform recruitment to several glucocorticoid-induced genes and observed differences in the kinetics of GR phospho-isoform recruitment among genes as well as between receptor phospho-isoforms at specific genes, suggesting that GR phosphorylation affects receptor transcriptional activation in a gene specific manner.
2. Materials and methods
2.1 Cell culture and treatment
Rat hepatoma cells [24, 25] were maintained in Dulbecco’s Modification of Eagle medium (DMEM; Cellgro) supplemented with 10% heat-inactivated Fetal Bovine Serum (FBS; HyClone Laboratories, Inc, Logan, UT), and 50 μg/ml penicillin and 50 μg/ml streptomycin (Cellgro). Human osteosarcoma cells (U2OS) stably expressing an integrated copy of human GR (U2OS-hGR) cells [9] were maintained in DMEM with 10% FBS, and 0.5 mg/ml Geneticin (G418, Invitrogen, Bethesda, MD).
For ChIP assays, cells were grown to 95% confluence in 15 cm plates containing 25 ml media and treated with 25 μL of 100 μM Dexamethasone (Dex) in ethanol, resulting in a final concentration of 100 nM Dex. Control plates were treated with an equal volume of the ethanol vehicle.
2.2 Immunoblotting
Extracts for immunoblotting were prepared from a subconfluent 10 cm plate of cells treated with 100 nM Dex or equal volume of the ethanol vehicle for the times indicated prior to lysis. Cells were placed on ice, washed twice in phosphate-buffer saline (PBS), lysed in 0.35 ml of buffer containing 50 mM HEPES pH 7.5, 150 mM NaCl, 1 mM EDTA, 1 mM EGTA, 1 mM NaF, 1% Triton X-100, 10% glycerol and protease and phosphatase inhibitors: 1 mM PMSF, 20 mM β-glycerophosphate, 8 mM sodium pyrophosphate, 1 μg/ml leupeptin, pepstatin A and aprotinin (Roche). Lysates were centrifuged at 14,000 rpm for 15 min at 4°C. The soluble supernatants were normalized for total protein concentration using the Bio-Rad protein assay (Bio-Rad Laboratories, Hercules, CA) and the samples were boiled for 3 min in 2XSDS sample buffer and stored at −20°C.
Cell extracts containing GR were separated by 9% SDS-polyacrylamide gel electrophoresis (PAGE) and were transferred to Immobilon paper (Millipore Corp., Bedford, MA). The membranes were blocked overnight in 5% bovine serum albumin (BSA) in Tris-buffered saline pH 7.4 (TBS) (blocking solution) at 4°C, then were incubated in the blocking buffer with primary antibody at room temperature (RT) for 2–4 hour using 1:1,000 dilution of serum for GR (#218), GR P-S226 (#459) and GR P-S211 (#353), and 1:10,000 dilution of serum for GR P-S203 (#221). The antibody for total GR (#218) was generated against the following peptide 194LQDLEFSSGS203PO4PGKE207. Multiple rabbits were injected with this peptide in the course of GR P-S203 antibody development and one rabbit (#218) generated antibodies against this peptide, but to an epitope that was independent of S203 phosphorylation [15]. The membranes were washed three times for 10 min in TBS/0.1% Triton X-100 and twice in TBS and incubated for 1 hour at RT with 0.2 μg/ml protein A conjugated to horseradish peroxidase (HRP) (Kirkegaard and Perry Laboratories). Blots were then washed three times for 10 min in TBS-0.1% Triton X-100, twice in TBS and developed using enhanced chemiluminescence (ECL) according to manufacturer’s instructions (GE Health Sciences). Quantitative analysis of immunoblots was performed using NIH image (http://rsb.info.nih.gov/nih-image/).
2.3 Reverse Transcriptase PCR
The C. therm One-Step RT-PCR system (Roche) was used for all RT-PCR reactions. Total RNA from rat hepatoma cells was isolated using the RNeasy kit (Qiagen), and eluted from RNA purification columns in 60 μl RNAse-free H2O. Total RNA concentration was determined and diluted to 0.25 ng/μl. RT-PCR reactions for tat, sult and gapdh were performed on 0.05 ng total RNA, RT-PCR products were separated on a 3% agarose gel, visualized by ethidium bromide staining and photographed under UV light. Scanned images were quantitated using NIH Image and normalized to gapdh mRNA levels.
2.4 Chromatin Immunoprecipitation
Cells were cultured in 15 cm dishes (25 ml of media) and treated with 100 nM Dex for the times indicated. A 2.5 ml aliquot of 10X ChIP fixation buffer (50 mM Hepes pH 8.0, 1 mM EDTA, 100 mM NaCl, 11% formaldehyde) was added and incubated for 15 min at 4°C. Formaldehyde was quenched by adding 2.5 ml of 1.4 M glycine per plate and incubated for 1 min at 4°C. Formaldehyde-containing media was removed and the cells rinsed once with ice cold PBS. PBS (2 ml) was added to each plate. Cells were scraped into the PBS, placed into a 15 ml conical tube, and pelleted at 300xg for 5 min at 4°C. Cell pellets were flash frozen on dry ice and stored at −80 °C. Pellets were resuspended in RIPA buffer (10 mM Tris pH 8.0, 1 mM EDTA, 140 mM NaCl, 5% glycerol, 0.1% sodium deoxycholate, 0.1% SDS, 1.0% Triton X-100, 1 mM PMSF) to a final volume of 2 ml. Cells were sonicated at 30 watts input power (approximately 55% amplitude) in one second bursts, followed by three seconds of cooling on ice, for a total of 4 min using a Branson 250 digital sonifier fitted with a 1/2″ step disruptor horn and an 1/8″ titanium tapered microtip. Lysates were transferred to microcentrifuge tubes, centrifuged at 15,000 rpm for 10 min at 4°C. Supernatants were transferred to a 15 ml conical tube and diluted to 3.5 ml with RIPA buffer. A portion (5 μl) was removed and kept as the input for the ChIP assay. Immunoprecipitation were performed by adding 10 μl of total rabbit sera containing antibodies that recognized either, total GR, GR P-203, GR P-211 or GR P-226 along with 30 μl of 50% protein A-sepharose CL4B beads (Sigma) equilibrated in RIPA buffer with 100 μg/ml boiled sheared salmon sperm DNA to the soluble chromatin. Immunoprecipitations were carried out overnight at 4°C. Beads were pelleted and washed 5-times with 1 ml of ice-cold RIPA buffer for 5 min at 4°C. SDS/proteinase K (10 mM Tris pH 8.0, 1 mM EDTA, 0.5% SDS, 200 μg/ml proteinase K) (110 μl) was added to the tubes and placed at 55°C for 4 h and then overnight at 65°C to reverse the crosslinks. The remaining chromatin was purified using the Qiagen PCR purification kit and eluted in 45 μl of dH2O.
PCR was performed for 35 cycles on 4 μl of DNA using standard Promega Taq DNA polymerase conditions. Products were separated on a 3% agarose gel, and visualized by ethidium bromide staining. The images were scanned and quantitated using NIH Image, and normalized to input. Sequences of each primer pair are: TAT F 5′-CCCATAAATAACAGGAAGCCCAAG -3′; TAT R 5′-ATACCACCACACCCA GAAACCGAC -3′; SULT F 5′-CGTGTGAATGCTCTGTCCCATC -3′; SULT R 5′-GCTGAAGATTTTGTGTCCCAAGTG -3′; GILZ F 5′-GATACCA GTTAAGCTCCTGA-3′; GILZ R 5′-AGGTGGGAGACAATAATGAT-3′; UPS F 5′-TCCCAAACAGATAGCTTTCT-3′ UPS F 5′-AGCAGCAGCCCTACTATT A-3′
3. Results
3.1 GR phospho-isoform expression in rat hepatoma cells
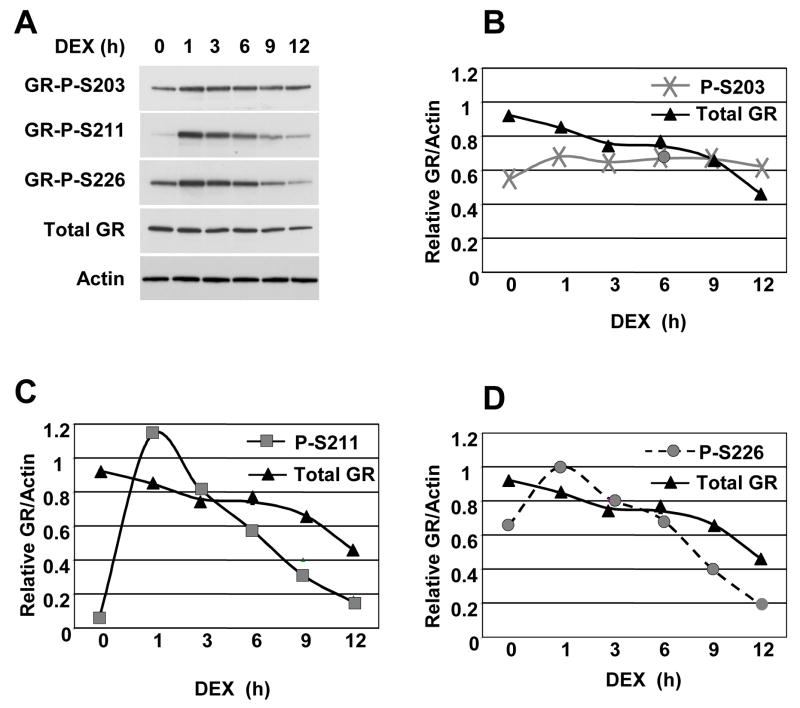
As a prerequisite for examining phospho-GR recruitment to endogenous target genes, we determined the kinetics of receptor phosphorylation over 12 hours in a rat hepatoma line expressing endogenous GR upon dexamethasone (Dex) treatment using antibodies that specifically recognize phosphorylation of GR at S203, S211 and S226 [9, 14]. GR phosphorylation at all three sites was observed (Fig. 1). The GR P-S203 and GR P-S226 antibodies recognized GR from both untreated and hormone-treated cells and both sites show somewhat greater immunoreactivity toward GR from cells stimulated with Dex. The GR P-S211 antibody showed substantial immunoreactivity toward GR from Dex-treated, rather than from untreated cells. This indicates that phosphorylation of GR S203, S211 and S226 are hormone-dependent, albeit to different degrees. These results are similar to the induction pattern of GR phosphorylation in the human osterosarcoma cell line U2OS ectopically expressing GR [9], and suggest that different GR phospho-isoforms may play distinct roles in GR function.
Figure 1. Kinetics of GR phosphorylation in rat hepatoma cells in response to Dex.
A) Rat hepatoma cells were treated with ethanol (−) or Dex (100 nM) for the times indicated. Whole cell lysates were prepared, normalized and analyzed by immunoblotting with GR P-S203, GR P-S203, GR P-S226, total GR and actin antibodies. B–D) Quantitative analysis of total GR and phospho-GR immunoblots in panel A normalized to actin. The data shown are from a single experiment that is representative of at least three independent experiments.
3.2 Dex induction of tyrosine aminotransferase and sulfonyl transferase 1A1 mRNA
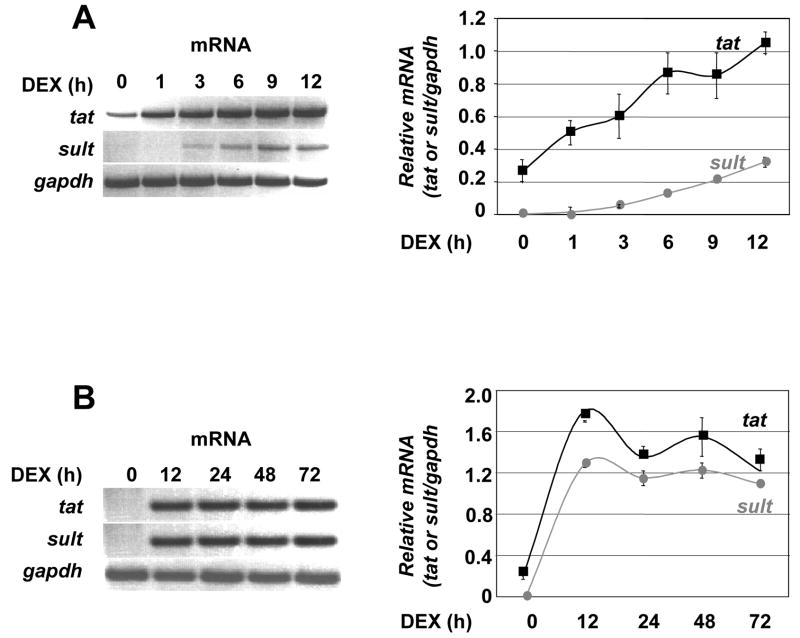
We also examined the kinetics of Dex induction of the tyrosine aminotransferase (tat) and sulfonyl transferase 1A1 (sult) mRNA over 12 hours by RT-PCR in rat hepatoma cells. The tat and sult genes have been previously shown to be direct GR target genes in this cell type [26, 27]. Both tat and sult mRNAs increased within 3 hours of Dex treatment, reaching maximal levels by 12 hours (Fig. 2A). Peak mRNA accumulation persisted throughout 72 hours (Fig. 2B). We therefore chose a 12-hour time course of Dex treatment for the ChIP experiments.
Figure 2. Induction of tyrosine aminotransferase and sulfonyl transferase 1A1 by GR.
A) Rat hepatoma cells were treated with 100 nM Dexamethasone (Dex) over a 12 hour period. Total RNA was harvested, reverse-transcribed, and subjected to PCR with primer pairs to indicated genes, with the gapdh mRNA used as an internal control. The PCR products were resolved on agarose gels, visualized by ethidium bromide staining and quantified relative to the gapdh control. B) RT-PCR done as in (A) over 72 hours. Results are from three independent experiments, each done in duplicate, with error bars representing standard deviation.
3.3 Recruitment of GR phospho-isoforms to the tat GREs
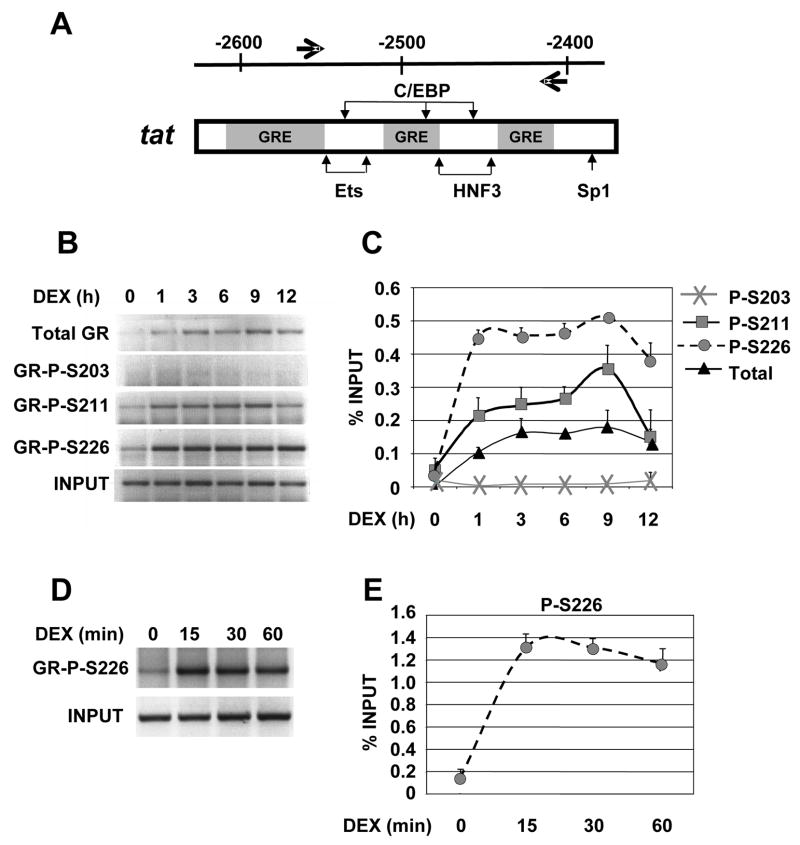
We next examined GR phospho-isoform recruitment to the tat GRE by ChIP using GR phospho-specific antisera. Cells were treated with either ethanol vehicle or Dex for the times indicated and then cross-linked with formaldehyde [20]. The chromatin was sheared and the cross-linked protein-DNA complexes were precipitated with antibodies against total GR or GR P-S203, GR P-S211 and GR P-S226. The tat gene contains a cluster of GREs, residing 2.5 Kb upstream from the start site of transcription that have been shown to be necessary for Dex induction [28, 29] (Fig. 3A). PCR was then performed on the precipitated DNA fragments to amplify this region. An area upstream of tat was amplified as a control for ChIP specificity (data not shown). Quantification of Dex-dependent GR occupancy revealed a significant recruitment of total GR, GR P-S211 and GR P-S226 isoforms within 1 hour. In contrast, we failed to observe any significant recruitment of the GR P-S203 isoform in the presence of Dex (Fig. 3B), despite the ability of this antibody to precipitate GR from cell lysates [14] and its close proximity to the epitope for the GR antibody used to ChIP total GR (see materials and methods). The overall kinetic profiles for the recruitment of GR P-S226 and P-S211 appears similar, however, some differences were observed. The initial peak of recruitment of the P-S226 isoform occurs after only 15 minutes of Dex-treatment, remains relatively high and constant from1–6 hours, and then shows another smaller rise at 9 hours of Dex treatment. GR P-S211 recruitment is observed after 1 hour of Dex treatment, then gradually increases from 3–6 hours and peaks at 9 hour (Fig. 3. C–E). Recruitment of P-S226, P-S211 and total GR all decreased after 9 hours of Dex treatment, likely reflecting hormone-induced down regulation of the receptor (Fig. 1). We conclude that the GR P-S226 and P-S211 are recruited to the tat GRE with discrete kinetic profiles. This suggests that the initial induction of tat by GR may not rely upon S211 phosphorylation, although we cannot exclude that variations in the avidity of the GR P-S226 and P-S211 antibodies may account for the differences in the initial recruitment phase of the receptor phospho-isoforms.
Figure 3. GR phospho-isoform recruitment to tyrosine aminotransferase (tat).
A) Schematic depiction of the tat regulatory regions. GR binding sites (GREs) are shown as gray boxes. The small vertical arrows show additional transcription factor binding sites. The large horizontal arrows represent the primers pairs used to amplify the region that contain the GREs. B) Phospho-GR recruitment to tat over 12 h. Rat hepatoma cells were treated with vehicle or Dex for the times indicated and ChIP were performed with antibodies against total GR, P-S203, P-S211, P-S226 and GR binding sites were amplified by PCR using tat-specific primer pairs and the PCR products resolved on agarose gels, visualized by ethidium bromide staining and quantified relative to input using NIH Image. C) The signal of the PCR product representing 0.5% input was arbitrarily set as 1. Data were averaged from three independent ChIP assays. The error bar represents S.D. D–E) GR P-S226 recruitment to tat over 60 min. Rat hepatoma cells were treated with vehicle or Dex for 0, 15, 30 and 60 min and ChIP were performed and quantitated as described above.
3.4 Recruitment of GR phospho-isoforms to the sult GRE
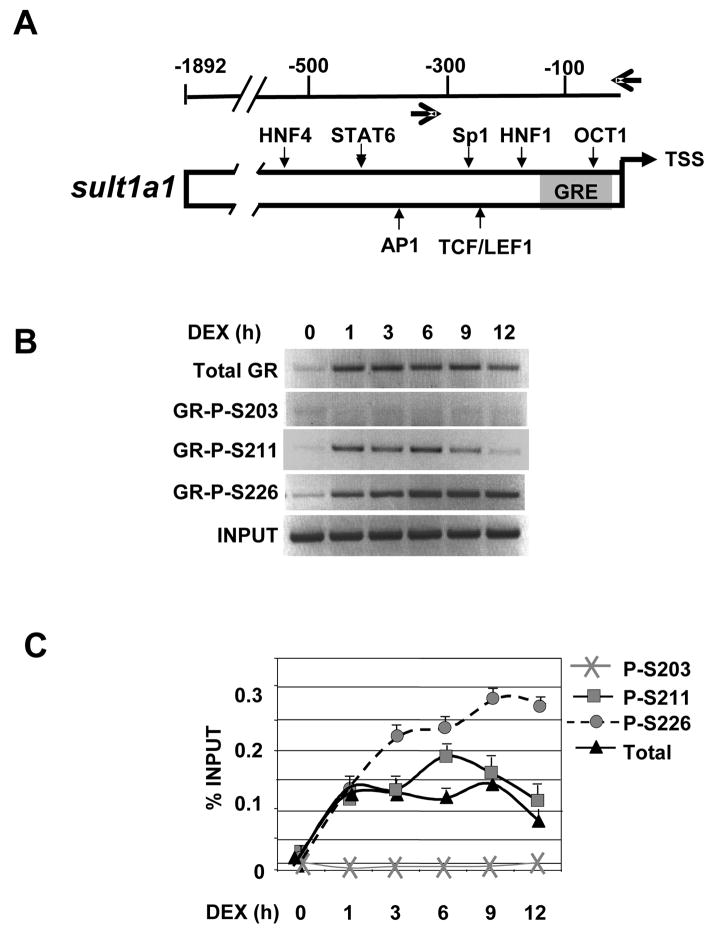
After determining that certain GR phospho-isoforms are differently recruited to tat, we next examined the phospho-GR recruitment to another endogenous target gene, sult. We selected the sult gene since it has only a single promoter proximal GRE located ~100 bp upstream of the transcription start site (Fig. 4A) [27], whereas the tat gene harbors multiple GREs located far upstream of the promoter (Fig. 3A). ChIP analysis revealed differences in GR phospho-isoform recruitment to the sult gene as well. Significant recruitment of total GR and GR P-211 and P-226 isoforms occurred within 1 hour (Fig. 4B and C). Similar to tat, we did not observe recruitment of the GR P-203 to the sult GRE. However, in contrast to tat, we observed a concomitant recruitment of GR P-S226 and P-S211 isoforms to the sult GRE in first hour of Dex-treatment. GR P-S211 recruitment continues to rise at 3 hours, peaking at 6 hours, and declining from 9 to 12 hours. The rise in GR P-S226 occupancy continued from 3–9 hours and then decreased slightly at 12 hours. We conclude that GR S226 and S211 phospho-isoforms are recruited to the sult promoter with roughly similar kinetics within the first hour and diverge at later times, suggesting that S211 and S226 phosphorylation are important for the initial induction of sult by GR.
Figure 4. GR phospho-isoform recruitment to sulfonyl transferase 1A1 (sult).
A) Schematic depiction of the sult regulatory region. The single promoter proximal GR binding site is shown as a gray box. The small vertical arrows show other transcription factor binding sites. The large horizontal arrows depict the primers pairs used to amplify the region that flank the GRE. B–C) Phospho-GR recruitment to sult over 12 h. Rat hepatoma cells were treated with vehicle or Dex for the times indicated and ChIP were performed with antibodies against total GR, P-S203, P-S211, P-S226 and GR binding sites were amplified by PCR using sult -specific primer pairs and the PCR products resolved, stained and quantified as in Figure 3.
3.5 Differential recruitment of the GR P-S211 and P-S226 isoforms to tat and sult GREs
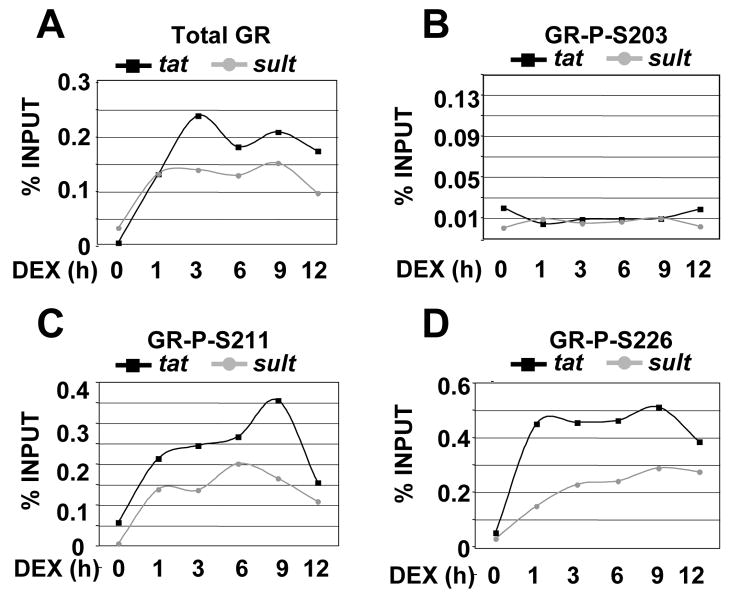
In addition to comparing GR recruitment of all the phospho-isoforms at tat and sult individually (Figs. 3C and 4C), we also plotted GR occupancy for each phospho-isoform side by side at tat and sult (Fig. 5). The kinetics of total GR recruitment at tat and sult is similar, although the amount of GR recruited to tat is greater than at sult, which likely reflects the larger numbers of GREs in the tat regulatory region relative to sult (Fig. 5A). Lack of significant recruitment of the GR P-S203 isoform did not appear to differ between these two genes (Fig. 5B). However, the GR P-S211 and GR P-S226 isoform recruitment revealed marked differences between the genes. The peak in recruitment of GR P-S211 to sult occurred earlier than the maximal phospho-S211 recruitment to tat, suggesting differences in the requirements of GR P-S211 in regulation of these genes. For GR P-S226, we observed a burst of recruitment to tat within one hour of hormone treatment, which is maintained over the next 8 hours, while recruitment of GR P-S226 to the sult increased steadily through 9 hours of treatment. We conclude that specific GR phosphorylated species are differently recruited to the same gene (e.g. GR P-S226 versus GR P-S211 at tat), and certain GR phospho-isoforms are differentially recruited in a gene specific manner (e.g. GR P-S211 and GR P-S226 at tat versus sult). These findings support the hypothesis that GR phospho-isoforms selectively assemble at target genes over time, thus providing an opportunity for GR to regulate genes in a cell-specific manner by modulating receptor phosphorylation.
Figure 5. GR phospho-isoforms are differentially recruited to the tat and sult GREs.
A) Total GR B) P-S203 C) P-S211 and D) P-S226 recruitment to tat and sult over 12 h plotted from Figures 3 and 4.
3.6 Recruitment of GR phospho-isoforms to the gilz regulatory region in U2OS cells
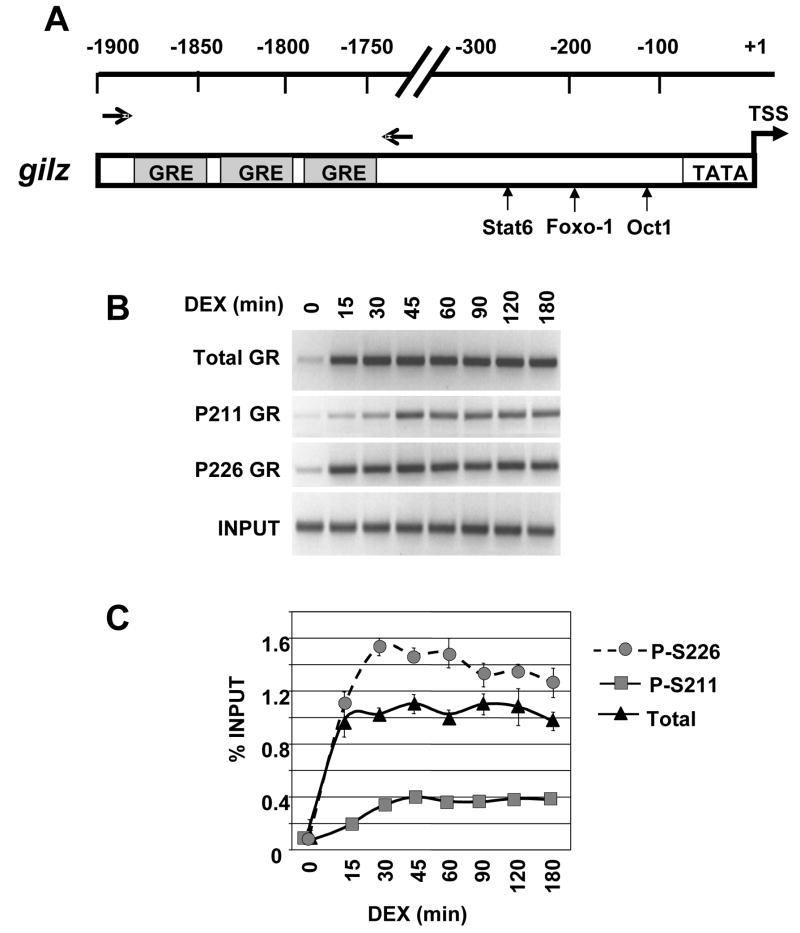
Expression profiling experiments in the human U2OS osteosarcoma cell line ectopically expressing GR identified several glucocorticoid-inducible targets, one of which is the glucocorticoid-induced leucine zipper (gilz) [30]. Our group and others have shown GR recruitment to the gilz regulatory region by ChIP and have determined the kinetics of mRNA induction upon Dex treatment [21, 22]. To determine the kinetics of recruitment to gilz of total GR, GR P-211 and GR P-226, U2OS-hGR cells were treated for180-minutes with 100 nM Dex. The gilz regulatory region contains multiple clustered GREs that reside ~1.7 Kb upstream from the promoter [21, 22]. With the multiple GREs, reminiscent of the tat regulatory region, we would predict that recruitment of GR phospho-isoforms to gilz might resemble tat, with a rapid GR P-226 recruitment followed by a slower GR P-211 occupancy phase. Indeed, maximal GR P-226 recruitment occurs at gilz within 15 minutes, whereas top GR P-211 occupancy occurred more slowly (45 minutes). Total GR recruitment largely parallels that of GR P-226 (Fig. 6B and C). As observed in rat hepatoma cells at the tat and sult promoters, we failed to detect any significant recruitment of GR P-203 to the gilz promoter (data not shown) despite robust recruitment of total GR to the gilz regulatory region (Fig. 6B). This suggests that the lack of GR P-203 recruitment, most likely reflects an absence of nuclear accumulation of this receptor phospho-isoform. GR phospho-isoforms are differentially recruited to the gilz gene in U2OS-hGR and to tat in rat hepatoma, which demonstrates that the GR phospho-isoform recruitment is neither cell type nor species-specific.
Figure 6. GR phospho-isoform recruitment to the gilz regulatory region.
A) Schematic depiction of the gilz regulatory region. The GR binding sites (GREs) are shown as gray boxes. The small vertical arrows show other transcription factor binding sites. The horizontal arrows depict the primers pairs used to amplify the regions encompassing GREs. B–C) Phospho-GR recruitment to gilz over 180 min. U2OS-hGR cells were treated with vehicle or Dex for the times indicated and ChIP were performed with antibodies against total GR, P-S211, P-S226 and GR binding sites were amplified by PCR using gilz-specific primer pairs and the PCR products resolved, stained and quantified as in Figure 3.
4. Discussion
Here we provide the first evidence that GR phospho-isoforms P-S211 and P-S226 are recruited to endogenous target genes upon hormone treatment. We were unable to detect the GR P-S203 isoform at any of the endogenous GREs examined, despite the fact that this antibody is capable of precipitating GR from lysates [9, 14] and that the epitope is only a few amino acids away from that used to generate the total GR antibody (see materials and methods). Although the lack of recruitment of GR P-203 to GR target genes is a negative result and therefore must be interpreted with caution, this finding is consistent with the lack of nuclear accumulation of GR P-203 observed upon ligand treatment [9]. This reinforces the notion that GR phosphorylation is heterogeneous in cells [14] and suggests that the GR P-226 and GR P-211 are likely to participate in the transcriptional response of genes to glucocorticoids, while GR P-203 is less likely to be directly involved with transcriptional initiation. Consistent with this is a previous report that demonstrates GR can be simultaneously phosphorylated on S211 and S226 [14].
The most pronounced difference in phospho-isoform recruitment was observed at the tat promoter, where peak recruitment of GR P-S226 occurs within 15 minutes (Fig. 3C,E). Maximal GR P-226 occupancy to the gilz gene in U2OS-hGR cells was rapid and similar to that of the tat gene in hepatoma cells, whereas recruitment of GR P-211 was much more extended (Figs. 3C & 6C). In contrast, GR P-S226 and P-S211 recruitment to sult at early times after Dex-treatment occurred largely in parallel.
How might we explain differences in GR phospho-isoform recruitment among genes? Although a direct comparison of GR phospho-isoform recruitment is confounded by potential differences in the avidity of the phospho-antibodies, we can speculate about the mechanistic implications of the recruitment patterns for a single antibody at distinct genes. Recall that both tat and gilz harbor multiple GREs upstream of the site of transcription initiation, whereas sult contains only a single promoter proximal GRE. Interestingly, GR induction of gilz is AF1-independent, and given that AF1 harbors the major GR N-terminal phosphorylation sites is therefore predicted not to be affected by changes in GR N-terminal phosphorylation [22, 30]. Consistent with this is the recent finding that gilz induction by GR is not sensitive to reduced protein phosphatase 5 expression (PP5), which affects GR N-terminal phosphorylation [14]. We have also shown that increased receptor occupancy at gilz can override the need for the AF1 coactivator MED14 [22].
The opposite also appears to hold true. We have demonstrated that for GR target genes in U2OS cells such as ifr8 and igfbp1 that harbor a single promoter proximal GRE, induction by GR is AF1-and MED14-dependent, and we would predict to be affected by changes in GR phosphorylation [22]. Indeed, ifr8 and igfbp1 induction by GR is decreased when PP5 protein is reduced [22]. Likewise, GR-dependent activation of ifr8 and igfbp1 are lower in U2OS-hGR-S211A as compared to U2OS-hGR wild type cells (Chen and Garabedian, unpublished observation).
From this we speculate that GR responsive genes controlled by fewer GREs, like sult, would be more phosphorylation-dependent, whereas induction of genes with multiple GREs (tat and gilz) would be less phosphorylation-dependent. Thus, the degree of GR occupancy may explain in part the difference between sult versus tat and gilz in the GR phospho-isoform recruitment patterns. Such differences in GR phospho-isoform utilization as a function of GRE abundance may have developed to coordinate gene expression and signaling events.
Acknowledgments
We thank Susan Ha and Jerome Nwachukwu for evaluating the manuscript. This work was supported by a grant from the NIH DK54836 (MJG).
Footnotes
Publisher's Disclaimer: This is a PDF file of an unedited manuscript that has been accepted for publication. As a service to our customers we are providing this early version of the manuscript. The manuscript will undergo copyediting, typesetting, and review of the resulting proof before it is published in its final citable form. Please note that during the production process errors may be discovered which could affect the content, and all legal disclaimers that apply to the journal pertain.
References
- 1.Buckingham JC. Glucocorticoids: exemplars of multi-tasking. Br J Pharmacol. 2006;147(Suppl 1):S258–68. doi: 10.1038/sj.bjp.0706456. [DOI] [PMC free article] [PubMed] [Google Scholar]
- 2.Yudt MR, Cidlowski JA. The glucocorticoid receptor: coding a diversity of proteins and responses through a single gene. Mol Endocrinol. 2002;16(8):1719–26. doi: 10.1210/me.2002-0106. [DOI] [PubMed] [Google Scholar]
- 3.Picard D. Chaperoning steroid hormone action. Trends Endocrinol Metab. 2006;17(6):229–35. doi: 10.1016/j.tem.2006.06.003. [DOI] [PubMed] [Google Scholar]
- 4.Yamamoto KR. Multilayered control of intracellular receptor function. Harvey Lect. 1995;91:1–19. [PubMed] [Google Scholar]
- 5.Kumar R, Thompson EB. Gene regulation by the glucocorticoid receptor: structure:function relationship. J Steroid Biochem Mol Biol. 2005;94(5):383–94. doi: 10.1016/j.jsbmb.2004.12.046. [DOI] [PubMed] [Google Scholar]
- 6.Bodwell JE, Hu JM, Orti E, Munck A. Hormone-induced hyperphosphorylation of specific phosphorylated sites in the mouse glucocorticoid receptor. J Steroid Biochem Mol Biol. 1995;52(2):135–40. doi: 10.1016/0960-0760(94)00157-h. [DOI] [PubMed] [Google Scholar]
- 7.Weigel NL, Moore NL. Steroid Receptor Phosphorylation: A Key Modulator of Multiple Receptor Functions. Mol Endocrinol. 2007;21(10):2311–9. doi: 10.1210/me.2007-0101. [DOI] [PubMed] [Google Scholar]
- 8.Bodwell JE, Orti E, Coull JM, Pappin DJ, Smith LI, Swift F. Identification of phosphorylated sites in the mouse glucocorticoid receptor. J Biol Chem. 1991;266(12):7549–55. [PubMed] [Google Scholar]
- 9.Wang Z, Frederick J, Garabedian MJ. Deciphering the phosphorylation “code” of the glucocorticoid receptor in vivo. J Biol Chem. 2002;277(29):26573–80. doi: 10.1074/jbc.M110530200. [DOI] [PubMed] [Google Scholar]
- 10.Ismaili N, Garabediana MJ. Modulation of glucocorticoid receptor function via phosphorylation. Ann N Y Acad Sci. 2004;1024:86–101. doi: 10.1196/annals.1321.007. [DOI] [PubMed] [Google Scholar]
- 11.Almlof T, Wright AP, Gustafsson JA. Role of acidic and phosphorylated residues in gene activation by the glucocorticoid receptor. J Biol Chem. 1995;270(29):17535–40. doi: 10.1074/jbc.270.29.17535. [DOI] [PubMed] [Google Scholar]
- 12.Webster JC, Jewell CM, Bodwell JE, Munck A, Sar M, Cidlowski JA. Mouse glucocorticoid receptor phosphorylation status influences multiple functions of the receptor protein. J Biol Chem. 1997;272(14):9287–93. doi: 10.1074/jbc.272.14.9287. [DOI] [PubMed] [Google Scholar]
- 13.Miller AL, Webb MS, Copik AJ, Wang Y, Johnson BH, Kumar R, Thompson EB. p38 Mitogen-activated protein kinase (MAPK) is a key mediator in glucocorticoid-induced apoptosis of lymphoid cells: correlation between p38 MAPK activation and site-specific phosphorylation of the human glucocorticoid receptor at serine 211. Mol Endocrinol. 2005;19(6):1569–83. doi: 10.1210/me.2004-0528. [DOI] [PubMed] [Google Scholar]
- 14.Wang Z, Chen W, Kono E, Dang T, Garabedian MJ. Modulation of glucocorticoid receptor phosphorylation and transcriptional activity by a C-terminal-associated protein phosphatase. Mol Endocrinol. 2007;21(3):625–34. doi: 10.1210/me.2005-0338. [DOI] [PubMed] [Google Scholar]
- 15.Lee MJ, Wang Z, Yee H, Ma Y, Swenson N, Yang L, Kadner SS, Baergen RN, Logan SK, Garabedian MJ, Guller S. Expression and regulation of glucocorticoid receptor in human placental villous fibroblasts. Endocrinology. 2005;146(11):4619–26. doi: 10.1210/en.2005-0235. [DOI] [PubMed] [Google Scholar]
- 16.Wang Z, Garabedian MJ. Modulation of glucocorticoid receptor transcriptional activation, phosphorylation, and growth inhibition by p27Kip1. JBiol Chem. 2003;278(51):50897–901. doi: 10.1074/jbc.M310297200. [DOI] [PubMed] [Google Scholar]
- 17.Krstic MD, Rogatsky I, Yamamoto KR, Garabedian MJ. Mitogen-activated and cyclin-dependent protein kinases selectively and differentially modulate transcriptional enhancement by the glucocorticoid receptor. Mol Cell Biol. 1997;17(7):3947–54. doi: 10.1128/mcb.17.7.3947. [DOI] [PMC free article] [PubMed] [Google Scholar]
- 18.Itoh M, Adachi M, Yasui H, Takekawa M, Tanaka H, Imai K. Nuclear export of glucocorticoid receptor is enhanced by c-Jun N-terminal kinase-mediated phosphorylation. Mol Endocrinol. 2002;16(10):2382–92. doi: 10.1210/me.2002-0144. [DOI] [PubMed] [Google Scholar]
- 19.Rogatsky I, Logan SK, Garabedian MJ. Antagonism of glucocorticoid receptor transcriptional activation by the c-Jun N-terminal kinase. Proc Natl Acad Sci U S A. 1998;95(5):2050–5. doi: 10.1073/pnas.95.5.2050. [DOI] [PMC free article] [PubMed] [Google Scholar]
- 20.Freeman BC, Yamamoto KR. Disassembly of transcriptional regulatory complexes by molecular chaperones. Science. 2002;296(5576):2232–5. doi: 10.1126/science.1073051. [DOI] [PubMed] [Google Scholar]
- 21.Wang JC, Derynck MK, Nonaka DF, Khodabakhsh DB, Haqq C, Yamamoto KR. Chromatin immunoprecipitation (ChIP) scanning identifies primary glucocorticoid receptor target genes. Proc Natl Acad Sci U S A. 2004;101(44):15603–8. doi: 10.1073/pnas.0407008101. [DOI] [PMC free article] [PubMed] [Google Scholar]
- 22.Chen W, Rogatsky I, Garabedian MJ. MED14 and MED1 differentially regulate target-specific gene activation by the glucocorticoid receptor. Mol Endocrinol. 2006;20(3):560–72. doi: 10.1210/me.2005-0318. [DOI] [PubMed] [Google Scholar]
- 23.So AY, Chaivorapol C, Bolton EC, Li H, Yamamoto KR. Determinants of cell- and gene-specific transcriptional regulation by the glucocorticoid receptor. PLoS Genet. 2007;3(6):e94. doi: 10.1371/journal.pgen.0030094. [DOI] [PMC free article] [PubMed] [Google Scholar]
- 24.Thompson EB, Granner DK, Tomkins GM. Superinduction of tyrosine aminotransferase by actinomycin D in rat hepatoma (HTC) cells. J Mol Biol. 1970;54(2):159–75. doi: 10.1016/0022-2836(70)90424-9. [DOI] [PubMed] [Google Scholar]
- 25.Vanderbilt JN, Miesfeld R, Maler BA, Yamamoto KR. Intracellular receptor concentration limits glucocorticoid-dependent enhancer activity. Mol Endocrinol. 1987;1(1):68–74. doi: 10.1210/mend-1-1-68. [DOI] [PubMed] [Google Scholar]
- 26.Granner D, Chase LR, Aurbach GD, Tomkins GM. Tyrosine aminotransferase: enzyme induction independent of adenosine 3′, 5′-monophosphate. Science. 1968;162(857):1018–20. doi: 10.1126/science.162.3857.1018. [DOI] [PubMed] [Google Scholar]
- 27.Duanmu Z, Kocarek TA, Runge-Morris M. Transcriptional regulation of rat hepatic aryl sulfotransferase (SULT1A1) gene expression by glucocorticoids. Drug Metab Dispos. 2001;29(8):1130–5. [PubMed] [Google Scholar]
- 28.Grange T, Roux J, Rigaud G, Pictet R. Two remote glucocorticoid responsive units interact cooperatively to promote glucocorticoid induction of rat tyrosine aminotransferase gene expression. Nucleic Acids Res. 1989;17(21):8695–709. doi: 10.1093/nar/17.21.8695. [DOI] [PMC free article] [PubMed] [Google Scholar]
- 29.Grange T, Cappabianca L, Flavin M, Sassi H, Thomassin H. In vivo analysis of the model tyrosine aminotransferase gene reveals multiple sequential steps in glucocorticoid receptor action. Oncogene. 2001;20(24):3028–38. doi: 10.1038/sj.onc.1204327. [DOI] [PubMed] [Google Scholar]
- 30.Rogatsky I, Wang JC, Derynck MK, Nonaka DF, Khodabakhsh DB, Haqq CM, Darimont BD, Garabedian MJ, Yamamoto KR. Target-specific utilization of transcriptional regulatory surfaces by the glucocorticoid receptor. Proc Natl Acad Sci U S A. 2003;100(24):13845–50. doi: 10.1073/pnas.2336092100. [DOI] [PMC free article] [PubMed] [Google Scholar]


