Abstract
A common micromixer design strategy is to generate interleaved flow topologies to enhance diffusion. However, problems with these designs include complicated structures and dead volumes within the flow fields. We present an active micromixer using a resonating piezoceramic/silicon composite diaphragm to generate acoustic streaming flow topologies. Circulation patterns are observed experimentally and correlate to the resonant mode shapes of the diaphragm. The dead volumes in the flow field are eliminated by rapidly switching from one discrete resonant mode to another (i.e., resonant mode-hop). Mixer performance is characterized by mixing buffer with a fluorescence tracer containing fluorescein. Movies of the mixing process are analyzed by converting fluorescent images to two-dimensional fluorescein concentration distributions. The results demonstrate that mode-hopping operation rapidly homogenized chamber contents, circumventing diffusion-isolated zones.
Keywords: microfluidics, micromixer, acoustic streaming, mode-hopping micromixing, fluorescent image calibration
1. Introduction
Rapid mixing is often a requirement for microfluidic lab-on-a-chip biological assays where the rate of mixing is dominated by diffusion [1]. A common strategy for efficient micromixing is to increase the interfacial area between different fluids by passive (without introducing external energy) or active (by introducing external energy) methods. Typically, passive micromixers include flow separation and recombination which requires complex multi-layer channel structures and precise alignment between assembled device layers [2-4], or employing transverse flow to generate chaotic advection in micro-channels [5, 6]. Active micromixers promote mixing by introducing mechanical energy [7-10], or electrokinetic energy [11]. Although usually considered more efficient than their passive counterparts, active mixing often requires complicated device actuators and fabrication protocols. Micromixing is a ubiquitous requirement of virtually all microscale bioanalytical systems. Recent general reviews have presented in part this significant body of work [12, 13]. While much has been achieved, new approaches and evolutionary improvements continue to appear in service to a broad range of specific applications.
This paper presents an active micromixer with a piezoceramic/silicon composite diaphragm that employs acoustic streaming [14] to homogenize mixing chamber contents using a unique switching flow pattern feature (mode-hop). The diaphragm is driven at resonant frequencies to achieve large vibration amplitudes using sinusoidal excitation at constant voltage amplitude [15]. A similar device design, comprising a chamber operated at the first resonant frequency, has been used in MEMS pumps [16]. In these pump chambers, circulations at higher frequencies were observed, but were not correlated to vibrational resonant modes or developed and demonstrated for mixing applications. The circulation patterns we have observed resemble the resonance vibrational mode shapes of the piezoelectric composite diaphragm. The mode shapes of this chamber are a function of the frequency of the driving voltage, and the vibrational amplitudes of the diaphragm are a function of both frequency and amplitude of the driving voltage. Each mode shape and vibrational amplitude define a streaming topology. Rapid interleaving of acoustic streaming topologies is achieved with fluid folding at increasing discrete drive frequencies. Compared to the other published acoustic-vibration-based micromixers [8], our design has the advantage of simple construction and flow pattern controllability.
2. Experimental section
2.1. Micromixer design
A schematic of the circular flow chamber is shown in Fig. 1. The design, materials, geometries, and fabrication method used were similar to that of Andersson [16]. The device consists of two inlet ports, a 6 mm diameter by 30 μm deep chamber, and one outlet port connected to downstream analysis modules. A 6 mm × 6 mm, 190 μm thick (lead-zirconate-titanate) PZT element is attached to a 210 μm thick silicon diaphragm, forming a piezoceramic/silicon composite. The resonant mode shapes of this composite diaphragm can be visualized using the analytical expression of the mode shapes of a clamped edge circular disk such that
Figure 1.
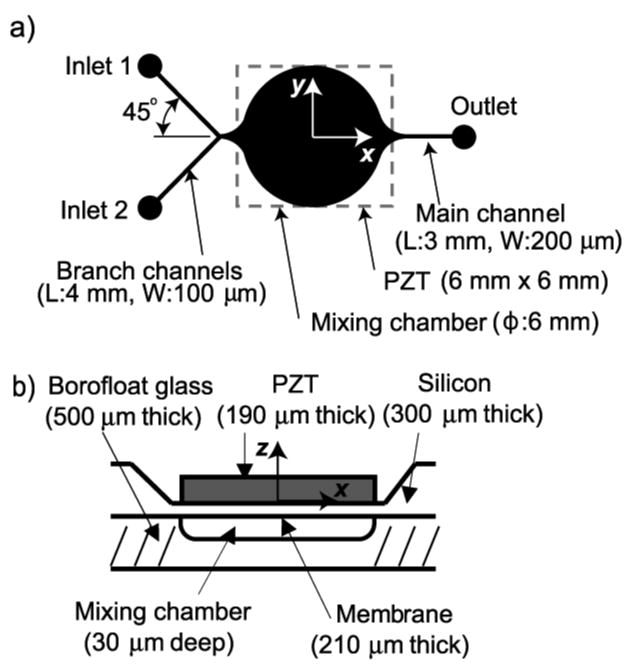
Schematic of the mixing chamber: (a) schematic layout, (b) cross-sectional view that shows the chamber structure.
| (1) |
and the eigenvalue λi,j are discrete values that satisfy
| (2) |
where z is the transverse displacement of the disk, [r,θ] is position in polar coordinates, a is the radius of the disk, i is the number of nodal diameters, j is the number of nodal circles (except boundary), I is the modified Bessel function of first kind, and J is the Bessel function of first kind [17]. Figure 2a shows the first three mode shapes (j = 0, i = 0, 1, 2, respectively) according to Eqs. (1)–(2). Net circulations, visualized by seeding fluorescence microspheres in the mixer, form in patterns with the shapes resembling the resonant mode shapes of the diaphragm (Fig. 2b-d). A resonant mode-hop can be achieved by instantaneously switching from one resonant frequency of the diaphragm to another. The frequency of an undamped, clamped edge circular disk is analytically expressed as
Figure 2.
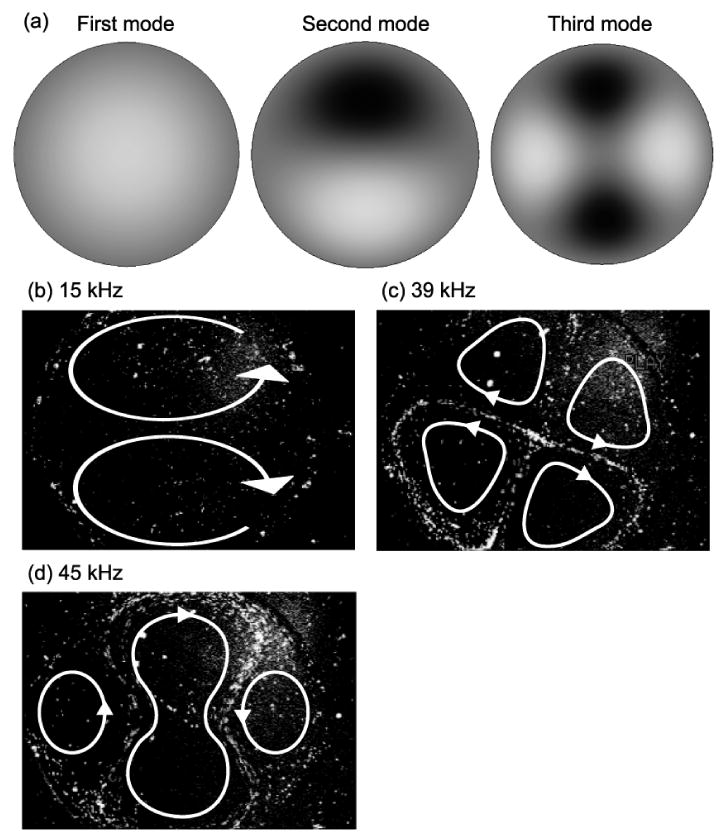
The resonant mode-shapes of a circular diaphragm: (a) The first three resonant mode-shapes calculated using Eqs. (1)–(2); (b) circulations at the second resonant frequency, 15 kHz; (c) circulations at the third resonant frequency, 39 kHz; and (d) an additional third resonant frequency, 45 kHz due to non-linear mechanical behavior.
| (3) |
where E, h, ν, γ are the Young's modulus, thickness, Poisson's ratio, and mass per unit area of the disk, respectively [17]. Equation (3) implies the effect of the dimension of the circular diaphragm––small mixing chambers result in high resonant frequencies. When optimizing for speed of mixing, the presented mixer design favors smaller chamber diameters. This is because the small diffusive length and faster flow velocities due to higher resonant frequencies using small driving diaphragms lead to more efficient and rapid mixing of chamber fluids. The liquid in the circular chamber generates additional damping, shifting the actual resonant frequencies of the active diaphragm lower than predicted using Eq. (3). Here, we implemented a 6 mm diameter mixer and focused on our characterization efforts on the complex mode-hopping effects through switching driving frequency. The study provides a basis for evaluation of additional due to changes in geometry and material used.
2.2. Fabrication process
The glass chamber and silicon diaphragm were fabricated separately. To fabricate the glass chamber, chromium (Cr, 100 Å) and gold (Au, 800 Å) layers were deposited onto a 500 μm thick glass wafer. A spin-coat of AZ1512 photoresist (Clariant Corporation, Sommerville, NJ) was patterned by standard photolithographic methods. Gold and chrome etchants were used to expose glass in the chamber and channel regions. Hydrofluoric acid (HF, 49% concentration) was used to etch the exposed glass. The remaining photoresist, Au and Cr on the glass were removed by acetone, gold etchant, and chromium etchant, to complete the glass microfabrication steps.
The silicon diaphragm was made by etching a (100) silicon wafer. A 2000-Å silicon nitride layer (Si3N4) was deposited on the both sides of the wafer using low-pressure chemical vapor deposition (LPCVD). The exposed silicon nitride was etched using reactive ion etch (RIE). AZ1512 photoresist was spin-coated and the diaphragm chamber pattern exposed and developed, exposing silicon nitride in the diaphragm regions only. The remaining photoresist was stripped using acetone. Next, 45% Potassium Hydroxide (KOH) at 75 °C was used to perform an anisotropic etch of Si to form thin diaphragms. After completing the KOH etch, the silicon nitride on both sides of the wafer was removed using RIE. Inlet and outlet fluid ports were drilled in the finished silicon diaphragm device using diamond-impregnated bits.
The glass was bonded to the silicon using anodic bonding (400 °C, 500 V). A square PZT element die (PSI-5H4E, Piezo Systems, Cambridge, MA) was attached to the silicon diaphragm with silver epoxy (H37-MPT, Epoxy Technology, Billerica, MA), and cured at 180 °C on a hot plate for 60 minutes. Finally, two stainless steel hypodermic tubes (18G) were fixed into the inlet and outlet holes of the silicon diaphragm with epoxy.
2.3. Materials
The carrier buffer for diffusion experiments was 0.01 mM Tris at pH 9.0. A solution of 0.1 mM fluorescein (F-7505, Sigma Chemical Co., St. Louis, MO) in the carrier buffer was used as a fluorescent tracer. The excitation and emission maxima of the fluorescein are 490 nm and 515 nm, respectively. The non-fluorescent liquid used for observing the contrast with fluorescein was the carrier buffer. The diffusion coefficient D of fluorescein in Tris buffer is on the order of 10-9 m2/s [18]. For the presented chamber with diameter d = 6 mm, the characteristic diffusion time d2/D is approximately 10 hours.
3. Experimental setup
A solution of 0.1 mM fluorescein in the carrier buffer was introduced into the mixing chamber through inlet one (Fig. 1) and the carrier buffer was introduced through inlet two by a dual tube peristaltic pump (1-P625/10K.143, Instech Laboratories, Inc., Plymouth Meeting, PA). The pump was stopped during mixing. The mixing process throughout the chamber was observed using a fluorescence microscope (Axiovert 200M, Carl Zeiss Microimaging Inc., Thornwood, NY) with a 1.25× objective and a 0.5× demagnification lens. The objective has a large depth of field, so the fluorescence emission throughout the mixer depth weights equally for image acquisition. The excitation light source was a 100-Watt mercury arc lamp (HBO 100, Carl Zeiss Microimaging Inc., Thornwood, NY). An arbitrary function generator (AFG 310, Tektronix Inc., Beaverton, OR) and a power amplifier (Model 603, Trek Inc., Medina, NY) were used to drive the diaphragm with a sinusoidal signal. The frequency of the signal can be programmed to change from one vibrational mode frequency to the next, enabling mode-hopping operation.
3.1. Mixing image acquisition
An NTSC-standard CCD camera (KP-D20A, Hitachi Kokusai Electric, Inc., Tokyo, Japan) on the fluorescence microscope was used to monitor the micromixer. All automatic tuning features of the camera (e.g., auto white-balance, auto exposure) were turned off. The video was recorded with a videocassette recorder, and then digitized into 8-bit monochrome images, resulting in a range of 256 intensity counts at each pixel. Each frame contained 480 × 720 pixels. A custom analysis algorithm extracted one image frame per second from the recorded video.
3.2. Calibration of fluorescein concentration
The intensity of observed fluorescence is affected by fluorescein concentration, illumination uniformity, and photobleaching. The imaged emission intensity is denoted as a function
| (4) |
where x, y are spatial coordinates as defined in Fig. 1a, t is time with t = 0 as the beginning of image acquisition, f(x,y) models illumination distribution, g(t) models photobleaching, and h(C(x,y,t)) is a function of the fluorescein distribution at time t. Approximated expressions for the functions f, g, and h are required for fluorescein distribution estimation from acquired images of fluorescein emission intensity.
To identify these functions, reference images were acquired by filling the micromixer with premixed solutions of fluorescein dyes from 0.05 mM to 0.10 mM with an increment of 0.01 mM. Fig. 3a shows the profile of the imaged emission intensity on the y-axis at t = 0. The illumination distribution function f is normalized and independent of fluorescein concentration, and is approximated by a two-dimensional quadratic form [19]:
Figure 3.
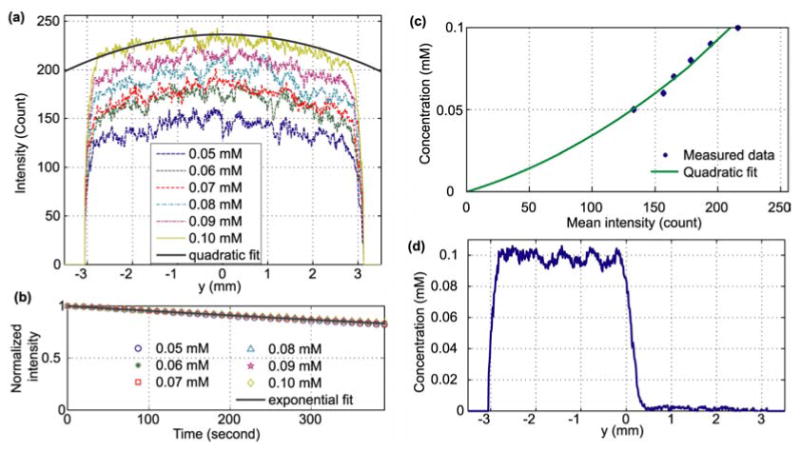
Calibration characterization of mixing images: (a) the spatial fluorescein emission distribution of six constant fluorescein concentrations along the y-axis, (8-bit gray-scale). The thick line is the quadratic fit of the 0.1 mM fluorescein concentration intensity: 236.4 (−1314x2 − 1356y2 + 4.106xy+1); (b) The 6.5-minute record of fluorescein emission decay due to photobleaching. The intensity is averaged over the area of the micromixer. The exponential fit is . (c) The relationship between the mean intensity over the area of the micromixer and fluorescein concentration. The solid curve is a quadratic fit with a 95% confidence interval of 0.0015 mM; (d) the uncalibrated image: the fluorescein intensity distribution of all mixing experiments; (f) the calibrated image at t = 0 along the y-axis: the distribution of fluorescein concentration using Eq. (5), where the left side contains 0.1 mM fluorescein and 0 mM on the right side.
| (5) |
where a6 ≡ 1 for normalization. Fitting the intensity distribution of 0.01 mM data to Eq. (2) results in [a1, a2, a3, a4, a5, a6] = [-1314 m-2, -1356 m-2, 4.106 m-2, -6.219×10⁻⁶ m-1, 2.534×10⁻⁶ m-1, 1].
The photobleaching effect is an exponential function of time [20], given as
| (6) |
where τ is the emission intensity decay time constant due to photobleaching. The non-uniformity of illumination across the field of view is less than 10%, so the effect of nonuniform illumination to τ is assumed to be negligible. The measured photobleaching data for six constant fluorescein concentrations during a 6.5-minute period are shown in Fig. 3b, where the vertical axis is the intensity within the whole micromixer and normalized with respect to the intensity at t = 0. The photobleach decay time τ is 2.13×10³ s.
The function h, describing the relationship between intensity and concentration, was estimated by filling the chamber with different concentrations of fluorescein and measuring the resulting mean emission intensity Ī at t = 0 as a function of the homogeneous concentrations. The mapping from intensity to concentration, h−1, is used for convenience. The relationship between fluorophore concentration and emission intensity is characterized as linear in the literature [21] for dilute concentrations where inner filter effects are absent. However, our data (dots in Fig. 3c) show a nonlinear relationship because of the poor internal gamma correction of the CCD camera. To correct the nonlinearity, we found a quadratic curve fits well to the set of calibrant standards used (solid curve in Fig. 3d):
| (7) |
where [b1, b2, b3] = [1.14×10⁻⁶, 2.30×10⁻⁴, -1.76×10⁻⁴] mM.
With the approximation of Eqs. (5) through (7), Eq. (4) can be rewritten as
| (8) |
All images of mixing were converted to fluorescein concentration maps using Eq. (8). Figure 3d shows the calibrated concentration profile after using Eq. (8), when half of the chamber (−3 mm ≤ y < 0 mm) was filled with 0.1 mM fluorescein, while the other half (0 mm ≤ y ≤ 3 mm) was filled with the carrier buffer.
3.3. Quantifying mixing
Mixing is quantified in the form of standard deviation of the fluorescein concentration in the micromixer, a scale commonly used to assess homogeneity [5, 6], such that
| (9) |
where σ is the fluorescein concentration deviation from a fully mixed concentration Cmixed (= 0.05 mM in all mixing experiments, the known final equilibrium concentration), Ci is the fluorescein concentration at the ith pixel, and N is the total number of pixels in the mixing chamber. As σ decreases, mixing approaches completion (where σ = 0).
4. Results and discussion
4.1. Pure diffusion in microchamber
Figure 4 shows the mixing process where the diaphragm remained static throughout the experiment, demonstrating the lack of efficiency of pure diffusion. A series of experiments were designed to quantitatively assess the effectiveness of mode-hopping associated diffusive mixing in large aspect ratio microchambers. To perform this test, the device of Fig. 1a was loaded with Tris buffer in inlet 1 and fluorescein indication dye laden Tris buffer in inlet 2 using a two channel peristaltic pump.
Figure 4.
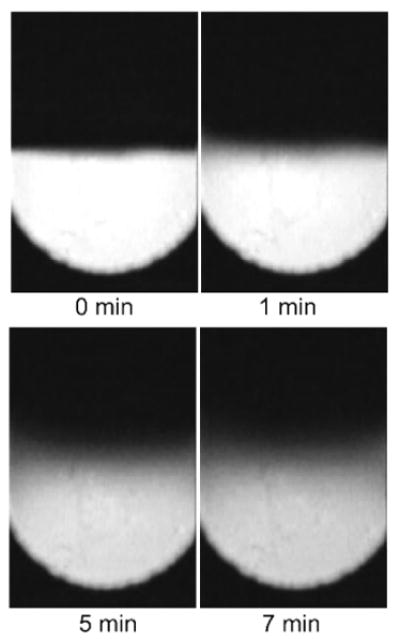
Diffusion in a 6-mm-diameter mixing chamber without actuation.
4.2. Fixed actuation frequencies
Acoustic streaming as a means of removing zones of diffusive isolation was examined in three single mode and two multimode (mode-hopping) configurations (Table 1). Three resonant mode acoustic stream actuation frequencies were selected: 15 kHz (at the second resonant mode); 39 and 45 kHz (at the third resonant modes). Both 39 and 45 kHz excite the third vibrational mode (Fig. 2a) but are differentiated by nonlinear dynamical effects [15]. Two circulation regions were generated at 15 kHz as indicated in Fig. 2. The mixing images at t = 0, 10, 20, and 30 s are shown in Fig. 5, where t = 0 is the time when a resonance of 15 kHz started. Flow circulation stretched and folded the fluid interface, but large unmixed regions remained after 30 s.
Table 1. Mixing experiment drive parameters for the piezoceramic/silicon composite diaphragm.
| Name | Driving frequencies |
|---|---|
| 15 kHz | 15 kHz constantly |
| 39 kHz | 39 kHz constantly |
| 45 kHz | 45 kHz constantly |
| Slow mode hopping | Repeating 45 kHz for 10 s, then 39 kHz for 5 s |
| Fast Mode hopping | Repeating 45 kHz for 5 s, then 39 kHz for 5 s |
Figure 5.
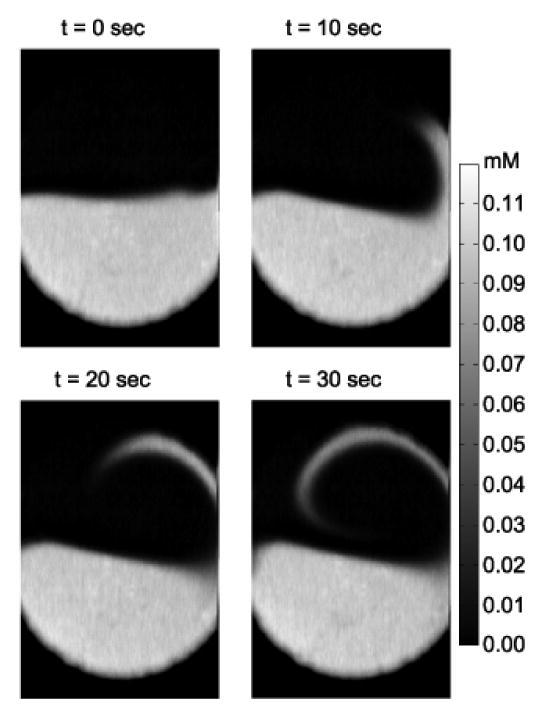
Active micromixing at 15 kHz. The color bar at the right indicates the fluorescein concentration.
Mixing behavior generated by acoustic streaming at 39 kHz is shown in Fig. 6. This resonant frequency induced a faster flow circulation velocity than the 15 kHz case with three to four layers of liquid interface stretched and folded at the end of the 30 s observation interval. The interface was distorted and elongated, more than the 15 kHz case.
Figure 6.
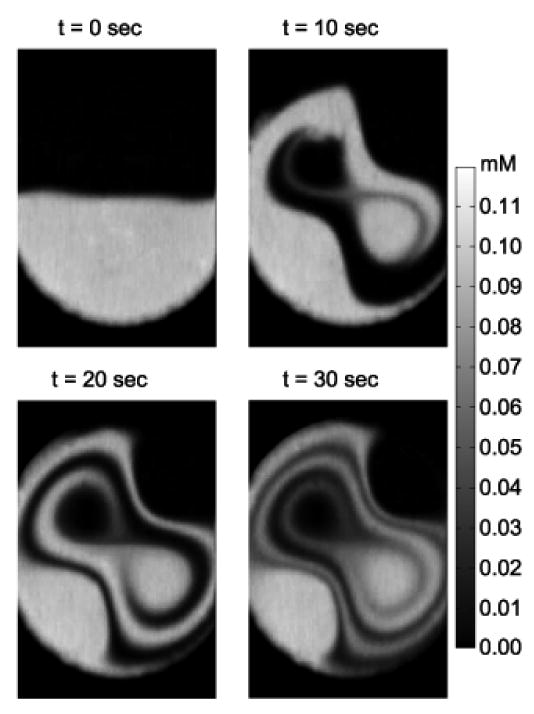
Active micromixing process when the diaphragm was actuated at 39 kHz.
At 45 kHz (Fig. 7) the pattern is similar to that at 39 kHz. The circulation velocity at this resonant frequency is faster than that of the 39 kHz case, with the mixing region interface zones better positioned to reduce the characteristic dimension for diffusion of the zones of fluid to be homogeneously mixed. The mixer in this excitation configuration folded two to three layers of liquid interface at t = 10 s. Strong stretching and folding enhanced mixing significantly in comparison the 15 and 39 kHz excited configurations. However, the circulations near the inlet and outlet were not mixed as well as some other regions, where diffusively isolated regions remained. As a strategy directed towards eliminating diffusively isolated regions within the mixing chamber, the concept of switching between modes, or mode-hopping, was conceived and applied.
Figure 7.
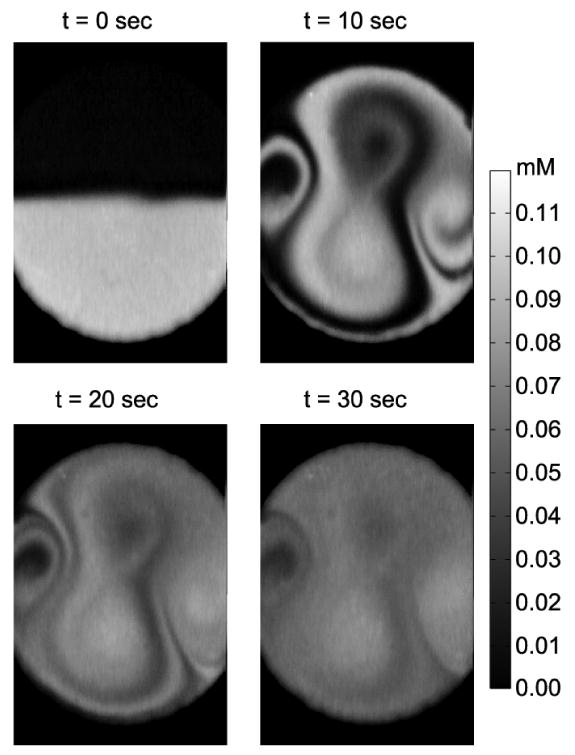
Active micromixing at 45 kHz.
4.3. Mode hopping actuation
The first mode hopping experiment contained a 15 s period cycle comprising 45 kHz actuation for 10 s followed by 39 kHz for 5 s. This cycle was repeated for 6 minutes (Fig. 8). The folding pattern at t = 10 s was the same as the pattern of the constant 45 kHz case at t = 10 s (Fig. 7), while the later mode-hopping operation changed the shape of concentration patterns. The two circulations near the inlet and outlet (Fig. 7) were elongated and patterns for successful homogenization of chamber contents established. Unmixed regions were still distinguishable at t = 30 s.
Figure 8.
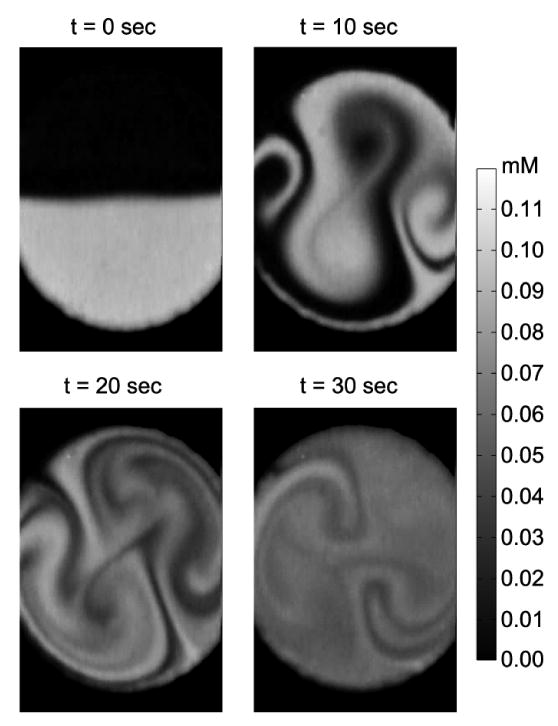
Active periodic mode-hop micromixing using periodic excitation of 45 kHz for 10 s, followed by 39 kHz for 10 s to mix fluids.
The second periodic mode hopping experiment was performed with a 10 s period comprising a 5 s actuation at 45 kHz followed by 5 s at 39 kHz (Fig. 9). The increased frequency of mode hopping produced an increased fluid striation layering, resulting in a more homogeneous concentration distribution at 30 s (Fig. 7).
Figure 9.
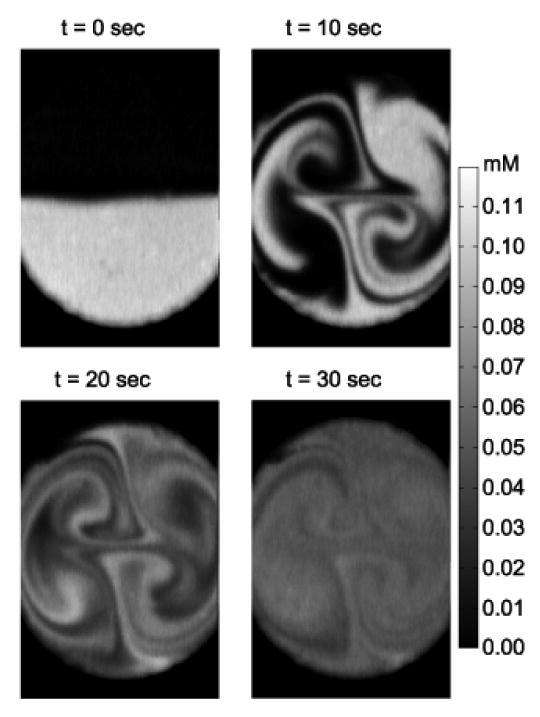
Active periodic mode-hop micromixing using periodic excitation of 45 kHz for 5 s, followed by 39 kHz for 5 s.
4.4. Mixing versus driving frequencies
Quantitative comparison of five mixing configurations (Table 1) that were analyzed using Eq. (9) is presented in Fig. 10. The horizontal axis is time (from t = 0 to t = 60 with t = 0 being the start of actuation) and the vertical axis is the concentration standard deviation, σ. For homogeneous mixing concentrations, a standard deviation of zero describes a fully mixed condition (neglecting effects due to image noise). As expected, resonant mixing at 15 kHz was least effective in homogenizing chamber contents. Resonant mixing at 39 kHz was more effective but the existence of large diffussionally isolated recirulatory zones is clearly apparent. A frequency of 45 kHz provided the most rapid homogeneous (steepest slope) mixing among all the cases during the initial 20 s. However, diffusively isolated zones caused the slope of the concentration deviation to become flat after t ≈ 20 s (Fig. 7).
Figure 10.
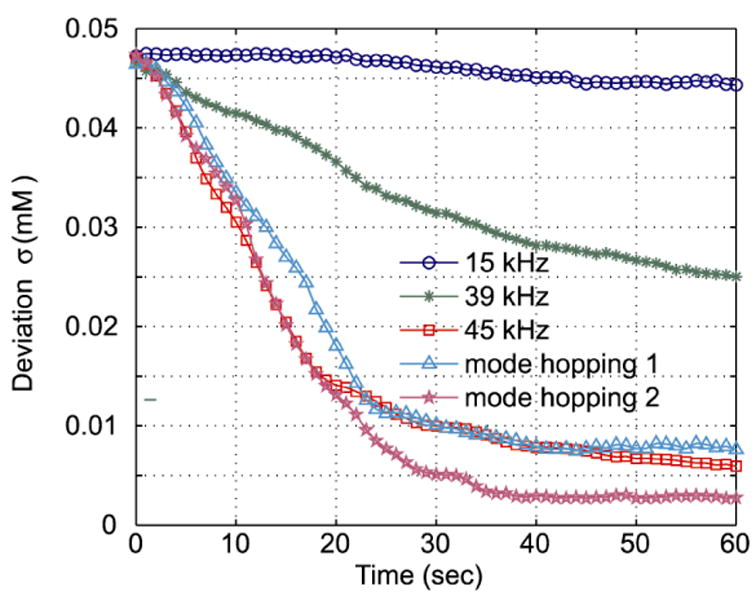
Quantitative assessment of mixing in terms of the concentration deviation (Eq. (9)) as a function of time. The 95% confidence intervals of the curves are smaller than 0.0015 mM.
The mixing speeds of the two mode-hopping cases were among the fastest. Comparison of the two periodic mode-hopping configurations demonstrates that the periodic waveform used is very important with regard to mixing quickly and efficiently. Specifically, switching the driving frequencies changes the σ slopes observed in Fig. 10, reflecting the behavior of individual modes applied to new concentration profile initial conditions upon mode initiation. For example, initially both the mode-hopping results have similar slopes to the 45 kHz result due to the same initial condition, but subsequent sequential frequency switching changes the respective σ slopes.
A major advantage of mode hopping operation can be seen after t = 20 s, when the σ of the constant 45 kHz case decreased slowly due to the unmixed regions, while σ of the second mode-hopping case continued decreasing until t = 30 s. The overall performance of the constant 45 kHz case is worse than the fast mode-hopping case, but better than the slow mode-hopping case. The result indicates the mode-hopping rates and selected mode shapes are critical to optimization of mixing performance.
5. Conclusions
We report an active micromixer that is composed of a piezoceramic/silicon diaphragm. Mixing patterns were changed by switching the driving frequency, resulting in the removal of unmixed regions in the mixing chamber and more efficient mixing. A calibration procedure has been developed to convert fluorescein fluorescence images to fluorescein concentration distributions, allowing for a quantitative analysis of the mixing process. Such procedures provide a simple method for general, quantitative calibration to assess mixing homogeneity. Experimental results show the solution mixed faster when driving at larger resonant frequencies corresponding to more intense acoustic streaming when compared smaller drive frequencies having less active acoustic streaming effects. Faster mode-hopping rates mixed more efficiently by increasing the stretching and folding of chamber fluids.
Further understanding of the tradeoffs associated with mode-hopping mixing is needed in order to optimize multiplexing of input voltages and frequencies for optimal mixing efficiency using this approach. The effect of continuous net flow will complicate the circulation patterns in the mixing chamber, but will be important for applications that desire continuous solution supply.
Acknowledgments
We gratefully acknowledge the Washington Technology Center Microfabrication Laboratory and its staff for fabrication support, Prof. Lloyd Burgess and Joe Dragavon at the University of Washington for their editing effort, and the support of this research by the NIH National Human Genome Research Institute, Centers of Excellence in Genomic Science, Grant Number 1 P50 HG002360-01, CEGSTech: Integrated Biologically-Active Microsytems.
Footnotes
Publisher's Disclaimer: This is a PDF file of an unedited manuscript that has been accepted for publication. As a service to our customers we are providing this early version of the manuscript. The manuscript will undergo copyediting, typesetting, and review of the resulting proof before it is published in its final citable form. Please note that during the production process errors may be discovered which could affect the content, and all legal disclaimers that apply to the journal pertain.
References
- 1.Meldrum DR, Holl MR. Microscale bioanalytical systems. Science. 2002;297(5584):1197–1198. doi: 10.1126/science.297.5584.1197. [DOI] [PubMed] [Google Scholar]
- 2.Miyake R, Lammerink TSJ, Elwenspoek M, Fluitman JHJ. Micro mixer with fast diffusion. Proceedings of Micro Electro Mechanical Systems; 7-10 Feb 1993; 1993. [Google Scholar]
- 3.He B, Burke BJ, Zhang X, Zhang R, Regnier FE. A picoliter-volume mixer for microfluidic analytical systems. Analytical Chemistry. 2001;73(9):1942–1947. doi: 10.1021/ac000850x. [DOI] [PubMed] [Google Scholar]
- 4.Koch M, Chatelain D, Evans AGR, Brunnschweiler A. Two simple micromixers based on silicon. Journal of Micromechanics and Microengineering. 1998;8(2):123–126. [Google Scholar]
- 5.Liu RH, Stremler MA, Sharp KV, Olsen MG, Santiago JG, Adrian RJ, Aref H, Beebe DJ. Passive mixing in a three-dimensional serpentine microchannel. Journal of Microelectromechanical Systems. 2000;9(2):190–7. [Google Scholar]
- 6.Stroock AD, Dertinger SKW, Ajdari A, Mezic I, Stone HA, Whitesides GM. Chaotic mixer for microchannels. Science. 2002;295:647–51. doi: 10.1126/science.1066238. [DOI] [PubMed] [Google Scholar]
- 7.Kaajakari V, Sathaye A, Lal A. A frequency addressable ultrasonic microfluidic actuator array. Proceedings of 11th International Conference on Solid State Sensors and Actuators Transducers '01/Eurosensors XV; 2001. [Google Scholar]
- 8.Rife JC, Bell MI, Horwitz JS, Kabler MN, Auyeung RCY, Kim WJ. Miniature valveless ultrasonic pumps and mixers. Sensors and Actuators a-Physical. 2000;86(12):135–140. [Google Scholar]
- 9.Liu RH, Yang JN, Pindera MZ, Athavale M, Grodzinski P. Bubble-induced acoustic micromixing. Lab on a Chip. 2002;2(3):151–157. doi: 10.1039/b201952c. [DOI] [PubMed] [Google Scholar]
- 10.Yang Z, Goto H, Matsumoto M, Maeda R. Active micromixer for microfluidic systems using lead-zirconate-titanate (PZT)-generated ultrasonic vibration. Electrophoresis. 2000;21(1):116–9. doi: 10.1002/(SICI)1522-2683(20000101)21:1<116::AID-ELPS116>3.0.CO;2-Y. [DOI] [PubMed] [Google Scholar]
- 11.Oddy MH, Santiago JG, Mikkelsen JC. Electrokinetic instability micromixing. Analytical Chemistry. 2001;73(24):5822–5832. doi: 10.1021/ac0155411. [DOI] [PubMed] [Google Scholar]
- 12.Nguyen NT, Wu ZG. Micromixers - a review. Journal of Micromechanics and Microengineering. 2005;15(2):R1–R16. [Google Scholar]
- 13.Hessel V, Lowe H, Schonfeld F. Micromixers - a review on passive and active mixing principles. Chemical Engineering Science. 2005;60(89):2479–2501. [Google Scholar]
- 14.Riley N. Steady streaming. Annual Review of Fluid Mechanics. 2001;33:43–65. [Google Scholar]
- 15.Jang L, Chao S, Holl MR, Meldrum DR. Microfluidic Circulatory Flows Induced by Resonant Vibration of Diaphragms. Sensors and Actuators A (Physical) 2005;122(1):141–148. [Google Scholar]
- 16.Andersson H, Wijngaart W, Nilsson P, Enoksson P, Stemme G. A valve-less diffuser micropump for microfluidic analytical systems. Sensors and Actuators. 2001;B 72:259–265. [Google Scholar]
- 17.Blevins RD. Formulas for natural frequency and mode shape. 2nd. Krieger Pub; Malabar, Fla: 1995. [Google Scholar]
- 18.Galambos PC. Two-phase dispersion in micro-channels / by Paul Galambos. vii. 1998. p. 154 leaves. 1959. [Google Scholar]
- 19.van den Doel LR, Klein AD, Ellenberger SL, Netten H, Boddeke FR, van Vliet LJ, Young IT. Quantitative evaluation of light microscopes based on image processing techniques. Bioimaging. 1998;6(3):138–149. [Google Scholar]
- 20.Zwier JM, Van Rooij GJ, Hofstraat JW, Brakenhoff GJ. Image calibration in fluorescence microscopy. Journal of Microscopy-Oxford. 2004;216:15–24. doi: 10.1111/j.0022-2720.2004.01390.x. [DOI] [PubMed] [Google Scholar]
- 21.Gaigalas AK, Wang LL, Schwartz A, Marti GE, Vogt RF. Quantitating fluorescence intensity from fluorophore: Assignment of MESF values. Journal of Research of the National Institute of Standards and Technology. 2005;110(2):101–114. doi: 10.6028/jres.110.010. [DOI] [PMC free article] [PubMed] [Google Scholar]


