Abstract
In large multi-antenna systems, adaptive controllers can aid in steering the heat focus toward the tumor. However, the large number of sources can greatly increase the steering time. Additionally, controller performance can be degraded due to changes in tissue perfusion which vary non-linearly with temperature, as well as with time and spatial position. The current work investigates whether a reduced-order controller with the assumption of piecewise constant perfusion is robust to temperature-dependent perfusion and achieves steering in a shorter time than required by a full-order controller. The reduced-order controller assumes that the optimal heating setting lies in a subspace spanned by the best heating vectors (virtual sources) of an initial, approximate, patient model. An initial, approximate, reduced-order model is iteratively updated by the controller, using feedback thermal images, until convergence of the heat focus to the tumor. Numerical tests were conducted in a patient model with a right lower leg sarcoma, heated in a 10-antenna cylindrical mini-annual phased array applicator operating at 150 MHz. A half-Gaussian model was used to simulate temperature-dependent perfusion. Simulated magnetic resonance temperature images were used as feedback at each iteration step. Robustness was validated for the controller, starting from four approximate initial models: (1) a ‘standard’ constant perfusion lower leg model (‘standard’ implies a model that exactly models the patient with the exception that perfusion is considered constant, i.e., not temperature dependent), (2) a model with electrical and thermal tissue properties varied from 50% higher to 50% lower than the standard model, (3) a simplified constant perfusion pure-muscle lower leg model with ±50% deviated properties and (4) a standard model with the tumor position in the leg shifted by 1.5 cm. Convergence to the desired focus of heating in the tumor was achieved for all four simulated models. The controller accomplished satisfactory therapeutic outcomes: ∼80% of the tumor was heated to temperatures ⩾43 °C and ∼93% was maintained at temperatures <41 °C. Compared to the controller without model reduction, a ∼9–25 fold reduction in convergence time was accomplished using approximately 2–3 orthonormal virtual sources. In the situations tested, the controller was robust to the presence of temperature-dependent perfusion. The results of this work can help to lay the foundation for real-time thermal control of multi-antenna hyperthermia systems in clinical situations where perfusion can change rapidly with temperature.
1. Introduction
Recent advances in magnetic resonance thermal imaging (MRTI) have potentially made it possible to guide the heating focus toward the tumor in real time, during thermal therapy treatments. However, blood perfusion changes with temperature (Song et al 1984, Sekins et al 1984, Roemer et al 1985, Akyurekli et al 1997), possibly confounding thermal focusing. Nonlinear temperature dependence of the primary cooling effect of blood perfusion adds complexity to the design of a controller that focuses power in the tumor. A controller designed for constant perfusion may not necessarily work efficiently in the variable perfusion case. Another problem in real-time hyperthermia adaptive controller design is that the time expenditure required for convergence to the focus is approximately proportional to the square of the number of antennas (Cheng et al 2007, Weihrauch et al 2007). The time expenditure could be clinically infeasible, especially for systems with a large number of antennas.
Issues dealing with the long convergence time of tumor power focusing have been addressed in the past. Weihrauch et al (2007) proposed a reduced-order controller that neglects all blood perfusion and thermal conduction. Kohler et al (2001) proposed a quasi-steady state temperature controller for the case of constant blood perfusion. Kowalski and Jin (2003) incorporated a proportional-integral (PI) feedback power controller based on an index temperature of T90 (Oleson et al 1993) to control power focus when perfusion is a function of time or temperature. However, controllers by Kohler et al (2001) and Kowalski and Jin (2003) still required M2 (M = the number of antennas) steps for model identification. Recently, Cheng et al (2007) have developed a controller using a minimum-norm least-squares error (MNLSE) feedback-focusing algorithm. This algorithm was numerically validated in a detailed human patient upper-leg model built from a set of computerized tomography (CT) images. However, only constant perfusion was handled. Later, Cheng et al (2008a) developed a ‘virtual source’ (VS) model reduction method that was tested for steady state temperature optimization with constant or nonlinearly varying perfusion. That work did not incorporate feedback control. It was also numerically validated in a human patient upper-leg model.
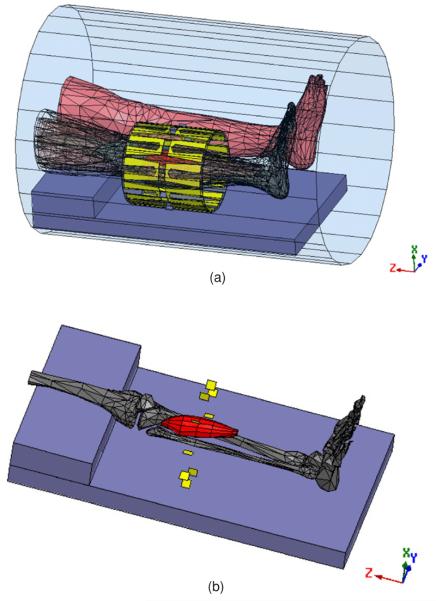
The current work addresses the following questions. (1) Is it feasible to steer the heat focus to the tumor in the presence of temperature-dependent perfusion by combining our recent feedback-focusing algorithm (Cheng et al 2007) with VS model reduction (Cheng et al 2008a)? (2) How well can the proposed controller steer focus back to the desired tumor position when the initial focal position is incorrect? (3) How does the simulated blood perfusion in tumor and healthy tissue regions change during a controlled hyperthermic treatment? (4) How close is the final optimal heating vector of the iterative focusing process for a nonlinearly temperature-dependent perfusion case to that of a treatment with constant, temperature-independent perfusion? We numerically investigated the above-mentioned questions by simulating a treatment on a human right lower leg sarcoma heated in a 10-antenna phased array applicator driven at 150 MHz (figure 1), with simulated magnetic resonance thermal images (MRTI) as feedback to steer the heat focus. The controller was started from an initial approximated model of the patient. To test the robustness of the controller, the initial model included errors in the tissue electrical and thermal properties, patient model simplification, tumor localization uncertainty and noise in the MRTI.
Figure 1.
(a) Electromagnetic mesh model of the patient, generated from a CT scan, shown within the 10-antenna cylindrical array. The whole system is situated inside the MRI bore. The tumor is shown in red. The antennas are evenly separated by 36° around a cylindrical surface of diameter = 23 cm and length = 24 cm. (b) The tumor, shown with respect to the bones of the heated leg. The tumor size is 18 cm × 5.651 cm (volume = 38.59 3). The yellow plates denote electric feeds, located in the center of each individual H-shaped antenna.
2. Methods
2.1. Nonlinear temperature dependence of blood perfusion
In order to design an adaptive controller for hyperthermia treatments with nonlinear perfusion, we need to relate the temperature response to the control variables—phases and magnitudes of antennas. While the exact equations describing the temperature–perfusion dynamics remain an open research problem, incorporating the Pennes bio-heat transfer equations (Pennes 1948) with some empirically curve-fitted perfusion relations is frequently used to approximate temperature response to nonlinear temperature-dependent perfusion:
| (1) |
One such fitted perfusion model was developed previously (Tompkins et al 1994, Lang et al 1999) using half-Gaussian curves to fit Song's experimental results (Song et al 1984, Song 1984). Blood vessels dilate to dissipate excessive heat, and therefore perfusion increases as temperature elevates. This increase of perfusion is rapidly saturated as temperature elevation exceeds a critical temperature (Song 1984). The following nonlinear curves were used here to approximate this phenomenon (Lang et al 1999, Kowalski and Jin 2003, Cheng et al 2008a, 2008b):
| (2) |
Temperature–perfusion dynamics described by this fitted half-Gaussian model are as follows (figure 2). Perfusion remains at its constant basal level (wtissue,1) but rapidly increases with elevated temperature once the temperature exceeds a threshold (Tcrit,tissue). Parameter s (saturation parameter) controls the rate of this increase and parameter wtissue,2 controls the amount of increase. This rapid increase from the basal level to a steady (higher) constant level attempts to mimic the physiological thermoregulation response of vessel dilation to increasing temperature (wtissue,1 + wtissue,2 corresponds to the maximum dilation).
Figure 2.
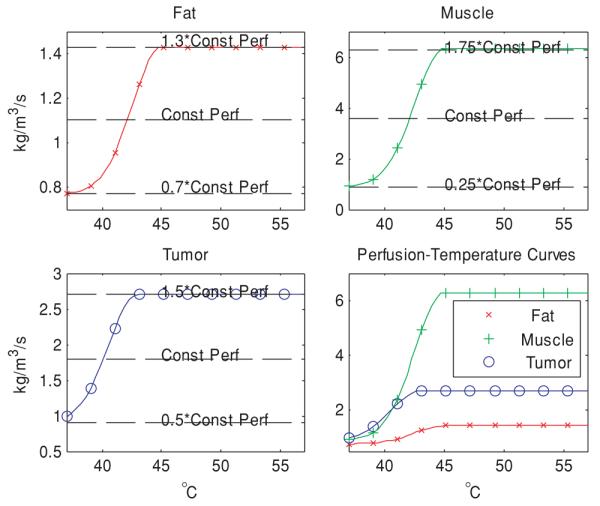
Curves modeling the perfusion–temperature relationship in fat, muscle and tumor, attempting to mimic the trend observed in Song's experimental data. In developing these functions, we assumed that perfusion increases with temperature in all tissues, ranging from 30% below to 30% above the constant perfusion value of fat, ±75% for muscle and ±50% for tumor (see table 1).
2.2. Image-guided reduced-order virtual source feedback controller
2.2.1. Constant perfusion
We assume that the patient is heated by multiple, independent electromagnetic (EM) wave sources obeying linear wave theory with negligible mutual coupling between sources (Balanis 1989). The resultant electric field is the sum of the individual electric fields emitted by each of the EM wave sources:
| (3) |
where M is the number of antennas, E⃗i is the electric field from antenna i and each component of the vector u⃗, ui, is the ith (complex) antenna setting. The tissue-absorbed power distribution of this resultant electric field is expressed in the Hermitian form (Boag and Leviatan 1988)as
| (4) |
where the superscript H denotes complex conjugate transpose.
Since the absorbed power is a Hermitian function of antenna settings (Boag and Leviatan 1988), we can also formulate the associated temperature elevation in a Hermitian form, provided perfusion is a constant, i.e., temperature-independent (Cheng et al 2007) as
| (5) |
where i, j and k are node indices along the x-, y- and z-direction and the vector r⃗i,j,k denotes the spatial position (xi, yj, zk). The vector u⃗ is the driving vector (each entry in the vector is the complex source setting A · exp(−j · φ), where A is the source magnitude and φ is its phase). The system matrix (S) is a function of variables such as the position of the patient relative to the surrounding applicator, the position of the tumor within the patient, the values of physiological parameters such as blood perfusion and tissue density, electrical parameters such as permittivity and conductivity and thermal parameters such as the thermal conductivity, specific heat and time expenditure of heating at each session. The system matrix (or transfer function) may be identified from several iterations, which excite the heated object using different inputs to obtain responses in the form of, for example, MRTI responses to variable power inputs (Das et al 1999). Once the system matrix is identified, it can be used to predict the system response to arbitrary antenna settings using equation (5).
2.2.2. Virtual source model reduction with piecewise perfusion linearization
The full-order controller based on equation (5) is suitable for heat focusing in the absence of nonlinear, temperature-dependent perfusion; however, for the case of temperature-dependent perfusion, perfusion values in each short control interval (iteration) can be very different, and hence the assumption that perfusion is piecewise constant within each iteration (Cheng et al 2008b):
| (6) |
Since the system matrices are synthesized from the temperature distributions at different iterations, the result incorporates the effect of a mixture of perfusions, potentially leading to instabilities. Additionally, system identification still requires M2 model-identification steps, which can be very time consuming in large antenna systems where each identification (iteration) step takes on the order of 3 min (Kowalski and Jin 2003, Cheng et al 2007, 2008b, Weihrauch et al 2007). The rationale behind model reduction is that, by conducting the iterative corrections in a smaller subspace that potentially contains the true optimal heating vector, we expect faster convergence in steering heat to the desired tumor position. We used a ‘virtual source’ (VS) reduced-order methodology (Cheng et al 2008a), where each orthonormal VS vector represents a normalized weighted combination of all (M) antenna magnitudes and phases. In this smaller subspace, temperature elevation during a heat-up period is approximated by the following equation:
| (7) |
where [Si,j,k]piecewise linear are the linearized pointwise Hermitian system matrices and matrix X (size M × N, N < M) represents the reduced N-dimensional subspace. The columns of X correspond to the orthonormal virtual sources. Vector c⃗ is the N × 1 coefficient vector that combines the orthonormal virtual sources to give the driving vector. The columns of the matrix X are determined as those first few eigenvectors of the algebraically averaged tumor matrix given below (Cheng et al 2008b):
| (8) |
Each column vector of X denotes a unit-norm driving vector that elevates the algebraically averaged tumor temperature in order of decreasing efficacy. This model reduction scheme, in theory, allows the number of iterations for convergence to be reduced from ∼M2 to ∼N2.
2.2.3. Details of the nonlinear image-guided reduced-order VS feedback controller
First, the initial patient model is established using computerized tomography (CT) or magnetic resonance thermal images (MRTI) to define the geometry and baseline temperature. Second, orthonormal VS vectors are determined to maximize the averaged tumor temperature in the initial linearized imperfect model (equation (8)). Third, the first few orthonormal VS vectors are chosen to construct a reduced N-dimensional VS subspace. Fourth, the first eigenvector of this reduced patient model is used to heat the patient. Fifth, we acquire temperature images (e.g., MRTI) to update the patient model (Cheng et al 2007). Sixth, a temporal power controller is applied to adjust the power magnitude so that the tumor is heated more efficiently while minimizing power delivered to surrounding normal tissues. Steps 4–6 are repeated until the (reduced) full system is identified, theoretically in N2 steps. Due to some associated errors/perturbations (see section 4), and since this is a linear approximation to a nonlinear system, more than N2 steps may be required. Each iteration session consists of a 1 min heat-up period, followed by a 2 min cool-down period, based on clinical experience (Das et al 2001).
2.3. Numerical simulation set-up
The feasibility of the proposed VS-based reduced-order adaptive controller was validated in a set of numerical simulations for a patient with a right lower-leg sarcoma. The patient treatment was simulated for heating in a 10-antenna annular phased array applicator, derived from the design of the 4-antenna mini-annular phased array (MAPA) applicator used in clinical treatments at Duke University (Zhang et al 1993) (figure 1(a)). This simulated applicator consists of 20 copper foil strip dipole antennas connected in 10 parallel dipole pairs and printed on the inner surface of a 23 cm diameter cylindrical plastic shell. Each dipole antenna pair forms one channel fed by a separate amplifier and phase shifter. The antennas are coupled to the patient leg by filling the water bolus space around the leg with distilled water at 37 °C. The right lower leg is placed in the center of the cylindrical applicator with the tumor, as shown in figures 1(a) and (b). The General Electric 1.5 Tesla Signa Excite MR System (General Electric Company, New York, USA) environment was numerically simulated with both legs of the patient and the applicator inside the 60 cm core of the MR magnet. This simulated the clinical situation more accurately since there are EM wave interactions between the two legs, applicator and the 60 cm diameter bore. The outer surface of the bore was assigned as a perfect electric conductor, and its two open ends, along with the air contained inside, were assigned as radiation boundary conditions.
A numerical patient mesh was built from CT images and was then imported together with numerical meshes of the antenna–applicator and MR bore into the EM simulator-HFSS (Ansoft Corporation, Pittsburgh, PA, USA). The 10 antennas were simulated to be driven with coherent signals at 150 MHz (Zhang et al 1993). The EM power deposition patterns were used as a source term for an in-house finite difference (FD) temperature solver, using a constant uniform temperature of 37 °C for the initial and boundary condition. The property values were taken from the literature (Gabriel et al 1996a, 1996b, 1996c, Hayt and Buck 2006, Van Den Berg et al 2006) and are summarized in table 1.
Table 1.
Nominal property values (assumed for 150 MHz).
| Relative electric permittivity, εR, |
Electrical conductivity, σ (S m−1) |
Density, ρ (kg m−3) |
Specific heat, Ct (J kg−1 K−1) |
Thermal conductivity, k (W m−1 °C−1) |
Blood perfusion, wb (kg m−3 s−1) |
|
|---|---|---|---|---|---|---|
| Blood | – | – | – | 3770 | – | – |
| Bone cortical | 14.4 | 0.07 | 1700 | 1300 | 2.3 | 0.0 |
| Bone marrow | 6.1 | 0.024 | 1700 | 1300 | 0.58 | 0.01 |
| Fat | 5.8 | 0.037 | 900 | 2987 | 0.33 | 1.1 |
| Muscle | 62.2 | 0.727 | 1050 | 3639 | 0.50 | 3.6 |
| Tumor | 68 | 0.9 | 1050 | 3639 | 0.50 | 1.8 |
| Water | 78 | 0.002 | 996 | 4178 | 0.61 | – |
Permittivity of a vacuum, ε0 = 8.854 χ 10 −12 F m −1 and permiability of a vacuum, μ0 = 4 × π × 10 −7 H m −1. The permeabilities of all tissues were assumed to be equal to that of the vacuum.
Table 2 summarizes the parameters for the variable temperature–perfusion model.
Table 2.
Parameter values for variable perfusion models.
| w1 (kg m−3 s−1) | w2 (kg m−3 s−1) | Tcrit (°C) | s (°C)2 | |
|---|---|---|---|---|
| Fat | 0.77 | 0.66 | 45 | 12 |
| Muscle | 0.90 | 5.40 | 45 | 12 |
| Tumor | 0.90 | 1.80 | 43 | 12 |
2.4. Simulated practical perturbations
We investigated a set of practical perturbations to the standard patient condition to validate the robustness of the controller. Such perturbations include tumor positioning uncertainty, patient property variability, patient model mismatch and MRTI measurement uncertainty.
2.4.1. Tumor positioning uncertainty
We tested robustness to uncertainties in tumor positioning within the (right) leg. The tumor position was varied by 1.5 cm in the direction toward the other (left) leg.
2.4.2. Patient property discrepancy
We tested robustness to the discrepancy of electrical and thermal property values between the actual patient and the initial patient model, including blood perfusion, which can vary significantly between patients and sites (Gabriel et al 1996a, 1996b, 1996c). The initial model was assumed to be deviated from the actual patient by the percentages shown in table 3.
Table 3.
Property deviations for lower leg tissues.
| Relative electric permittivity, εR, |
Electrical conductivity, σ (S m−1) |
Density, ρ (kg m−1) |
Specific heat, Ct (J kg−1 K−1) |
Thermal conductivity, k (W m−1 °C−1) |
Blood perfusion, wb (kg m−1 s−1) |
|
|---|---|---|---|---|---|---|
| Blood | – | – | – | +50% | – | – |
| Bone cortical | +50% | −50% | −50% | +50% | +50% | +0.0% |
| Bone marrow | +50% | +50% | −50% | −50% | −50% | +50% |
| Fat | +50% | −50% | +50% | −50% | −50% | +50% |
| Muscle | −50% | −50% | −50% | +50% | +50% | −50% |
| Tumor | −50% | +50% | +50% | −50% | −50% | +50% |
2.4.3. Patient model simplification
Building a detailed numerical patient model is time consuming and thus motivates the use of a simplified or approximated initial patient model, which can then be corrected using real-time feedback. Here, we have studied a simplified model that preserves the exact leg and tumor geometry, but assumes that the entire leg is homogeneous muscle, except the tumor (Cheng et al 2007). Tumor properties are the same as those in the standard model.
2.4.4. Magnetic resonance thermal imaging (MRTI) measurement uncertainty
MRTI potentially provides real-time three-dimensional temperature feedback to guide beam steering. However, MRTI comes with unavoidable measurement noise, e.g., additive Gaussian white noise. We have estimated a noise standard deviation of 0.3 °C from previous phantom experiments (Cheng et al 2008a). In this work, we imposed a more stringent standard deviation of 1.0 °C to test controller robustness.
2.5. Feasibility studies
In brief, we conducted the following numerical simulation studies on a patient with a lower-leg sarcoma. We start with an initial constant perfusion model (values as in table 1, with property deviations as in table 3) and steer heat focusing according to the algorithm in section 2.4. During the course of steering, temperature rise induces an increase in the perfusion according to equation (2). The reduced-order approximate initial patient model was reconstructed within the reduced subspace spanned by the first 2–5 orthonormal VS vectors of model 1 (the standard constant perfusion lower leg model (perfusion values are given in table 1) (with the only assumption of constant perfusion)), model 2 (the standard model with ±50% deviations in electrical/thermal properties (as in table 3)), model 3 (the simplified constant perfusion pure-muscle lower leg model with electrical and thermal tissue properties that are 50% deviated (as in table 3) and model 4 (the standard model with tumor position shifted by 1.5 cm toward the left leg). We repeated the same simulation configurations for the case where blood perfusion remained constant, i.e., temperature independent. We tested both the maximum and minimum eigenvectors of the initial patient models established by the first 2–5 orthonormal VS vectors to assess the robustness of the algorithm to favorable/unfavorable starting points. Since the perfusion value used in the initial model prior to iterative controller adjustments could influence convergence, we used two other starting points for perfusion: the maximum perfusion (wtissue,1 + wtissue,2 in table 2, figure 2) and the minimum perfusion (wtissue,1 in table 2, figure 2). In the future, unless otherwise qualified, the initial perfusion refers to a constant average perfusion value from table 1.
3. Results
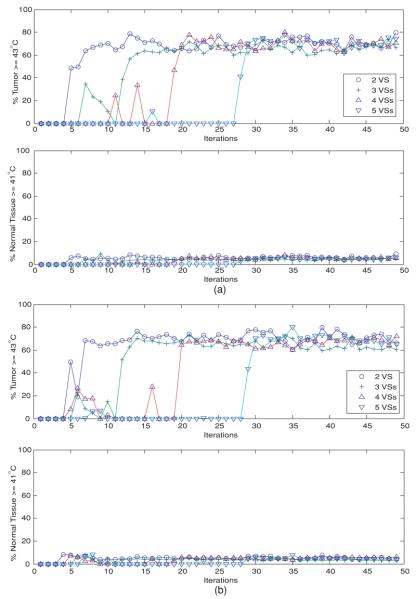
Quantitative treatment outcomes are illustrated in figure 3 with two metrics: the percentage of tumor volume therapeutically heated at ⩾43 °C and the percentage of normal tissue volume detrimentally heated at ⩾41 °C. In determining the detrimentally heated normal tissue volume, tissue in a 1 cm margin around the target tumor was not considered in the normal tissue volume as increasing temperature approaching 43 °C is expected in this tumor margin transition region. Figure 3(a) shows the results when the initial heating vector was the minimum eigenvector of the linear reduced models spanned by the first 2–5 orthonormal VS basis vectors of model 3: deviated pure muscle. Figure 3(a) appears to indicate satisfactory treatment parameters after convergence of the heat focus (tumor volume: ∼75–80% ⩾ 43 °C and normal volume: ∼90% < 41 °C) for model 3. Similar results were observed in other erroneous linear initial models (models 1 and 2) (not shown), except the case involving tumor position shift, model 4 (see figure 3(b).) In contrast, figure 3(b) shows that for nonlinear perfusion after ∼N2 iteration steps there was a substantial increase and then stabilization of the percentages of adequately heated tumor (∼60–78% ⩾ 43 °C) and healthy tissue (∼90% < 41 °C) when the initial model involved tumor position dislocation, model 4, which is a worse result than the other cases. There were different intermediate oscillatory behaviors before the N2th step when different numbers of orthonormal VS vectors were used to construct the reduced subspace for the approximate linear model, and/or when different initial patient models were used.
Figure 3.
(a) Temperature-dependent perfusion: the percentages of heated tumor volume (T ⩾ 43 °C) and normal tissues (T ⩾ 41 °C), when the initial driving vector is the minimum eigenvector of the linear model constructed from the reduced subspaces spanned by the first 2–5 orthonormal virtual sources of model 3: the deviated pure-muscle lower leg models with constant perfusions. Note that the computed temperature distribution uses the standard model with temperature-dependent perfusion. (b) Temperature-dependent perfusion: the percentages of heated tumor volume (T ⩾ 43 °C) and normal tissues (T ⩾ 41 °C), when the initial driving vector is the minimum eigenvector of the linear model constructed from the reduced subspaces spanned by the first 2–5 orthonormal virtual sources of model 4: the shifted-tumor-position models with constant perfusions. Note that the computed temperature distribution uses the standard model with temperature-dependent perfusion.
To visualize how the power focus is steered back to the tumor position, figure 4 displays the temperature distributions of selected slices at selected iteration steps, when the first heating vector was the minimum eigenvector of model 4: the initial shifted-tumor-position model. Another perspective is given in figure 5 to visualize how the controller adjusted the heating vector at each iteration step. Figure 5(a) plots the dot product between the heating vector at each iteration step to the maximum eigenvector of model 1: the standard model (with constant perfusion), when the first heating vector is the minimum eigenvector of model 3: the deviated pure-muscle initial model. The heating vector converged to a steady state vector that is very close to the theoretical optimal vector of the constant-perfusion standard lower leg model in only ∼N2 iteration steps, when N orthonormal VS vectors were used to span the reduced subspace. The perfusion values in the initial model were the minimum, average and maximum values in figure 2. This figure shows that the different perfusion levels used in the initial model seem only to affect the starting and intermediate iterations, but have no effect on the final (converged) steady state. Similar results are shown in figure 5(b) when the initial erroneous model involves tumor position dislocation, i.e., model 4. However, unlike those in model 3 (deviated pure muscle case), the dot product of the average perfusion is the lowest when the initial model involves tumor position dislocation.
Figure 4.
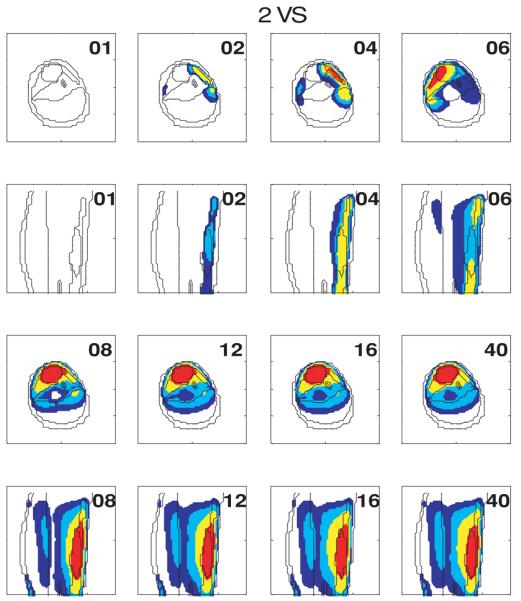
Evolution of temperature distributions at selected slices at different iterations when the first heating vector is the minimum eigenvector of the initial model 4 (the shifted-tumor-position model).
Figure 5.
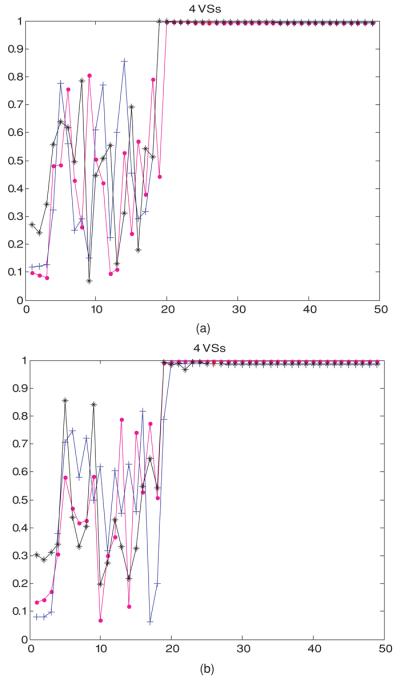
(a) Temperature-dependent perfusion: the dot product at each feedback iteration step between the heating vectors of model 3: the deviated pure-muscle initial model to the maximum eigenvector of model 1 (the standard linear model). The first heating vector was the minimum eigenvector of the approximate linear deviated pure-muscle reduced-order model constructed from four orthonormal virtual sources with constant perfusion, corresponding to the minimum (wtissue,1 in table 2, denoted by a magenta dot: •), average (wb in table 1, denoted by a blue cross: +) and maximum (wtissue,1 + wtissue,2 in table 2, denoted by a black star: ✩) values in figure 2. (b) Temperature-dependent perfusion: the dot product at each feedback iteration step between the heating vectors of model 4: the shifted-tumor-position initial model to the maximum eigenvector of model 1 (the standard linear model). The first heating vector was the minimum eigenvector of the approximate linear deviated pure-muscle reduced-order model constructed from four orthonormal virtual sources with constant perfusion, corresponding to the minimum (wtissue,1 in table 2, denoted by a magenta dot: •), average (wb in table 1, denoted by a blue cross: +) and maximum (wtissue,1 + wtissue,2 in table 2, denoted by a black star: ✩) values in figure 2.
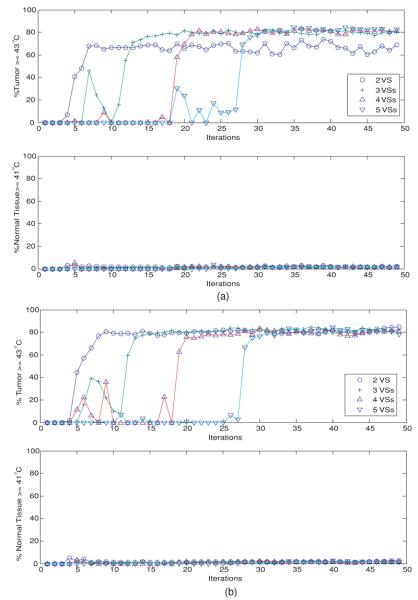
In the case of constant perfusion, figure 6 shows the percentages of the heated tumor and healthy tissues as a function of iterations, when the first 2, 3, 4 or 5 orthonormal VS vectors were used to construct the reduced VS subspace for the controller. Figure 6(a) is for the case where the first heating vector is the minimum eigenvector of the constant-perfusion deviated homogeneous-muscle lower leg model, model 3, and figure 6(b) for model 4: the shifted-tumor-position model. As in the nonlinear case (figure 3), after an intermediate oscillatory period, there was a sharp increase in the percentages of the heated tumor and healthy tissues, followed by a steady state (∼80% tumor ⩾43 °C and ∼95% healthy tissue <41 °C.) However, greater percentages of healthy tissue volumes were heated when perfusion varies with temperature (figure 3 versus figure 4).
Figure 6.
(a) Constant perfusion: the percentages of heated tumor volume (T ⩾ 43 °C) and normal tissues (T ⩾ 41 °C), when the initial driving vector is the minimum eigenvector of the reduced subspaces spanned by the first 2–5 orthonormal virtual sources of model 3: the deviated pure-muscle model with constant perfusion value. (b) Constant perfusion: the percentages of heated tumor volume (T ⩾ 43 °C) and normal tissues (T ⩾ 41 °C), when the initial driving vector is the minimum eigenvector of the reduced subspaces spanned by the first 2–5 orthonormal virtual sources of model 4: the shifted-tumor-position model with constant perfusion value.
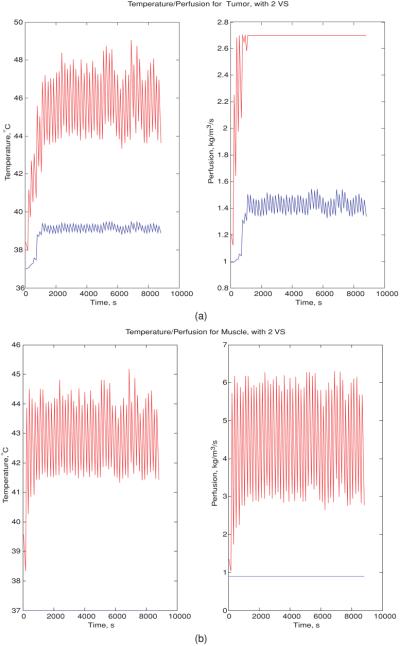
Figure 7(a) shows the variation in the maximum/minimum temperature/perfusion in the tumor as a function of time, during the course of feedback iterations. The first heating vector was the minimum eigenvector of the model constructed from the first two orthonormal VS vectors of the constant perfusion-shifted tumor-position initial model, i.e., model 4. The tumor maximum/minimum temperatures oscillated between ∼44 and 48 °C/39 °C when the system was close to fully identified. The tumor maximum/minimum perfusion also displayed a sharp increase after a time delay, followed by a rapid oscillatory behavior, varying between 1.4 and 2.7 kg m−3 s−1. According to figure 7(b), the muscle maximum temperature oscillated between ∼41.5 and 44.5 °C; the corresponding maximum perfusion increased to an oscillatory steady state (between ∼3 and 6 kg m−3 s−1) in a short time. The minimum temperature/perfusion in muscle remained at the unheated state.
Figure 7.
(a) Variation in the maximum (red)/minimum (blue) temperature/perfusion in the tumor at each feedback iteration step, when the initial driving vector is the minimum eigenvector of the model constructed from the reduced subspace spanned by the first two orthonormal virtual sources of the constant-perfusion shifted-tumor-position model: model 4. (b) Variation in the maximum (red)/minimum (blue) temperature/perfusion in muscle at each feedback iteration step, when the initial driving vector is the minimum eigenvector of the linear model constructed by the reduced subspaces spanned by the first two orthonormal virtual sources of the constant-perfusion shifted-tumor-position model, model 4.
4. Discussion
The current investigation addresses the unsolved issues of our previous studies (Cheng et al 2007, 2008b): can we speed up the pretreatment model identification using the piecewise linear VS model reduction for hyperthermia with nonlinear perfusion, can we further incorporate this approach with the use of patient model simplification and can we resteer power focus back to the tumor position from an erroneous starting point? The proposed controller effectively focuses heating despite several inaccuracies in the model (figures 3-5). However, further improvement in power focusing is required in the presence of tumor location errors in the initial model, model 4 (figure 3(b)). Convergence was achieved for the cases where the initial models assumed minimum, average and maximum blood perfusion values. Convergence was also achieved whether the initial driving vector was the minimum or maximum eigenvector of the erroneous reduced-order model. It appears that the most critical issue in confounding the success of heat focus control is accurate tumor positioning. Detailed patient-specific initial models involving accurate electrical and thermal properties do not seem to be critical in the example tested here. This finding provides an empirical basis for simplifying and speeding up the pretreatment preparations for treating lower-leg sarcomas.
Beyond a certain number of iterations (∼N2), there was a sudden increase in the heated tumor volume, indicating that the system was more or less fully characterized at that point. This implies that the perfusion approximation made by the controller, i.e., that the perfusion is constant at each iteration, does not appear to detract from controller convergence, as seen by contrasting figure 6 (constant perfusion case) to figure 3 (variable perfusion case.) Figure 6 shows the percentages of the heated tumor and normal tissue volumes, when tumor and healthy tissue blood perfusion in the initial model was the average of the maximum and minimum nonlinear perfusion oscillations. Whether the first heating vectors were chosen as the maximum or minimum eigenvector from the initial reduced-order patient model, the controller consistently steered and refocused power in the tumor in ∼N2 iteration steps (for N orthonormal VS vectors) to accomplish a treatment outcome of ∼80% of tumor heated at ⩾43 °C at the expense of ∼5–7% of normal tissue heated at ⩾41 °C. By comparing the treatment result for the case of constant perfusion (figure 6) to that for perfusion that varies nonlinearly with temperature as in figure 3, it appears that the numbers of iterations for convergence are similar. However, the nonlinear case heated slightly greater volumes of healthy tissue (∼10%), despite its ability to adapt to increased perfusion. This is most likely because more power is required to elevate tumor temperatures when tumor perfusion increases with temperature. Importantly, the controller, which assumes constant perfusion at each iteration step, appears to be robust to nonlinear temperature-dependent perfusion.
Figure 7 shows the simulation results of the variation in perfusion and temperature with treatment time, assuming the temperature-dependent perfusion varies as in equation (2). Beyond a certain temperature (table 2, figure 2), perfusion remains at a constant maximum level, which is what happens in most of the tumor toward the end of the iterative focusing procedure. This explains why the final converged treatment heat setting for the half-Gaussian perfusion is equivalent to that obtained from a constant perfusion model.
Lastly, a brief comparison to recent studies in the literature shows different levels of success in the real-time image-guided control of hyperthermia. By the pseudo-steady-state assumption, Kohler et al (2001) proposed a controller that systematically adjusts power magnitudes for a set of preoptimized steady state treatment plans having different hot spots at different locations in each time step under constant perfusion assumption. By taking an elliptical cylindrical inhomogeneous phantom involving fat, muscle and tumor, Kowalski and Jin (2003) validated their PI controller for the case involving time- and temperature-dependent perfusion. However, they still required the potentially time-consuming M2 full identification. By neglecting all but the absorbed power as the only driving term, Weihrauch et al (2007) proposed a faster algorithm that will converge, in theory, in 6✩M iterative corrections for a patient heated by an M-antenna applicator. Validated in an inhomogeneous phantom with zero blood perfusion, Weihrauch et al (2007) found that convergence could take as little as 1–2 steps. However, by neglecting both blood perfusion and thermal conduction, the algorithm is based purely on the specific absorption rate (SAR). In addition, our own work has shown fast convergence in certain constant perfusion cases (Cheng et al 2007). In general, the algorithm by Weihrauch et al remains a 6*M algorithm.
The controller proposed here uses an optimal goal that does not explicitly include constraints on normal tissues. Future work will address this issue.
5. Conclusions
In conclusion, a reduced-order controller was tested here and was shown to accomplish satisfactory therapeutic temperature distributions with ∼80% of tumor heated at ⩾43 °C and ∼93% of healthy tissue heated at <41 °C for temperature-dependent perfusion conditions, despite the controller assuming constant perfusion. The number of iterations for convergence is not compromised by this assumption. Accurate patient and tumor positioning appears to be the most critical issue in precisely focusing heat into a given tumor. For an improperly located initial tumor position, a model using approximately 2–3 orthonormal virtual sources appears sufficient to provide adequate heating, providing an approximately 9–25 fold reduction in the convergence time, compared to the controller without model reduction. The results of this work could help to lay the foundation for real-time optimization and thermal control of hyperthermia treatments with large multi-antenna array applicators under more realistic clinical conditions.
Acknowledgments
The authors would like to thank Ansoft Corporation (Pittsburgh, PA) for facilitating the use of HFSS finite element analysis software. The authors also thank Dr Cuiye Chen for consultations on blood perfusion. This work was supported by NIH grant NCI CA42745.
References
- Akyurekli D, et al. Changes in muscle blood flow distribution during hyperthermia. Int. J. Hyperth. 1997;13:481–96. doi: 10.3109/02656739709023547. [DOI] [PubMed] [Google Scholar]
- Balanis CA. Advanced Engineering Electromagnetics. Wiley; New York: 1989. [Google Scholar]
- Boag A, Leviatan Y. Optimal excitation of multiapplicator systems for deep regional hyperthermia; IEEE MTT-S Int. Microwave Symp. Dig.: Microwaves—Past, Present and Future; New York. 25–27 May 1988; Piscataway, NJ: IEEE; 1988. [DOI] [PubMed] [Google Scholar]
- Cheng K-S, et al. Online feedback focusing algorithm for hyperthermia cancer treatment. Int. J. Hyperth. 2007;23:1–16. doi: 10.1080/02656730701678877. [DOI] [PMC free article] [PubMed] [Google Scholar]
- Cheng K-S, et al. Fast temperature optimization of multi-source hyperthermia applicators with reduced order modeling of ‘virtual sources’. Phys. Med. Biol. 2008a;53:1619–35. doi: 10.1088/0031-9155/53/6/008. [DOI] [PMC free article] [PubMed] [Google Scholar]
- Cheng K-S, et al. Real-time feedback controller for multi-antenna phased array hyperthermia treatments with nonlinear perfusion; World Conf. on Interventional Oncology (WCIO); Los Angeles, CA. 2008b. [Google Scholar]
- Das SK, et al. Electromagnetic thermal therapy power optimization for multiple source applicators. Int. J. Hyperth. 1999;15:291–308. doi: 10.1080/026567399285666. [DOI] [PubMed] [Google Scholar]
- Das SK, et al. A method of MRI-based thermal modeling for a RF phased array. Int. J. Hyperth. 2001;17:465–82. doi: 10.1080/02656730110068320. [DOI] [PubMed] [Google Scholar]
- Gabriel C, et al. The dielectric properties of biological tissues: I. Literature survey. Phys. Med. Biol. 1996a;41:2231–49. doi: 10.1088/0031-9155/41/11/001. [DOI] [PubMed] [Google Scholar]
- Gabriel S, et al. The dielectric properties of biological tissues: II. Measurements in the frequency range 10 Hz to 20 GHz. Phys. Med. Biol. 1996b;41:2251–69. doi: 10.1088/0031-9155/41/11/002. [DOI] [PubMed] [Google Scholar]
- Gabriel S, et al. The dielectric properties of biological tissues: III. Parametric models for the dielectric spectrum of tissues. Phys. Med. Biol. 1996c;41:2271–93. doi: 10.1088/0031-9155/41/11/003. [DOI] [PubMed] [Google Scholar]
- Hayt WH, Jr, Buck JA. Engineering Electromagnetics. 7th edn McGraw-Hill; New York: 2006. [Google Scholar]
- Kohler T, et al. A fast algorithm to find optimal controls of multiantenna applicators in regional hyperthermia. Phys. Med. Biol. 2001;46:2503–14. doi: 10.1088/0031-9155/46/9/318. [DOI] [PubMed] [Google Scholar]
- Kowalski ME, Jin J-M. A temperature-based feedback control system for electromagnetic phased-array hyperthermia: theory and simulation. Phys. Med. Biol. 2003;48:633–51. doi: 10.1088/0031-9155/48/5/306. [DOI] [PubMed] [Google Scholar]
- Lang J, et al. Impact of nonlinear heat transfer on temperature control in regional hyperthermia. IEEE Trans. Biomed. Eng. 1999;46:1129–38. doi: 10.1109/10.784145. [DOI] [PubMed] [Google Scholar]
- Oleson JR, et al. Sensitivity of hyperthermia trial outcomes to temperature and time—implications for thermal goals of treatment. Int. J. Radiat. Oncol. Biol. Phys. 1993;25:289–97. doi: 10.1016/0360-3016(93)90351-u. [DOI] [PubMed] [Google Scholar]
- Pennes HH. Analysis of tissue and arterial blood temperatures in the resting human forearm. J. Appl. Physiol. 1948;1:93–122. doi: 10.1152/jappl.1948.1.2.93. [DOI] [PubMed] [Google Scholar]
- Roemer RB, et al. Oscillatory vasoactivity response to constant power. Am.J.Physiol. 1985;249:R153–8. doi: 10.1152/ajpregu.1985.249.2.R153. [DOI] [PubMed] [Google Scholar]
- Sekins KM, et al. Local muscle blood flow and temperature responses to 915 MHz diathermy as simultaneously measured and numerically predicted. Arch. Phys. Med. Rehabil. 1984;65:1–7. [PubMed] [Google Scholar]
- Song CW. Effect of local hyperthermia in blood flow and microenvironment: a review. Cancer Rev. 1984;44:4721s–30s. [PubMed] [Google Scholar]
- Song CW, et al. Implication of blood flow in hyperthermia treatment of tumors. IEEE Trans. Biomed. Eng. 1984;31:9–16. doi: 10.1109/TBME.1984.325364. [DOI] [PubMed] [Google Scholar]
- Tompkins DT, et al. Temperature-dependent versus constant rate blood perfusion modeling in ferromagnetic thermoseed hyperthermia. Int. J. Hyperth. 1994;10:517–36. doi: 10.3109/02656739409009355. [DOI] [PubMed] [Google Scholar]
- Van Den Berg CAT, et al. Towards patient specific thermal modelling of the prostate. Phys. Med. Biol. 2006;51:809–25. doi: 10.1088/0031-9155/51/4/004. [DOI] [PubMed] [Google Scholar]
- Weihrauch M, et al. Adaptation of antenna profiles for control of MR guided hyperthermia (HT) in a hybrid MR-HT system. Med. Phys. 2007;34:4717–25. doi: 10.1118/1.2804617. [DOI] [PubMed] [Google Scholar]
- Zhang Y, et al. Theoretical and measured electric field distributions within an annular phased array. Consideration of source antennas. IEEE Trans. Biomed. Eng. 1993;40:780–7. doi: 10.1109/10.238462. [DOI] [PubMed] [Google Scholar]


