

Abstract
Magnetic resonance (MR) imaging is promising for monitoring and guiding hyperthermia treatments. The goal of this work is to investigate the stability of an algorithm for online MR thermal image guided steering and focusing of heat into the target volume. The control platform comprised a four-antenna mini-annular phased array (MAPA) applicator operating at 140 MHz (used for extremity sarcoma heating) and a GE Signa Excite 1.5 T MR system, both of which were driven by a control workstation. MR proton resonance frequency shift images acquired during heating were used to iteratively update a model of the heated object, starting with an initial finite element computed model estimate. At each iterative step, the current model was used to compute a focusing vector, which was then used to drive the next iteration, until convergence. Perturbation of the driving vector was used to prevent the process from stalling away from the desired focus. Experimental validation of the performance of the automatic treatment platform was conducted with two cylindrical phantom studies, one homogeneous and one muscle equivalent with tumor tissue (conductivity 50% higher) inserted, with initial focal spots being intentionally rotated 90° and 50° away from the desired focus, mimicking initial setup errors in applicator rotation. The integrated MR-HT treatment platform steered the focus of heating into the desired target volume in two quite different phantom tissue loads which model expected patient treatment configurations. For the homogeneous phantom test where the target was intentionally offset by 90° rotation of the applicator, convergence to the proper phase focus in the target occurred after 16 iterations of the algorithm. For the more realistic test with a muscle equivalent phantom with tumor inserted with 50° applicator displacement, only two iterations were necessary to steer the focus into the tumor target. Convergence improved the heating efficacy (the ratio of integral temperature in the tumor to integral temperature in normal tissue) by up to six-fold, compared to the first iteration. The integrated MR-HT treatment algorithm successfully steered the focus of heating into the desired target volume for both the simple homogeneous and the more challenging muscle equivalent phantom with tumor insert models of human extremity sarcomas after 16 and 2 iterations, correspondingly. The adaptive method for MR thermal image guided focal steering shows promise when tested in phantom experiments on a four-antenna phased array applicator.
1. Introduction
When used as an adjuvant treatment with other established cancer treatment modalities such as radio and chemotherapies (Dewhirst et al 2005, Sneed et al 1998, Corry and Dewhirst 2005, van der Zee and van Rhoon 2006, Jones et al 2005), hyperthermia (40–45 °C for 30–60 min) has demonstrated favorable outcomes in numerous clinical studies. Hyperthermia has the potential for increasing tumor sensitivity to ionizing radiation by numerous mechanisms including increasing tumor oxygenation (Hall and Giaccia 2005), and for heat-targeted temperature-triggered drug delivery (Ponce et al 2006, Chen et al 2004, Ponce et al 2007). Realization of this potential is critically dependent on the ability of the treatment equipment to effectively focus heat in the tumor target while avoiding overheating of surrounding normal tissue. However, this has proven to be non-trivial, owing to the complex interactions of non-ionizing radiation within the patient anatomy, especially for multi-antenna electromagnetic (EM) hyperthermia systems (Stauffer 2008).
Computer modeling of the absorbed thermal dose distribution for patient-specific geometries is often used to predict the quality of the treatment, estimate patient-specific applicator efficacy and generate an optimal set of parameters for driving EM sources (Paulides et al 2005, 2007a). However, assumptions made in creating the model, such as lack of understanding of thermal physiological processes, lack of accurate knowledge of tissue EM and thermodynamic properties and the error in prescribing the EM sources (cross-talk between antennae, impedance matching network, etc), can result in treatment delivery that deviates significantly from the plan. Non-invasive magnetic resonance imaging (MRI) can potentially be used to monitor and adjust the temperature rise in the patient (MacFall et al 1995, Gellerman et al 2006a, 2006b, Wust et al 2006), thereby compensating for deficiencies in the model. In this work, we use proton resonance frequency shift MR images (MacFall et al 1996) to monitor temperature and adjust the initial model in real time, until convergence of the heat focus to the desired target location.
Several controllers of antenna input parameters (amplitude and phase) for optimal hyperthermia treatment have been discussed in the literature (Hutchinson et al 1998), with several involving true 3D volumetric analysis (Vanne and Hynynen 2003, Mougenot et al 2004). The theoretical framework for the automatic control algorithm presented here was built upon our earlier work (Das et al 1999a, 1999b) with phantom experiments (Das et al 2001). According to this theory, for an applicator with M independent coherent EM sources, M2 measurements are sufficient to fully characterize the heated object via a model, which can then be used to predict the thermal distribution from any arbitrary excitation configuration of the multiple antenna array. However, for applicators with a large number of antennas M, the process of system characterization may take significant time. Therefore, the current work is directed toward alternative adaptive approaches to accelerate the ‘learning’ process. A least-squares method for system optimization was discussed recently, with numerical studies of the effect of setup errors and blood perfusion on the convergence speed and treatment efficiency (Cheng et al 2008). To investigate the realistic performance of the algorithm, the simulated temperature response images included Gaussian noise typical for treatments of extremity sarcomas with simultaneous imaging with MRI body coil. Depending on the initial conditions, the convergence occurred after 20–25 iterations (in contrast to theoretically expected 16), owing to slow system recovery due to the noise. Another least-squares algorithm for steering the heat toward tumor was reported and experimentally validated on phantoms of pelvis recently (Weihrauch et al 2007). The authors outlined the approximation to reduce the dimensionality of the problem from M2 to 6M, making it attractive for control of applicators with a large number of antennas.
In this work, we present a modified adaptive algorithm based on the feedback from real-time magnetic resonance (MR) thermal imaging. To offset the detrimental effect of noise in thermal images, we introduce the concept of vector perturbation, where the algorithm constantly searches for a better input for the treatment in the vicinity of tumor. Two experimental tests, with homogeneous and homogeneous plus tumor insert phantoms, were conducted to evaluate the performance of the focal spot steering control system. Efficiency of convergence to a stable phase focus in the target was analyzed with respect to the amount of initial misalignment of the tumor target inside the applicator.
2. Methods and materials
2.1. Mathematical basis for the system analysis and feedback control of thermal focus
2.1.1. Background
The physical model for EM microwave heating can be separated into two parts: modeling of the EM field in tissue, and use of the resulting specific absorption rate (SAR) distribution as power input to the thermal modeling solution. As detailed in previous work (Das et al 2001), the EM field for arbitrary antenna inputs for an M-antenna system can be expressed as
| (1) |
where Ei and ui are the electric field vector and complex input for antenna i. The local power Psum deposited to the tissues due to EM losses can be expressed as
| (2) |
In the above equation, the subscript * denotes the complex conjugation, while the superscript H denotes the complex conjugate transpose; the computed M×M matrix [Φi,j] is Hermitian. Under the assumption of a linear heat transfer process, the resulting thermal distribution can also be expressed in the Hermitian form:
| (3) |
where the matrix Sx,y,z is a position-dependent M×M Hermitian matrix with positively defined eigenvalues λi ≥ 0, regardless of the exact form of the linear bio-heat transfer equation (zero boundary conditions are implied), the properties and geometry of the patient. The numerical values for the elements of the matrices Sx,y,z are based on the characteristics of the heated object and heating system—the patient's electrical and thermal properties, patient positioning in the applicator, load-dependent antenna forward and reflected power, antenna cross-coupling, antenna port output, etc. For example, estimates of these properties may be used to generate finite element (FE) models of the system. Thus, if the system is exactly known prior to heating, the antenna settings that the best heat tumor (without regard to normal tissue) may be computed as the maximum eigenvector of the summation of matrices Sx,y,z for all x, y, z ∈ tumor. While some properties of the system, e.g., amplifier calibration, impedance mismatch, antenna cross-coupling, could be measured prior to the treatment, others are more difficult to estimate. The actual values of the thermal and electrical characteristics of human tissues may vary significantly between patients (Goss et al 1978), across tissue types (Gabriel et al 1996c), and as a function of time during the treatment. Also, uncertainties associated with blood perfusion, which vary both spatially and temporally during the treatment (Song et al 1984, Cheng and Roemer 2005), further complicate the modeling process. All this implies that any initial estimate of Sx,y,z would need to be revised based on feedback measurements obtained during the course of heating.
2.1.2. Feedback control
The feedback control approach taken here is to start with a model based on some initial estimate of system properties. The model is then iteratively updated by comparing MR-measured thermal images to the expected thermal distributions, until convergence (see the flowchart in figure 1). Throughout the iterative process, the heat focus is progressively moved closer to the center of the desired target. This process is in contrast to our previous methodology (Das et al 2001), wherein the M2 elements of matrices Sx,y,z were computed from thermal images corresponding to M2 antenna settings that were largely different from each other. Consequently, these initial model identification settings did not provide useful tumor heating, which was focused in the tumor only after completion of all M2 initial model identification steps. Our current methodology attempts to provide useful heating during each iteration. A potential advantage of the current approach is faster convergence to focus (<M2 iterations) when the iterative updates are able to rapidly characterize the system, which occurs in most cases depending on how accurately the initial setup characterizes the actual tumor–applicator geometry.
Figure 1.

Block diagram for operation of the adaptive algorithm based on real-time MRI thermal images. Heat focusing in the tumor is achieved iteratively. At each step, the amplifiers are set to the current optimal values for a time period of 100 s, and two MR thermal images are acquired at the beginning and end of the time period. The difference between the thermal images is analyzed as the response to heating, the system data are updated, and the procedure iterates.
The feedback control approach is shown in figure 1. An initial model based on estimates of system properties, [Ŝx,y,z]0, is used to compute the optimal driving vector, v0, as the eigenvector corresponding to the highest eigenvalue of the summed matrices [Sx,y,z]0, for (x, y, z) ∈ tumor. The amplifiers are set to deliver the vector v0 for a time interval of 100 s, from which the system's point-wise thermal response to this input [Tx,y,z]0 is recorded by subtracting two thermal images at the beginning and end of the time interval. The thermal response measurement [Tx,y,z]0 is then used to update the system matrices to [Ŝx,y,z]1. This process is iteratively repeated, with the computed driving vector, vk, at iteration k, used to update the system matrices at the k+1st iteration as follows:
| (4) |
According to the complete set of linear equations (4), at each iteration (figure 1), the matrix is updated with the newly acquired thermal images [Tx,y,z]k only in the direction of the last input vector vk, and defaults to previous knowledge of the system in orthogonal directions vl, l = 1, … , 15, of the complex input vector space.
The update (4) is ill conditioned, since the optimal input vector v can stagnate at some point in the vector space far from the true optimal vector. Indeed, if vk+1 = vk, then [Ŝx,y,z]k+1 = [Ŝx,y,z]k.
To avoid this problem, at each iteration k, the computed optimal vector is intentionally perturbed by a small amount in a predefined direction, to incorporate some measure of orthogonality. For example, table 1 lists a set of perturbation vectors that can be added at every step in the iterative process for a four-antenna system. At each step j during the treatment, the delivered vector vdelivery is set as
| (5) |
Table 1.
The list of perturbation vectors to maximize robustness of the convergence algorithm. Each complex vector element vn provides the amplitude an and the phase φn for the amplifier output setting, vn = an eiφ.
| Setting number |
|||||||||||||||||
|---|---|---|---|---|---|---|---|---|---|---|---|---|---|---|---|---|---|
| 1 | 2 | 3 | 4 | 5 | 6 | 7 | 8 | 9 | 10 | 11 | 12 | 13 | 14 | 15 | 16 | ||
| Antenna | v1 | 1 | 0 | 0 | 0 | 1 | 1 | 1 | 0 | 0 | 0 | 1 | 1 | 1 | 0 | 0 | 0 |
| v2 | 0 | 1 | 0 | 0 | i | 0 | 0 | 1 | 1 | 0 | 1 | 0 | 0 | 1 | 1 | 0 | |
| v3 | 0 | 0 | 1 | 0 | 0 | i | 0 | i | 0 | 1 | 0 | 1 | 0 | 1 | 0 | 1 | |
| v4 | 0 | 0 | 0 | 1 | 0 | 0 | i | 0 | i | i | 0 | 0 | 1 | 0 | 1 | 1 | |
A weight coefficient of 30% in equation (5) was chosen as optimal for the quality of our typical thermal images based on numerical simulations and preliminary steering experiments. Note that the larger the value of this perturbation weight coefficient, the more it detracts from our goal of incrementally moving the heat focus toward the tumor. The image parameters used in our experiment were as follows: Tr = 34 ms, Te 20 ms, 30° flip angle, field of view of 30 cm, 128 × 128 acquisition matrix and acquisition time of 20 s. The observed image noise could be approximated by the Gaussian distribution (Cheng et al 2008) with half-width-half-max of about 0.2 °C. In contrast, the temperature raise of the heated spot during the heat interval of the treatment (100 s in this work) is of the order of 0.6–0.8 °C. While these numbers seem comparable, the noise does not destabilizes the convergence critically since the optimal vector is computed based on integral measure of thermal raise in tumor volume, or over the volume of the focal spot, and thus the noise contribution somewhat averages out.
2.2. Experimental platform
The mini-annular phased array (MAPA) heating device investigated in this study is one of a set of phased array heat applicators at the Duke University intended to treat extremity tumors. The applicator is a cylindrical Plexiglas shell of diameter 23 cm and length 27.5 cm, operating at 140 MHz. Four independently driven pairs of longitudinally oriented bow-tie dipole antennas, placed equidistantly around the inner surface of the cylinder, are driven by coaxial cable feedlines attached at the center of each dipole pair (see figure 2). The applicator design is similar to the commercially available BSD-2000 SIGMA 30 applicator (BSD Medical Corporation, Salt Lake City, UT). The extremity phantom is placed inside the cylinder and coupled to the antennas via a water-filled bolus. For thermal imaging and feedback control, the MAPA is integrated within the bore of a commercial MR imaging system (GE Signa Excite, Milwaukee, WI) which supplies proton resonance frequency shift (PRFS) thermal images in planes at approximately 1 min intervals during the course of a heat session.
Figure 2.
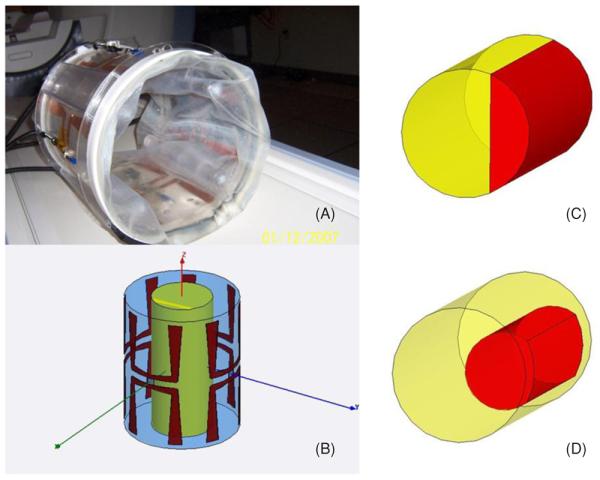
Four-antenna Duke applicator for treatment of extremity sarcomas (A) and Ansoft HFSS model (B). Inset (C) shows the target volume in right quadrant for experiment A while inset (D) shows cylindrical tumor volume used for optimization during experiment B.
The schematic diagram for the operation of the automatic clinical treatment unit is shown in figure 3. Briefly, the integrated platform comprises invasive optical thermal measurement probes, non-invasive MR thermal imaging, support electronics for the amplifiers feeding the microwave antennas, image processing and a decision-making box. A dual quad-core CPU workstation serves as the master controller to synchronize the operation of the MRI scanner and the operation of the amplifiers feeding the applicator. A DICOM query application running in the background ensures that the most recent thermal images of the phantom are uploaded to the image-processing server. The server sends the images to the controller, which uses them (in conjunction with measured antenna forward and reflected powers and phases) to update the system matrices Sx,y,z and set the next driving vector in the iterative process. The contents of the images (anatomical and thermal response to heating impulse, as well as total accumulated temperature increase during a session) are output to the terminal screen for visual observation. This allows a human operator to interrupt the feedback control process if she/he deems that the focus is visually located close enough to the desired location.
Figure 3.
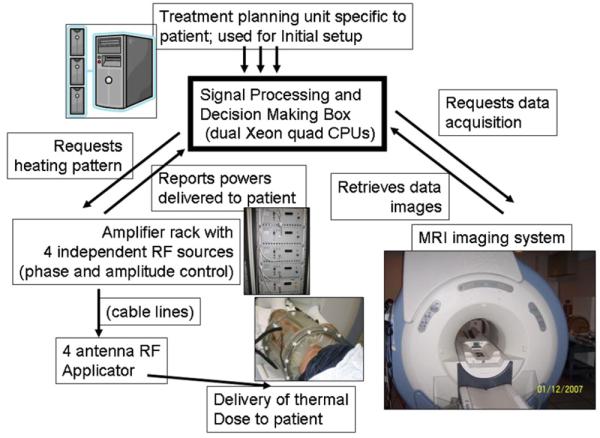
Schematic of the adaptive MRTI guided HT treatment system.
2.3. Experimental validation of the algorithm convergence performance
To test the performance of the automatic MRI-guided treatment platform we conducted two experiments. The experiments tested the ability of feedback control to steer the focus, starting with different initial models.
The first experiment, experiment A, was conducted on a homogeneous muscle equivalent phantom (diameter 13 cm, length 27 cm) with ‘tumor’ located in the right segment of the cylindrical phantom (figure 2(C)). The initial model was based on specific-absorption-rate (SAR) computations made with a commercial finite element simulation software program (HFSS, Ansoft Corp., Pittsburgh, PA) using the materials properties listed in table 3. Since the system matrices Sx,y,z are formulated to compute temperature, the initial model is approximated by scaling the power matrix, i.e., [Ŝx,y,z]0 = c · [Φi,j x,y,z], where c is an empirical proportionality coefficient to scale SAR values to average temperature values over the time of input setting evaluation. (The use of SAR only for treatment planning and the use of SAR tumor coverage as prognostic factors in clinical applications were discussed recently (Paulides et al 2007b)). As additional system uncertainty, the initial model system matrices were intentionally rotated to mimic a severe 90° clockwise misalignment of the MAPA from the originally expected antenna–target geometry.
Table 3.
EM model simulation: property values (all simulations are for 140 MHz excitation frequency). The values are adapted from (Gabriel et al 1996a, 1996b, 1996c, Hayt and Buck 2006).
| Tissues | Relative dielectric permittivity |
Electrical conductivity, Siemens m−1 |
Density, kg m−3 |
Specific heat, J kg−1 °C−1 |
Thermal conductivity, W m−1 °C−1 |
|---|---|---|---|---|---|
| Muscle | 60 | 0.50 | 1050 | 3639 | 0.50 |
| Tumor | 60 | 0.75 | 1050 | 3639 | 0.50 |
| Water | 81 | 0.0002 | 996 | 4178 | 0.61 |
| Air | 1.0006 | 0 | – | – | – |
The second experiment, experiment B, was conducted on a similar cylindrical phantom to that in experiment A, except for a designated off center tumor region (diameter 6 cm, length 18 cm) filled with gelatin having 50% higher conductivity than muscle, as shown in figure 2(D). The initial model for system matrices was computed from full thermal simulations for the 16 linear independent antenna excitations (ePhysics, Ansoft, Pittsburgh, PA), from which we extracted point-wise matrices [Sx,y,z] using material properties from table 3. Similar to experiment A, system matrices were rotated clockwise by 50° initially to challenge the iterative convergence.
The experimental conditions for the two tests are summarized in table 2.
Table 2.
Description of experimental conditions for the platform tests.
| Test # | Prior knowledge before the imaging |
MRI thermal imaging |
Test object | Applicator positioning |
|---|---|---|---|---|
| A | Scaled SAR calcs | 30 cm field size, 0.5 cm slice thickness, 20 s scan |
Cylindrical muscle equivalent phantom |
The applicator is shifted 90° clockwise to test convergence |
| B | Full thermal calcs | 30 cm field size, 0.5 cm slice thickness, 20 s scan |
Cylindrical muscle equivalent phantom with tumor volume |
The applicator is shifted 50° clockwise to test convergence |
3. Results
Figure 4 presents the iteration history of the running convergence algorithm to treat the right side of the leg (treatment volume is outlined in the inset of figure 2(C)). Only the central slice through the plane of four dipole feed-points is shown in this sequence, since the central plane has the highest capacity for heating and steering of the array focus. Since the applicator was intentionally misplaced during setup (90° rotation about the HT system axis), the first iteration heated tissue in the wrong location, accurately following the setup error. The heating tended toward greater coverage of the target by the third iteration, but the treatment settings were not yet optimal as evidenced by the partial focus on the left, away from the target. On several occasions, namely iterations 6, 11 and 14, the focal spot of heating moved away from the tumor, which would produce less efficient treatment. Nevertheless, the measured temperature map provides important information for accurate reconstruction of the point-wise system matrices [Ŝx,y,z]. However, upon completion of the adaptive part of the [Ŝx,y,z] reconstruction, the algorithm switched into a new phase, when the most recent 16 (M2 = 16) thermal images were used to solve for the system response matrices [Ŝx,y,z]. This phase demonstrates robust performance of automatic treatment, with treatment iterations 17–22 showing effective thermal coverage of tumor volume and sparing of normal tissues.
Figure 4.

Experiment A: iteration history of HT treatment of figure 2(C) treatment volume in the central transaxial slice as guided by the adaptive control algorithm. The applicator was intentionally misaligned by 90° initially to test the convergence.
Figure 5 plots the ‘similarity’ of the heating vector at every iteration to the simulated optimal heating vector as the dot product between these two vectors (most similar = 1, least similar = −1). The simulated heating vector assumes the thermal and electrical properties of the cylinder, assumes that amplifier inputs are exactly conveyed to the applicator (not true in practice, since connection lines and connectors usually distort the inputs), that there are no setup errors, no load-dependent reflections from the heated volume and assumes no antenna cross-talk (all of which are present to some degree in reality). The input vector deviated significantly from the theoretical optimal vector during the first 16 iterations of the operation, and stabilized at a value of 0.3 after sufficient system information had been collected (iterations 17–23). This low value, despite convergence to the focus, implies that the theoretical simulations are in error, likely due to the assumptions made in their calculation.
Figure 5.

Similarity of the experimental optimal vector to the optimal vector computed based on numerical modeling of the system. Open circles designate the intentionally perturbed driving vector fed to the antennas.
The performance of the automatic control algorithm in experiment B is plotted in figure 6. Similar to experiment A, the applicator was positioned with a 50° rotation error to challenge the convergence algorithm, which resulted in angular displacement of the focal spot initially. Adaptive feedback update of the system resulted in quick convergence—after the second iteration the target volume continuously received high heating (iteration 3–17). The evolution of the similarity of the input vector to the computed optimal vector is plotted in figure 7. Only minor changes of the similarity metric occurred over the course of the experiment, with an asymptotic approach to a stable focus with similarity to the optimal vector of 0.65 (again, suggesting that the theoretical simulation has some error). Figure 8 plots the iterative evolution of treatment efficacy in experiment B (F), where F is defined as the ratio of the integral temperature rise in the tumor target to the integral temperature rise in normal tissue during the iteration:
| (6) |
The treatment efficacy ratio increased from about 0.5 at the first iteration to 1.6 at the sixth iteration, thereafter increasing to 3.0 after ten iterations, a six-fold increase from the first iteration.
Figure 6.

Experiment B: iteration history of the HT treatment (see figure 2(D) for target volume). The applicator was intentionally misaligned by 50° to test the convergence. The outline of the phantom and target volume is shown on the central transaxial slice in the right lower corner of the figure.
Figure 7.

Similarity of the experimental optimal vector to the optimal vector computed based on numerical modeling of the system. Open circles designate the intentionally perturbed driving vector fed to the antennas.
Figure 8.

Experiment B: evolution of treatment efficacy. Treatment efficacy is defined as the ratio of integral temperature in tumor to integral temperature in normal tissues.
4. Discussion
The experimental tests of the automatic thermal image guided treatment system appear to suggest that focal spot steering can be achieved within several iterations of the algorithm. Some approximate prior knowledge of the system from two standpoints is important for creating the initial model. First, an initial prediction of the driving vector is a prerequisite for quick determination of the system. Indeed, the perturbation technique used to generate the driving vector (see equation (5)) gives the most advantage when used in the area close to the optimal vector (maximum tumor heating vector), effectively testing the response of tumor and neighboring normal tissue to small antenna variations. In the framework of linear equations (4), the differential in tissue response will be least affected by noise of thermal images under these conditions. In contrast, when the vector minimizing tumor heat is used as a starting point, the effect of small perturbations will show a minimal effect in the area of tumor, which will not be discernable from noise. As a result, the system thermal matrices in the targeted region will not be updated correctly. However, in the absence of image noise (or, alternatively, large perturbation amplitude), any arbitrary starting vector would lead to a convergence in not more than N2 = 16 iterations as equations (4) become fully determined (Das et al 2001, Kowalski et al 2002). The second major advantage of having a reliable initial prediction of the system is that the learning part of the treatment also has a beneficial effect throughout the iterative process, since the adaptive platform attempts to maximize tumor benefit at each iteration.
The slow convergence in example A is mostly due to a large setup error (90° rotation). Mathematically, for a symmetrical four-antenna applicator, such a rotation error is equivalent to a cyclical relabeling of all four amplifiers driving the applicator. Correspondingly, it takes almost a full learning cycle, 16 iterations, to recover the system's correct order. This analysis could be extended to applicators with an arbitrary number of antennas, n, positioned symmetrically around the axis. For such applicators, 2π/n rotation around the axis would be equivalent to cyclic relabeling of all the antennas. Therefore, it may be assumed that for treatment devices with a large number of antennas, even small errors in patient setup (2π/n→0 as n→∞) lead to significant disorder of the system. This is somewhat unfortunate, as antenna applicators with a larger number of antennas are capable of delivering more conformal therapy, especially in the higher frequency microwave range. However, the situation could possibly be rectified by certain corrective approaches. For example, a robust approach would be to start with a reduced-order model, where the adjacent antennas are paired, to effectively decrease the dimensionality of the applicator to n/2. Since the potential of such a paired-antenna applicator for conformal tumor heating could be diminished, a second step for optimization could be performed where parameters of relative amplitude/phase within pairs are varied. Such a two-step procedure would reduce the convergence process to n2/2 iterations at most (n2/4 per step). A more advanced alternative approach would be to use a smaller subset of patient-specific antennae settings, or virtual sources, which have greater potential for tumor heating (Cheng et al 2008).
For the test with only 50° rotation in HT applicator setup, convergence occurred after just two iterations. As the original optimization was based on initial system knowledge, the first optimal driving vector included a significant component along the direction of the true optimal vector (scalar dot product = 0.75, figure 7), and therefore the system response along this component critically updated the system matrices, rapidly converging to the true system response model. The measure of treatment efficacy, defined as the ratio of the integral temperature in tumor to integral temperature in normal tissues, increases during the evolution of the learning system, with a six-fold increase compared to the first iteration of the treatment obtained by iteration 11. Some fluctuations in efficacy (e.g., drop of the treatment efficacy to only a two-fold increase from the zeroth setting on iteration 15) can also be seen in figure 8. These deviations from the ‘optimal’ treatment occur due to intentional perturbation of the computed optimal vector. According to equation (5), in each iteration of the adaptive algorithm 30% of a predefined unit vector is ‘mixed’ into the current optimal vector (see figure 7) to gain thermal information about the system. This explanation is strongly favored by the following observation. If the optimization algorithm is converging to the correct system parameters, the maximum benefit to the patient will occur during those steps where the perturbed vector is closest to the optimal vector (or rather is in the same direction), as the scaling factor will not cause significant heat redistribution. Correspondingly, the vector dot product used as similarity metric in this work will have almost identical values. As shown in figure 8, the efficiency peaked on iterations 6, 11, 13 and 16 (with a gain of 3.5, 6, 3 and 6, respectively, compared to the initial point). The dot product curves for the current optimal vector and driving vector are almost overlapping for the same iterations 6, 11, 13 and 16 (see figure 7), therefore validating the convergence of the system.
Our earlier work on the investigation of the stability of the focusing algorithm for the treatment of extremity sarcoma (Cheng et al 2007) showed the susceptibility of the least-squares algorithm to the noise present in thermal images. The convergence speed was tested as a function of several clinical uncertainties, in positioning, tissue properties and also initial antenna driving vector. The introduction of the noise with the amplitude typical for our thermal imaging system delayed the convergence to 20–25 iterations, while complete identification of the system requires 16 steps in the absence of noise. The clinically realistic extremity shifts considered in the study (2 cm) were much smaller than 90° rotational offset tested in experiment A of this work, and therefore the relative performance is difficult to evaluate. However, our experiment B with a 50° setup error demonstrated that the convergence occurred in about six steps at most, about three times faster than in numerical study.
An interesting alternative for automatic steering of the heat to tumor was introduced recently (Weihrauch et al 2007). While explicitly neglecting the contribution of the diffusion and perfusion terms in the bio-heat model, the authors reduced the response model to 6M parameters of antenna SAR profiles at each voxel. This certainly presents an advantage for treatment applicators with a large number of antennas (>6). However, our M2 model seems more optimal for the considered four-antenna applicator. In addition, as noted by the authors, the slower performance of the algorithm after the first iteration could indicate the difficulty of the algorithm to correct for effects of thermal diffusion (not included in the model).
The performance of all three above-discussed algorithms for focus steering depends on the initial guess for the input vector, with faster convergence when the vector maximizing the tumor heating is chosen. However, our adaptive algorithm proposed in this work has an adjustment parameter, the weight of the perturbation which regulates this dependence. For large perturbations, the initial vector is not critical for convergence. However, in this case the treatment is not efficient even if convergence achieved (since the algorithm intentionally ‘misses’ the tumor). For a reasonable initial guess an idealized patient model could be used (Cheng et al 2007) or the path-length phase selection algorithm for control of the BSD-2000 system.
The question remains if one can decide when to reduce or turn off the perturbations to switch to the ‘therapeutical only’ phase of the treatment and diminish fluctuations of the focus. If the system parameters exhibit static behavior, then asymptotic character of the optimal vector similarity metric curve could be taken as a sign of convergence (see figure 7). A more rigorous analysis would require simultaneous on-line monitoring of the optimal and driving vectors, and the correlation of their differences with the variation of tumor heat benefit, a procedure, qualitatively outlined earlier in this section. In contrast, a sudden physiological change in the patient, or time variations in delivery system properties manifested in defocusing of the heat during the treatment would warrant an assignment of larger perturbation weight to regain the focus.
While it was shown that the system has potential for clinical hyperthermia treatment, some parameters of the system need to be improved. Further acceleration of the convergence time could be achieved if high-quality thermal images are obtained in a shorter period of time, and MR thermal imaging techniques under development show some promise (Vanne and Hynynen 2003, Mougenot et al 2004). Also, a cool-down period of 180 s used in the thermal acquisition sequence makes the convergence process too long for clinical application (∼28 min for six iterations). The cool-down interval can be feasibly reduced by using the exponential follow-off extrapolation technique to predict the full extent of expected temperature changes in patient voxels (Roemer 1990).
5. Conclusions
We have developed an integrated HT treatment system with the capability of automatically steering heating toward the tumor and dynamically improving the efficacy of the treatment. The treatment optimization is based on 3D non-invasive MR thermal images acquired during the course of heat treatment. The perturbation technique is used to offset the effect of thermal image noise on the determination of system thermal parameters. Tests of the system show that less or equal to M2 (M is the number of antennas) iterations are required for steering of heating into the specified target volume even with significant initial applicator–target alignment errors, which were used to challenge the optimization algorithm. Overall, the proposed treatment system shows great potential for a full-scale clinical HT platform for treatment of soft-tissue sarcoma in extremity.
Acknowledgments
This work was supported by NCI grant P01-CA042745. The authors would also like to thank Ansoft Corporation (Pittsburgh, PA) and National Instruments (Austin TX) for provision of software.
References
- Chen Q, Tong S, Dewhirst MW, Yuan F. Targeting tumor microvessels using doxorubicin encapsulated in a novel thermosensitive liposome. Mol. Cancer Ther. 2004;3:1311–7. [PubMed] [Google Scholar]
- Cheng K, Stakhursky V, Craciunescu OI, Stauffer P, Dewhirst M, Das SK. Fast temperature optimization of multi-source hyperthermia applicators with reduced-order modeling of ‘virtual sources’. Phys. Med. Biol. 2008;53:1619–35. doi: 10.1088/0031-9155/53/6/008. [DOI] [PMC free article] [PubMed] [Google Scholar]
- Cheng K, Stakhursky V, Stauffer P, Dewhirst M, Das SK. Online feedback focusing algorithm for hyperthermia cancer treatment. Int. J. Hyperthermia. 2007;23:539–54. doi: 10.1080/02656730701678877. [DOI] [PMC free article] [PubMed] [Google Scholar]
- Cheng K-S, Roemer RB. Blood perfusion and thermal conduction effects in Gaussian beam, minimum time single-pulse thermal therapies. Med. Phys. 2005;32:311–7. doi: 10.1118/1.1835591. [DOI] [PubMed] [Google Scholar]
- Corry P, Dewhirst M. Forward. Thermal medicine, heat shock proteins and cancer. Int. J. Hyperthermia. 2005;21:675–7. doi: 10.1080/02656730500272856. [DOI] [PubMed] [Google Scholar]
- Das SK, Clegg ST, Samulski TV. Electromagnetic thermal therapy power optimization for multiple source applicators. Int. J. Hyperthermia. 1999a;15:291–308. doi: 10.1080/026567399285666. [DOI] [PubMed] [Google Scholar]
- Das SK, Clegg ST, Samulski TV. Computational techniques for fast hyperthermia temperature optimization. Med. Phys. 1999b;26:319–28. doi: 10.1118/1.598519. [DOI] [PubMed] [Google Scholar]
- Das SK, Jones EA, Samulski TV. A method of MRI based thermal modeling for a RF phased array. Int. J. Hyperthermia. 2001;17:465–82. doi: 10.1080/02656730110068320. [DOI] [PubMed] [Google Scholar]
- Dewhirst M, Jones E, Samulski RJ, Vujaskovic Z, Li C, Prosnitz L. Hyperthermia. In: Kufe DW, et al., editors. Cancer Medicine 6. Decker; Hamilton, ON: 2003. pp. 623–36. [Google Scholar]
- Gabriel S, et al. The dielectric properties of biological tissues: I. Literature survey. Phys. Med. Biol. 1996a;41:2231–49. doi: 10.1088/0031-9155/41/11/001. [DOI] [PubMed] [Google Scholar]
- Gabriel S, et al. The dielectric properties of biological tissues: II. Measurements in the frequency range 10 Hz to 20 GHz. Phys. Med. Biol. 1996b;41:2251–69. doi: 10.1088/0031-9155/41/11/002. [DOI] [PubMed] [Google Scholar]
- Gabriel S, et al. The dielectric properties of biological tissues: III. Parametric models for the dielectric spectrum of tissues. Phys. Med. Biol. 1996c;41:2271–93. doi: 10.1088/0031-9155/41/11/003. [DOI] [PubMed] [Google Scholar]
- Gellerman J, Hildebrandt B, Issels R, Ganter H, Wlodarczyk W, Budach V, Felix R, Tunn PU, Reichardt P, Wust P. Noninvasive magnetic resonance thermography of soft tissue sarcomas during regional hyperthermia—correlation with response and direct thermometry. Cancer. 2006a;107:1373–82. doi: 10.1002/cncr.22114. [DOI] [PubMed] [Google Scholar]
- Gellerman J, Weihrauch M, Cho CH, Wlodarczyk W, Fahling H, Felix R, Budach V, Weiser M, Nadobny J, Wust P. Comparison of MR-thermography and planning calculations in phantoms. Med. Phys. 2006b;33:3912–20. doi: 10.1118/1.2348761. [DOI] [PubMed] [Google Scholar]
- Goss SA, Johnston RL, Dunn F. Comprehensive compilation of empirical ultrasound properties of mammalian tissues. J. Acoust. Soc. Am. 1978;64:423–57. doi: 10.1121/1.382016. [DOI] [PubMed] [Google Scholar]
- Hall EJ, Giaccia AJ. Radiobiology for the Radiologist. 6th edn Lippincott Williams & Wilkins; Philadelphia, PA: 2005. [Google Scholar]
- Hayt WH, Jr, Buck JA. Engineering Electromagnetics. 7th edn McGraw-Hill; New York: 2006. [Google Scholar]
- Hutchinson E, Dahleh M, Hynynen KH. The feasibility of MRI feedback control for intracavitary phased array hyperthermia treatments. Int. J. Hyperthermia. 1998;14:39–56. doi: 10.3109/02656739809018213. [DOI] [PubMed] [Google Scholar]
- Jones EL, Oleson JR, Prosnitz LR, Samulski TV, Vujaskovic Z, Yu DH, Sanders LL, Dewhirst MW. Randomized trial of hyperthermia and radiation for superficial tumors. J. Clin. Oncol. 2005;23:3079–85. doi: 10.1200/JCO.2005.05.520. [DOI] [PubMed] [Google Scholar]
- Kowalski ME, Behnia B, Webb AG, Jin J-M. Optimization of electromagnetic phased arrays for hyperthermia using magnetic resonance temperature estimation. IEEE Trans. Biomed. Eng. 2002;49:1229–41. doi: 10.1109/TBME.2002.804602. [DOI] [PubMed] [Google Scholar]
- MacFall J, et al. Temperature dependence of canine brain tissue diffusion coefficient measured in vivo with magnetic resonance echo-planar imaging. Int. J. Hyperthermia. 1995;11:73–86. doi: 10.3109/02656739509004949. [DOI] [PubMed] [Google Scholar]
- MacFall J, et al. 1H MRI Phase thermometry in vivo in canine brain, muscle and tumor tissues. Med. Phys. 1996;23:1775–82. doi: 10.1118/1.597760. [DOI] [PubMed] [Google Scholar]
- Mougenot C, Salomir R, Palussiere J, Grenier N, Moonen CTW. Automatic spatial and temporal temperature control for MR-guided focused ultrasound using fast 3D MR thermometry and multispiral trajectory of the focal point. Magn. Reson. Med. 2004;52:1005–15. doi: 10.1002/mrm.20280. [DOI] [PubMed] [Google Scholar]
- Paulides MM, Wielheesen DHM, Van Der Zee J, Van Rhoon GC. Assessment of the local SAR distortion by major anatomical structures in a cylindrical neck phantom. Int. J. Hyperthermia. 2005;21:285. doi: 10.1080/02656730400013855. [DOI] [PubMed] [Google Scholar]
- Paulides MM, Bakker JF, Van Rhoon GC. A head and neck hyperthermia applicator: experimental phantom verification and FDTD model. Int. J. Rad. Onc. Biol. Phys. 2007a;68:612–20. doi: 10.1016/j.ijrobp.2007.01.035. [DOI] [PubMed] [Google Scholar]
- Paulides MM, Bakker JF, Neufeld E, Van Der Zee J, Jansen PP, Levendag PC, Van Rhoon GC. The HYPERcollar: a novel applicator for hyperthermia in the head and neck. Int. J. Hyperthermia. 2007b;23:567–76. doi: 10.1080/02656730701670478. [DOI] [PubMed] [Google Scholar]
- Ponce AM, Viglianti BL, Yu D, Yarmolenko PS, Michelich CR, Woo J, Bally MB, Dewhirst MW. Magnetic resonance imaging of temperature-sensitive liposome release: drug dose painting and antitumor effects. J. Natl. Cancer Inst. 2007;99:53–63. doi: 10.1093/jnci/djk005. [DOI] [PubMed] [Google Scholar]
- Ponce AM, Wright A, Dewhirst MW, Needham D. Targeted bioavailability of drugs by triggered release from liposomes. Future Lipidology. 2006;1:25–34. [Google Scholar]
- Roemer RB. The local tissue cooling coefficient: a unified approach to thermal washout and steady state ‘perfusion’ calculation. Int. J. Hyperthermia. 1990;6:421–30. doi: 10.3109/02656739009141148. [DOI] [PubMed] [Google Scholar]
- Sneed PK, Stauffer PR, Li GC, Stege GJJ. Hyperthermia. In: Leibel SA, Phillips TL, editors. Textbook of Radiation Oncology. W B Saunders; Philadelphia, PA: 1998. pp. 1241–62. [Google Scholar]
- Song CW, Lokshina A, Rhee JG, Patten M, Levitt SH. Implication of blood flow in hyperthermia treatment of tumors. IEEE Trans. Biomed. Eng. 1984;31:9–16. doi: 10.1109/TBME.1984.325364. [DOI] [PubMed] [Google Scholar]
- Stauffer PR. Evolving technology for thermal therapy of cancer. Int. J. Hyperthermia. 2008;21:731–44. doi: 10.1080/02656730500331868. [DOI] [PubMed] [Google Scholar]
- Valdagni R, Amichetti M. Report of long-term follow-up in a randomized trial comparing radiation therapy and radiation therapy plus hyperthermia to metastatic lymph nodes in stage IV head and neck patients. Int. J. Radiat. Oncol. Biol. Phys. 1994;28:163–9. doi: 10.1016/0360-3016(94)90154-6. [DOI] [PubMed] [Google Scholar]
- van der Zee J, van Rhoon GC. Cervical cancer: radiotherapy and hyperthermia. Int. J. Hyperthermia. 2006;22:229–34. doi: 10.1080/02656730600722578. [DOI] [PubMed] [Google Scholar]
- Vanne A, Hynynen K. MRI feedback temperature control for focused ultrasound surgery. Phys. Med. Biol. 2003;48:31–43. doi: 10.1088/0031-9155/48/1/303. [DOI] [PubMed] [Google Scholar]
- Weihrauch M, Wust P, Weiser M, Nadobny J, Eisenhardt S, Budach V, Gellermann J. Adaptation of antenna profiles for control of MR guided hyperthermia (HT) in a hybrid MR-HT system. Med. Phys. 2007;34:4717–25. doi: 10.1118/1.2804617. [DOI] [PubMed] [Google Scholar]
- Wust P, Cho CH, Hildebrandt B, Gellermann J. Thermal monitoring: invasive, minimal-invasive and non-invasive approaches. Int. J. Hyperthermia. 2006;22:255–62. doi: 10.1080/02656730600661149. [DOI] [PubMed] [Google Scholar]