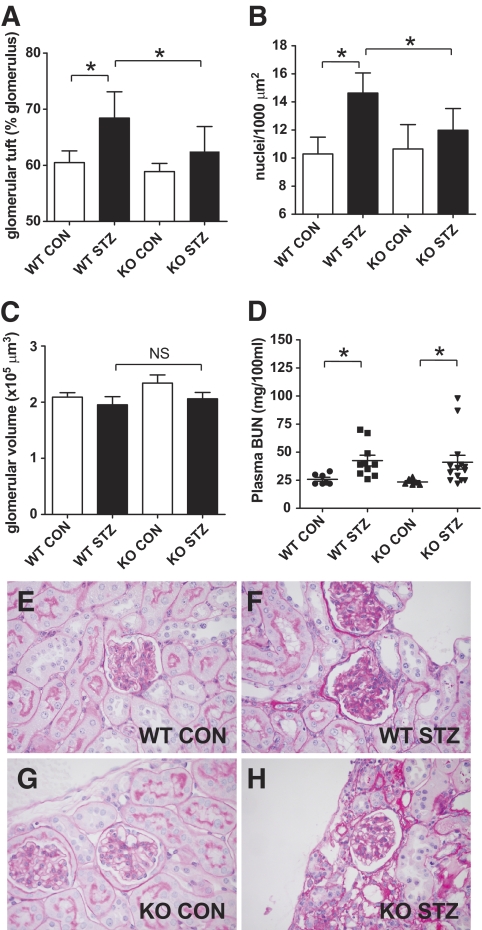
FIG. 1.
Morphometry of diabetic (■) and nondiabetic (□) wild-type and Col8a1−/Col8a2− mice. A: Mesangial tuft area per glomerulus (square millimeters). B: Mesangial nuclei per 1,000 μm2. C: Glomerular volume. D: Plasma BUN (mg/100 ml). Bars represent SE; *P < 0.05, n = 10−12. Representative PAS stainings of nondiabetic wild-type (E) and Col8a1−/Col8a2− mice (G) and diabetic wild-type (F) and Col8a1−/Col8a2− mice (H). CON, control; KO, knockout; WT, wild-type. (A high-quality digital representation of this figure is available in the online issue.)

