Abstract
Background
Recent studies show that habits detrimental to health are becoming established ever earlier in life. Because most of these investigations focus on adolescents up to the age of 18 years, it is largely unknown whether and to what extent negative behavioral modifications are intensified in young adults.
Methods
Within the cross-sectional study "Fit fürs Leben" (Fit for Life) 12 835 volunteers aged 16 to 25 years were anthropometrically investigated and interviewed about their lifestyle and habits (sporting activity, nutrition and health-related behavior).
Results
Data on anthropometric (BMI, waist circumference, body fat) and health-relevant (lack of exercise, smoking) characteristics as well as the frequency of cardiovascular risk factors show a clear increase in unhealthy attributes, particularly among those aged 20 to 25 years. Fifty percent of 25-year-old men are overweight, 60% smoke, and around one third do not participate in sport. Although only one quarter of women aged 16 to 25 years are overweight, women engage in sport much less frequently. Only one quarter of all study participants display none of the investigated cardiovascular risk factors.
Discussion
The health-detrimental tendencies increase considerably after the age of 20. Efficient cross-institutional prevention campaigns are urgently necessary to promote and continually support a health-conscious life-style.
Keywords: physical activity, overweight, health-related behavior, smoking, youth health
The daily energy expenditure of hominoids has remained fairly constant over 3.5 million years, at some 16 000 kJ/day (1). Only in recent decades, technical progress in work, households, and transport has resulted in massive reductions in activity and physical labor. Further, lifestyle habits and leisure behaviors have changed substantially, especially in the industrialized nations, and many people have established a lifestyle that is lacking in activity, even in their leisure time (2, 3). 60% of the world’s population are physically active for less than 30 minutes/day (4, 5).
Since everyday life is often shaped by unfavorable habits—including an excessively caloric diet and excess alcohol consumption—a strong increase in obesity seems an inevitable consequence (6). Currently, some two thirds of male adults in Germany and half of women may be considered overweight (7, 8).
Lack of exercise and overweight
Economic effects
In view of how widespread they have become, the sequelae of overweight and lack of exercise will not simply remain a problem for those affected. An increase in chronic accompanying disorders—such as the metabolic syndrome or damage to the locomotor apparatus—inevitably increases the demand for medical services and nursing care, and it incurs enormous cost rises (9, 10).
It is easy to forget in this context that considerable financial burdens arise even before the onset of physical disorders: owing to insufficient physical fitness, increasing numbers of employees are having serious problems in coping with their everyday work-related challenges (11–13, e1). More recent studies hypothesize that in the United States, employees’ poor physical stamina and increasing unfitness to work will result in production losses worth billions (14, 15). The fear is that this situation will deteriorate in the coming years because the proportion of overweight adolescents has been rising exponentially for years (16–18).
Changes in everyday routines and behaviors on leaving school and entering work
In recent years, some studies have focused mainly on children and adolescents (18, 19, e2–e4), whereas the age group of 16- to 25-year-olds was not taken into consideration in scientific work. The everyday lives of people in this age group often change very considerably within a very short time. This is especially true for the transition between leaving school and entering working life, and further factors may come into play, including puberty and leaving the parental home.
The extent to which in this phase of life, negative behavioral modifications occur with regard to sporting activities, dietary habits, and health behaviors is difficult to quantify because epidemiologically relevant studies with associated data are currently lacking. This gap is surprising, especially in view of demographic change and generally worrying health trends, because this age group is important not only for the economy and for society in their role as future employees, but it is also a suitable target group for preventive measures.
The "Fit for Life" study
Since the end of 2004, the obvious data deficit has been addressed by the German "Fit for Life" ("Fit-für’s-Leben") study (17). In parallel, data are being collected about adolescents’ and young adults’ habits and behaviors in terms of health, leisure time, working life, other life situations, anthropometric variables, and physical fitness. Such a study approach allows a differentiated analysis of lifestyle factors and enables us to look at measurable variables of fitness and anthropometric measures (for additional information, see our internet supplement) in an integrated manner.
Method
So far, more than 17 000 persons aged 6 to 25 years have participated in the Fit for Life study. The study was approved by the ethics committee of the Deutsche Sporthochschule Köln (German Sport University Cologne) and presented to the data protection officers for Rhineland-Palatinate and North Rhine–Westphalia and gained approval. Permission for the studies in schools was also gained from the school authorities.
Study participants
This study included all participants in the age group 16 to 25 years (n = 12 835). Participants were from
national recruitment agencies (for all occupations that require apprenticeships as well as university starters and leavers),
general, intermediate, and high schools, and
vocational schools in the federal states of Rhineland-Palatinate and North Rhine–Westphalia.
Anyone interested in participating in the study first had to give their written informed consent. Minors needed written consent from parents or those in loco parentis.
Study approach
The Fit for Life study has a combined study design consisting of three modules:
Anonymized written surveys
Physical measurements
Tests of physical fitness (strength, speed, stamina, and coordination).
This article presents partial results from the surveys and anthropometric investigations.
Anonymized surveys—A standardized questionnaire was used to elicit sociodemographic data such as age, sex, and educational background, as well as individual habits (e-questionnaire [original questionnaire, hence not translated]). Data on leisure time, diet/nutrition, and health were collected by using stepwise prompted responses. In the context of the questions about leisure time, sporting activities were included. Subjects were asked how they rated themselves in terms of sports (nonathlete/leisure athlete/competitive athlete), how often per week they played sports, whether they were an active member in a sports club, and whether they believed that they exercised to a sufficiently high degree.
Dietary habits were analyzed by using the questions "How often do you eat fast food, French fries, Hamburgers…?" "How often do you eat sweets, cakes, crisps …?" and "How often do you consume soft drinks, caffeinated drinks, lemonade, iced tea …?"
Health relevant aspects were captured by using the questions "Do you smoke regularly?", "How do you rate your body weight?", "Do you feel healthy?", and "Do you feel stressed in your everyday life?"
Anthropometric measurements—All measuring procedures followed the criteria on correctness, exactness, and precision laid out in a standard ergonomics handbook (e5) and German industry standard DIN EN ISO 15535: 2003–10. Body height and weight were measured using standardized measuring instruments (anthropometer and calibrated scales). Waist circumference (smallest horizontal circumference of the abdomen between costal arch and iliac crest was measured with plastic tape measures in people standing in an upright position. Further, the proportion of body fat was measured in 4315 men and 1472 women. Data collection was done by measuring skin fold thickness at 4 locations (4-point method: biceps, triceps, subscapular fold, suprailiac fold) (e5, e6).
Calculating overweight thresholds—To assess body weight in a standardized fashion and quantify prevalence rates of overweight, the body mass index (BMI) was calculated for study participants aged 18 years or older. According to the WHO criteria (4), subjects with a BMI >25 kg/m2 were classified as overweight. For younger study participants, age and sex specific BMI classifications according to the criteria of the International Obesity Task Force (IOTF) were set out (20).
Risk factors – The occurrence and frequency of health risk factors for cardiovascular disorders were calculated from the data reported on lifestyle habits and body measurements, in accordance with the WHO criteria. A risk factor exists if the following values are exceeded for one of the variables or if one of the following characteristics is present:
Overweight (BMI >25 kg/m2 or IOTF threshold or waist circumference [> 102 cm in men, >88 cm in women])
Smoking
Lack of exercise (subjective assessment of frequency of exercise in the categories "never" or "rarely").
Statistics
We used the software packages SPSS 14.0 and STATISTICA 7.1 for our statistical calculations. The mean is used as the measure of central tendency and the standard deviation as the dispersal measure (in figures, the standard error). Dichotomous or ordinal scale variables were evaluated using the chi-square test and/or binary logistic regression. To calculate binary logistic regressions, dependent variables with more than two categories were dichotomized. For the binary logistic regressions, odds ratios (OR) and 95% confidence intervals (CI) were reported. The goodness of fit (stepwise regression) is described with Nagelkerke’s R2. Correlations between two characteristics measured on interval scales were calculated by using Spearman’s correlation analyses and represented as the corresponding coefficient (r). For all tests we accepted a probability of error of p<0.01 as significant.
Results
Study participants
The age and sex related distribution of the 12 835 study participants is listed in table 1. 40% of the cohort were still in school at the time of the study, 5% were at university, 35% were in vocational education, and 20% were working. With regard to educational level/type of school, 41% had a university entrance qualification/high school certificate, 35% had a leaving certificate from an intermediate secondary school (Realschule), and 20% one from a secondary general school (Hauptschule). 4% had no certificate of educational attainment.
Table 1. Absolute and relative numbers of study participants aged 16 to 25 years (men n = 10 407, women n = 2428).
| Age (years) | Study participants | |||||
| Men | Women | Total | ||||
| (n) | % | (n) | % | (n) | % | |
| 16 | 335 | 3.2% | 224 | 9.2% | 559 | 4.4% |
| 17 | 714 | 6.9% | 328 | 13.5% | 1042 | 8.1% |
| 18 | 991 | 9.5% | 350 | 14.4% | 1341 | 10.4% |
| 19 | 1595 | 15.3% | 372 | 15.3% | 1967 | 15.3% |
| 20 | 1796 | 17.3% | 300 | 12.4% | 2096 | 16.3% |
| 21 | 1640 | 15.8% | 276 | 11.4% | 1916 | 14.9% |
| 22 | 1291 | 12.4% | 185 | 7.6% | 1476 | 11.6% |
| 23 | 923 | 8.9% | 178 | 7.3% | 1101 | 8.6% |
| 24 | 627 | 6.0% | 117 | 4.8% | 744 | 5.8% |
| 25 | 495 | 4.7% | 98 | 4.0% | 593 | 4.6% |
| Total | 10 407 | 100% | 2428 | 100% | 12 835 | 100% |
Body measurements and prevalence of overweight
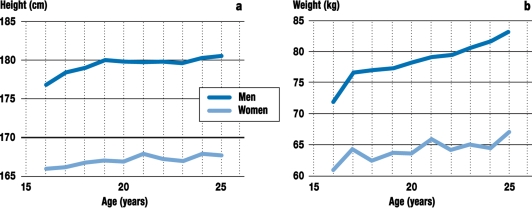
Figure 1 shows age related fluctuations in body height and weight. Analysis of the body height in 16- to 19-year-old male subjects shows that the differences between the years reached significance (p<0.01). However, differences in body height in older male subjects and all age groups of female subjects did not reach significance.
Figure 1.
Height (cm) and body weight (kg) of study participants by age (mean ± standard error; men n = 10 407, women n = 2428)
Increases in body weight reach significance (p<0.01) for all age groups; these are more pronounced in men then in women (p<0.01). For male subjects, a nearly linear increase in body weight of about 1 kg per year was found (p<0.01).
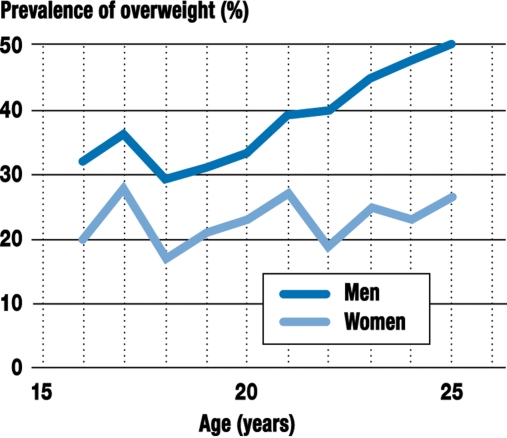
32% of men and 24% of women were overweight (OR 0.50; CI 0.45 to 0.55). The probability of becoming overweight rose significantly over the age groups in men (figure 2) (OR 1.10; CI 1.08 to 1.13). Among male study participants, those aged 25 were more at risk of being overweight than the 16 to 20 years age group (OR 2.15; CI 1.61 to 2.88). For women, the prevalence of overweight in this life period (figure 2) was not associated with age (OR 1.01; CI 0.98 to 1.06).
Figure 2.
Prevalence of overweight (%) of study participants by age (men n = 10 407, women n = 2428)
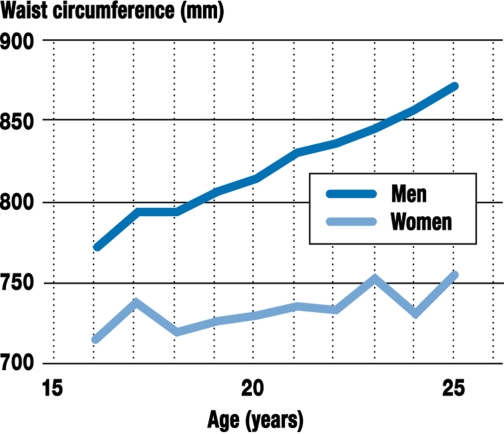
Significant differences for sex and age also existed for waist circumference (p<0.01) (figure 3); only in men, waist circumference increased in a fairly linear pattern by about 10 mm per year. In our sample, the proportion of body fat measured in men was 18.8% ± 5.9% and in women, 30.4% ± 5.5%. When waist circumference and body weight are studied together, it becomes obvious that with increasing waist circumference the proportion of body fat in men and women increased in a comparable fashion (men r = 0.78, p<0.01; women r = 0.73, p<0.01).
Figure 3.
Waist circumference (mm) of study participants by age (mean ± standard error; men n = 10 407, women n = 2428)
Relevant health behaviors
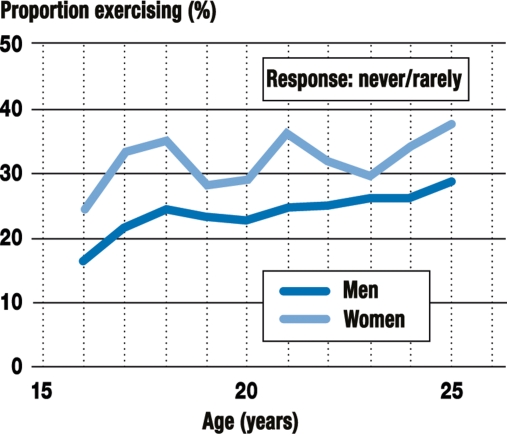
When asked for sporting activities, one quarter of adolescents and young adults reported that they "never" or "rarely" pursued sports. Figure 4 shows that the proportion of inactive people increased over the age groups. The probability of "never" or "rarely" doing sports was much higher in those aged 25 years than in those aged 16 years (OR 1.99; CI 1.50 to 2.62). The situation is similar when subjects were asked about membership in sports clubs (OR 0.40; CI 0.32 to 0.52). Figure 5 shows that only 19% of 25-year-old women and 30% of 25-year-old men were active in sports clubs. The answer to the question "Do you think that you exercise enough?" was "no" from 32% of study participants—another notable difference between 16- and 25-year-olds (OR 0.46; CI 0.34 to 0.63).
Figure 4.
Proportion of study participants who "never" or "rarely" exercise, by age (men n = 10 407, women n = 2428)
Figure 5.
Proportion of study participants who are active members in sports clubs, by age (men n = 10 407, women n = 2428)
For all aspects, the differences between the sexes reached significance: Women reported more often that they "never" or "only rarely" did sports (OR 1.54; CI 1.40 to 1.70), are not active members in sports clubs (OR 0.80; CI 0.73 to 0.89), or did not exercise enough (OR 0.65; CI 0.59 to 0.72).
Significant differences were also found in the dietary habits of male and female study participants. A higher proportion of women reported "fairly frequent" consumption of sweets (46%) than men (35%). A higher proportion of men consume soft drinks (response category "fairly often" in 62% of men and 49% of women) and fast food (response category "fairly often" in 38% of men and 24% of women). The consumption of highly caloric foods, however, seemed to decrease over the age groups: A comparison between 16- and 25-year-olds found that the food types prompted for ("sweets/crisps", "fast food," and "soft drinks" showed significant decreases in the category "fairly often."
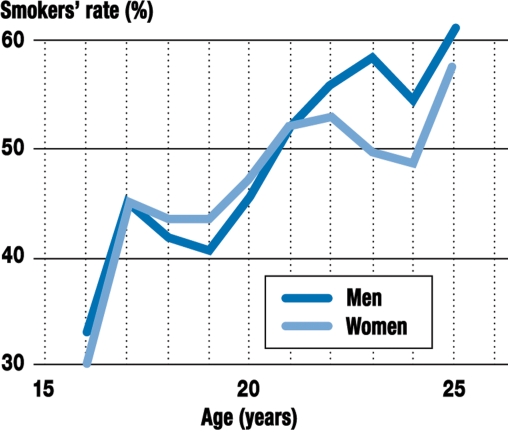
By contrast, tobacco consumption (figure 6) increased from about a third in 16-year-olds to 60% in 25-year-old subjects (OR 3.24; CI 2.52 to 4.16). Differences between the sexes do not reach significance.
Figure 6.
Proportion of study participants who smoked, by age (men n = 10 407, women n = 2428)
Health risk factors
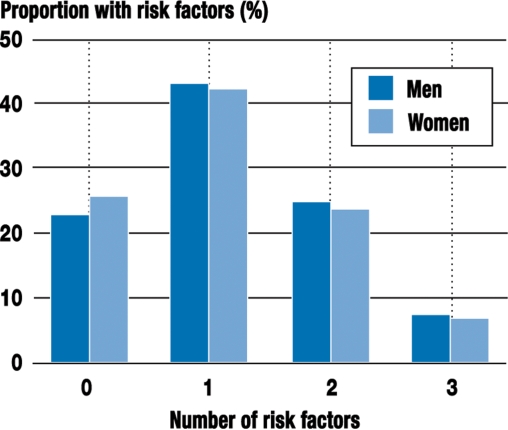
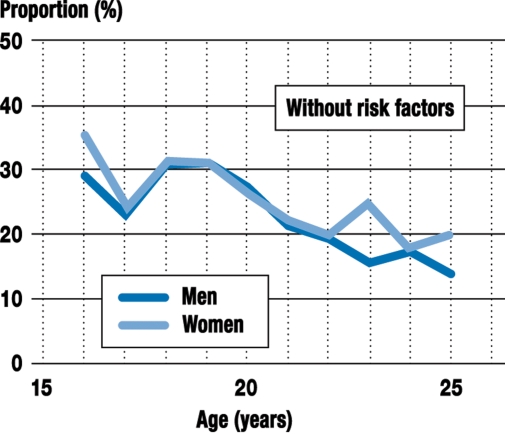
According to the WHO categories of cardiovascular risks, most study participants had at least one of the risk factors under investigation. Only 25% of adolescents or young adults had no risk factor (figure 7). The difference between the sexes does not reach significance. Figure 8 shows that the group without risk factors shrank with increasing age. Among 16-year-olds, this group comprised about 30% of the overall cohort, but among 25-year-olds, this proportion had dropped to less than 20% (OR 0.39; CI 0.28 to 0.53).
Figure 7.
Proportion (%) of cardiovascular risk factors in study participants (men n = 10 407, women n = 2428)
Figure 8.
Proportion (%) of study participants without cardiovascular risk factors, by age (men n = 10 407, women n = 2428)
For further clarification of the probabilities of cardiovascular risk factors, the variables age, sex, and level of education, as well as the subjective assessments of exercise frequency, health status, and stress, were included in a binary logistic model (table 2). The variables were chosen while considering health relevant objective variables and subjective assessments, which may among others be associated with the extent to which risk factors are present. The highest odds ratios were found in people with the lowest educational levels, older study participants (>20 years of age), and people who in their own estimation did not exercise enough.
Table 2. Further statistics to determine additional factors that influence the occurrence of cardiovascular risk factors.
| Variables | Odds ratio (95% confidence interval) | p |
| Age | ||
| Reference value: 16 years | ||
| 17 years | 1.58 (1.19 to 2.07) | 0.002 |
| 18 years | 1.34 (1.03 to 1.75) | 0.028 |
| 19 years | 1.75 (1.34 to 2.27) | 0.000 |
| 20 years | 2.03 (1.55 to 2.67) | 0.000 |
| 21 years | 2.30 (1.74 to 3.03) | 0.000 |
| 22 years | 2.44 (1.82 to 3.28) | 0.000 |
| 23 years | 2.50 (1.82 to 3.44) | 0.000 |
| 24 years | 3.61 (2.48 to 5.25) | 0.000 |
| 25 years | 4.06 (2.59 to 6.35) | 0.000 |
| Sex | ||
| Reference: Men | ||
| Women | 0.83 (0.73 to 0.95) | 0.006 |
| School education/type of school | ||
| Reference: General school leavers’ certificate for university entry / high school (Gymnasium) | ||
| Intermediate school (Realschule) | 3.19 (2.80 to 3.63) | 0.000 |
| Secondary general school (Hauptschule) | 5.44 (4.58 to 6.46) | 0.000 |
| Do you think you exercise enough? | ||
| Reference: "Yes" | ||
| „No“ | 2.70 (2.37 to 3.07) | 0.000 |
| Do you feel healthy? | ||
| Reference: "Yes" | ||
| „No“ | 1.68 (1.30 to 2.16) | 0.000 |
| Do you feel stressed in everyday life? | ||
| Reference: "No" | ||
| „Yes“ | 1.25 (1.09 to 1.43) | 0.001 |
Calculated by using binary logistic regression (R2 = 0.183) and calculating associated odds ratios with 95% confidence intervals (n = 6958)
Discussion
In recent years, increasing numbers of studies of the exercise, dietary, and health behaviors of adolescents have been conducted, which document worrying trends (17, 21–23). Unfavorable lifestyle habits, such as a lack of exercise, a nutritionally deficient diet or overeating, and smoking are often adopted at school age. However, their spread and development over the ages cannot be sufficiently quantified as only few epidemiologically relevant studies exist in Germany that have analyzed a larger age range (e2, e3, 18). These studies focused on school age children and adolescents up to 18 years of age. It is not known whether and to what extent the observed unfavorable trends continue in young adults. For most 16- to 25-year-olds, the transition from school into working life falls into this period. This mostly means a new life situation that is associated with substantial changes to everyday routines.
The study findings are showing for the first time that the identified unfavorable developments substantially gain momentum after the 18th year of life. This worrying statement is supported by extending the age range under observation to include children and adolescents (17, 19, 21, and further data of the "Fit for Life" study).
As can be seen from the prevalence rates of overweight, this is a particular problem in men aged 20 to 25 years, where weight increases drastically: 50% of 25-year-old male study participants were classed as overweight. Within only 5 years, the mean body weight increased in an almost linear fashion, from 78 kg to more than 83 kg (22). Since waist circumference increases in tandem, this development does not indicate primarily developmental growth but pronounced growth in body mass.
For other variables relevant to health (sporting activities, smoking rates), the same is true: Unfavorable lifetime habits are often set in young adulthood. Recently published smoking rates of 11- to 17-year-olds from the KiGGS study (e7) showed that after the 15th year, smoking rates increased to more than 40%. As figure 6 shows, the rate increases with increasing age and reaches about 60% in 25-year-olds. Simultaneously, the proportion of inactive people rises. About a third of 25 year olds are "exercise abstinent" and are not members of sports clubs, and more women pursue inactive lifestyles than men (22, 24). The multivariate analyses show that especially overweight youths with a low educational level and lack of exercise are at risk of acquiring cardiovascular risk factors in early adulthood. The real situation may well be more problematic than the data from this study indicate, because we examined only 3 risk factors, in accordance with the WHO criteria.
The observed trends in young adults are relevant in the sense of preliminary research for the benefit of the healthcare system and the economy. The effects of a passive lifestyle in the population will affect increasingly professional categories that require a minimum level of physical fitness and stamina: For the army, police force, and the trades, a decrease in physical fitness of young people is an additional problem in succession planning, further to demographic change (11, 25).
In assessing the results, methodological limitations should not be disregarded. Even though a cross section of more than12 500 people aged 16 to 25 years was studied, the data pool is not necessarily representative for Germany in its entirety. Further, our voluntary study cohort included far more men than women. In spite of this limitation, however, fundamental associations have been discovered that are necessary for planning and conducting targeted prevention campaigns.
The collected data support the assumption that the preventive measures initiated so far cannot halt the worrying health trends (e8). It may also be assumed that the practical implementation of effective preventive concepts is more difficult in those who have already left school. Considering the substantial increase in overweight and unfit 20- to 25-year-olds, prevention will have to be stepped up and specific measures implemented. Ultimately, the goal is to motivate people to lead active lives as early on as possible. This can only be done successfully if preventive campaigns are conducted by joint efforts of schools, clubs, health insurers, workplaces, and politicians. The second phase of the "Fit for Life" study aims to conduct effective intervention measures in partnership with different institutions in local, joint projects.
Supplemental data for the "Fit for Life" study.
The "Fit for Life" study has been investigating adolescents and young adults aged 6 to 25 years since the end of 2004 and has collected data on the physical fitness, anthropometric measures, and information on participants’ health, leisure time, working lives, and lifestyle habits. The ethics committee for medical research in humans of the German Sport University Cologne (Deutsche Sporthochschule Köln) approved the research project. The study was also approved by the data protection representatives for the states of Rhineland-Palatinate and North Rhine–Westphalia. The studies in schools were approved by the school authorities.
Participants
The study participants (school students, apprentices, new starters in the workplace, university students, and university graduates) were recruited by national employment agencies, the public school system, vocational schools, and universities in Rhineland-Palatinate and North Rhine Westphalia. The institutions were selected with regard to the national distribution of education and also with regard to rural and urban conurbations.
At the start of recruitment, the heads of the institutions were informed about the basis, content, aims, and detailed schedule of the study. In a second step, the teachers or selected teachers in certain subjects were informed. To participate in the study, all interested parties had to provide written informed consent at the start. Since minors were able to participate only with permission from parents or those in loco parentis, the schools’ heads and teachers sent out information letters and consent forms, which had to be returned. Those aged 18 or older were able to provide written consent in the context of the test presentation and information for participants, which were conducted immediately before data collection by the study coordinators. The participation rate for the Fit for Life study was usually in excess of 90%.
Trends with a negative impact on health and their momentum
The results of the Fit for Life study have shown that negative health trends gain momentum in young adults: a lack of exercise, overweight, and smoking rates rose particularly in 21- to 25-year-old study participants. Unfavorable health behaviors are known to be far more common in low socioeconomic strata of the population. Potential changes in the socioeconomic composition of the study population might therefore explain the observed trends. The e-table, however, shows that only slight educational differences exist in the younger (16- to 20-year-old) and older (21- to 25-year-old) study participants. In the 21- to 25-year-olds, educational levels were actually more favorable.
Anthropometric investigations
All measuring procedures in the anthropometric area followed the criteria for correctness, exactness, and precision set out in a standard ergonomics handbook (e5) and the German industry standard DIN EN ISO 15535: 2003–10. Height and weight (in underwear or light sports clothes) were measured using standardized measuring instruments (anthropometers and calibrated scales) with pecision within 2 mm or 100 g.
Waist and hip circumferences were measured according to the ergonomics handbook’s instruction (e5) to 5 mm. The person under investigation stands as straight as possible, with the feet together. The waist circumference is the smallest horizontal circumference at the level of the narrowest points in the lateral contour of the body, between costal arch and iliac crest. The hip circumference is the largest horizontal measurement around hips and buttocks in a standing subject. These measurements were done using plastic tape measures.
Body fat rates were determined by measuring skin fold thickness on 4 parts of the body (4 point method: biceps, triceps, subscapular fold, and suprailiac fold) using calipers (Harpenden Skinfold Caliper HSK-BI, British Indicators, West Sussex, England). Skin fold thickness was measured to within 0.2 mm exactness. The sum of the 4 measurements was evaluated according to the formula of Durnin and Womersley (1974) (e6) and stored as the relative body fat value.
Statistics
To identify differences between groups and associations between variables, we used different methods. For all investigations, the criterion to disprove the null hypothesis or assumption of the alternative hypothesis, we used a significance level of 1%. The study results were not corrected for multiple individual comparisons (post hoc tests).
e-Table. Educational background of the younger (16- to 20-year-old) and older (21- to 25-year-old) study participants (men n = 10 407; women n = 2428).
| Age group | High school certificate to enable the student to go to university | Intermediate school certificate | Secondary general school certificate | Total |
| 16- to 20-year-olds | ||||
| (47.9% of study participants) | 35.5% | 46.4% | 29.8% | 100% |
| 21- to 25-year-olds | ||||
| (52.1% of study participants) | 47.5% | 53.6% | 15.7% | 100% |
| Total cohort | 41.8% | 35.8% | 22.5% | 100% |
Acknowledgments
Translated from the original German by Dr Birte Twisselmann.
Footnotes
Conflict of interest statement
The authors declare that no conflict of interest exists according to the guidelines of the International Committee of Medical Journal Editors.
References
- 1.Cordain L, Gotshall RW, Eaton SB, Eaton SB. Physical activity, energy expenditure and fitness: an evolutionary perspective. Int J Sports Med. 1998;19:328–335. doi: 10.1055/s-2007-971926. [DOI] [PubMed] [Google Scholar]
- 2.Hamilton MT, Hamilton DG, Zderic TW. Role of low energy expenditure and sitting in obesity, metabolic syndrome, type 2 diabetes, and cardiovascular disease. Diabetes. 2007;56:2655–2667. doi: 10.2337/db07-0882. [DOI] [PubMed] [Google Scholar]
- 3.Hu FB, Li TY, Colditz GA, Willett WC, Manson JE. Television watching and other sedentary behaviors in relation to risk of obesity and type 2 diabetes mellitus in women. JAMA. 2003;289:1785–1791. doi: 10.1001/jama.289.14.1785. [DOI] [PubMed] [Google Scholar]
- 4.World Health Organization. Obesity: preventing and managing the global epidemic. Report of a WHO consultation. World Health Organ Tech Rep Ser. 2000;894(i-xii):1–253. [PubMed] [Google Scholar]
- 5.Blair SN, Kohl HW, Gordon NF, Paffenbarger RS., Jr How much physical activity is good for health? Annu Rev Public Health. 1992;13:99–126. doi: 10.1146/annurev.pu.13.050192.000531. [DOI] [PubMed] [Google Scholar]
- 6.Lakka TA, Bouchard C. Physical activity, obesity and cardiovascular diseases. Handb Exp Pharmacol. 2005;170:137–163. doi: 10.1007/3-540-27661-0_4. [DOI] [PubMed] [Google Scholar]
- 7.Mikrozensus 2003. Leben und Arbeiten in Deutschland. Ergebnisse des Mikrozensus 2003. Wiesbaden: Statistisches Bundesamt; 2004. [Google Scholar]
- 8.Robert Koch-Institut. Gesundheit in Deutschland. Gesundheitsberichterstattung des Bundes. Berlin: Robert Koch-Institut; 2006. [Google Scholar]
- 9.Müller-Riemenschneider F, Reinhold T, Berghöfer A, Willich SN. Health-economic burden of obesity in Europe. Eur J Epidemiol. 2008 doi: 10.1007/s10654-008-9239-1. published online DOI 10.1007/s10654-008-9239-1. [DOI] [PubMed] [Google Scholar]
- 10.Sturm R. Increases in morbid obesity in the USA: 2000-2005. Public Health. 2007;121:492–496. doi: 10.1016/j.puhe.2007.01.006. [DOI] [PMC free article] [PubMed] [Google Scholar]
- 11.Herz RP, Unger AN, McDonald M, Lustik MB, Biddulph-Krentar J. The impact of obesity on work limitations and cardiovascular risk factors in the U.S. workforce. J Occup Environ Med. 2004;46:1196–1203. [PubMed] [Google Scholar]
- 12.Lakdawalla DN, Bhattacharya J, Goldman DP. Are the young becoming more disabled? Health Affairs. 2004;23:168–176. doi: 10.1377/hlthaff.23.1.168. [DOI] [PubMed] [Google Scholar]
- 13.Sturm R, Ringel J, Andreyeva T. Increasing obesity rates and disability trends. Health Affairs. 2004;23:1–7. doi: 10.1377/hlthaff.23.2.199. [DOI] [PubMed] [Google Scholar]
- 14.Oberender P, Zerth J. Die Kosten ernährungsabhängiger Krankheiten - eine ökonomische Betrachtung der Adipositas. Diät und Information. 2000;6:194–198. [Google Scholar]
- 15.Sturm R. Increases in clinically severe obesity in the United States, 1986-2000. Health Affairs. 2002;21:245–253. [Google Scholar]
- 16.James WP. The epidemiology of obesity: the size of the problem. J Intern Med. 2008;263:336–352. doi: 10.1111/j.1365-2796.2008.01922.x. [DOI] [PubMed] [Google Scholar]
- 17.Leyk D, Rohde U, Gorges W, Wunderlich M, Rüther T, Wamser P, Essfeld D. Erste Ergebnisse der Studie „Fit-fürs-Leben“: Übergewicht und Bewegungsmangel bei Heranwachsenden und jungen Erwachsenen. Wehrmed Mschr. 2007;51:143–147. [Google Scholar]
- 18.Hölling H, Kamtsiuris P, Lange M, Thierfelder W, Thamm M, Schlack R. Der Kinder- und Jugendgesundheitssurvey (KiGGS): Studienmanagement und Durchführung der Feldarbeit. Bundesgesundheitsbl - Gesundheitsforsch - Gesundheitsschutz. 2007;50:557–566. doi: 10.1007/s00103-007-0216-8. [DOI] [PubMed] [Google Scholar]
- 19.Kurth BM, Rosario Schaffrath A. Die Verbreitung von Übergewicht und Adipositas bei Kindern und Jugendlichen. Bundesgesundheitsbl - Gesundheitsforsch - Gesundheitsschutz. 2007;50:736–743. doi: 10.1007/s00103-007-0235-5. [DOI] [PubMed] [Google Scholar]
- 20.Cole TJ, Bellizzi MC, Flegal KM, Dietz WH. Establishing a standard definition for child overweight and obesity worldwide: international survey. BMJ. 2000;320:1240–43. doi: 10.1136/bmj.320.7244.1240. [DOI] [PMC free article] [PubMed] [Google Scholar]
- 21.Graf G, Tokarski W, Predel HG, Koch B, Dordel S. Overweight and obesity in childhood - how can physical activity help? Phys Educ Sport. 2006;50:54–59. [Google Scholar]
- 22.Leyk D, Rohde U, Gorges W, et al. Physical performance, body weight and BMI of young adults in Germany 2000-2004: Results of the Physical-Fitness-Test Study. Int J Sports Med. 2006;27:642–647. doi: 10.1055/s-2005-872907. [DOI] [PubMed] [Google Scholar]
- 23.Wang Y, Lobstein T. Worldwide trends in childhood overweight and obesity. Int J Pediatr Obes. 2006;1:11–25. doi: 10.1080/17477160600586747. [DOI] [PubMed] [Google Scholar]
- 24.Becker S, Klein T, Schneider S. Sportaktivität in Deutschland im 10-Jahres-Vergleich: Veränderungen und soziale Unterschiede. Dtsch Z Sportmed. 2006;57:226–232. [Google Scholar]
- 25.Rohde U, Erley O, Rüther T, Wunderlich M, Leyk D. Leistungsanforderungen bei typischen Einsatzbelastungen. Wehrmed Mschr. 2007;51:138–142. [Google Scholar]
- e1.Suhrcke M, Nugent RA, Stuckler D, Rocco L. Chronic disease: An economic perspective. London: Oxford Health Alliance; 2006. [Google Scholar]
- e2.Graf C. Das CHILT-Projekt. Dtsch Z Sportmed. 2003;54 [Google Scholar]
- e3.Klaes L, Cosler D, Rommel A, Zens YCK. WIAD-AOK-DSB-Studie II: Bewegungsstatus von Kindern und Jugendlichen in Deutschland. Kurzfassung einer Untersuchung im Auftrag des Deutschen Sportbundes und des AOK Bundesverbandes Deutscher Olympischer Sportbund, Frankfurt a. M. 2003 [Google Scholar]
- e4.Wabitsch M. Kinder und Jugendliche mit Adipositas in Deutschland. Bundesgesundheitsbl - Gesundheitsforsch - Gesundheitsschutz. 2007;47:251–255. doi: 10.1007/s00103-003-0795-y. [DOI] [PubMed] [Google Scholar]
- e5.Bullinger HJ, Jürgens HW, Rohmert W. Handbuch der Ergonomie. Koblenz: Bundesamt für Wehrtechnik und Beschaffung. 2007 [Google Scholar]
- e6.Durnin JVGA, Womersley I. Body fat assessed from total body density and its estimation from skinfold thickness measurements on 481 men and women aged from 16-72 years. Br J Nutr. 1974;32:77–97. doi: 10.1079/bjn19740060. [DOI] [PubMed] [Google Scholar]
- e7.Lampert T. Smoking and Passive Smoking Exposure in Young People - Results of the German Health Interview and Examination Survey for Children and Adolescents (KiGGS) Dtsch Arztebl Int. 2008;105(15):265–271. doi: 10.3238/arztebl.2008.0265. [DOI] [PMC free article] [PubMed] [Google Scholar]
- e8.Müller MJ, Mair H, Mann R. Nationaler Aktionsplan gegen das Übergewicht. Aktuel Ernaehr Med. 2007;32:215–222. [Google Scholar]


