

Abstract
Recently, we reported development of the C57BL/6.NOD-Aec1Aec2 mouse carrying two genetic intervals derived from the NOD mouse. These two genetic regions confer Sjögren's syndrome (SjS)-like disease in SjS-non-susceptible C57BL/6 mice. In an attempt to define the molecular bases underlying onset of dacryoadenitis and subsequently keratoconjunctivitis sicca (or xerophthalmia) in the C57BL/6.NOD-Aec1Aec2 mouse model, we have carried out a study utilizing microarray technology. Using oligonucleotide microarrays, gene expression profiles of lacrimal glands at 4, 8, 12, 16 and 20 weeks of age were generated for C57BL/6.NOD-Aec1Aec2 male mice. Analyses using Linear Models for Microarray Analysis package and B-statistics, 552 genes were identified as being differentially expressed (adjusted p value <0.01 and B <1.5) during the development of SjS-like disease. These 552 genes could be arranged into four clusters, with each cluster defining a unique pattern of temporal expression, while the individual genes within each cluster could be grouped according to related function. Using a pair-wise analysis, temporal changes in gene expressions provided profiles indicating that individual genes were differentially expressed at specific time points during development of SjS. In addition, multiple genes that have been reported to show, either in humans or mouse models, an association with autoimmnity and/or SjS, e.g., ApoE, Baff, Clu, Ctla4, Fas/Fasl, Irf5, Lyzs, Nfkb, Socs3, Stat4, Tap2, Tgfβ1, Tnfa, and Vcam1 were also found to exhibit differential expressions, both quantitatively and temporally. Selecting a few families of genes, e.g., cystatins, cathepsins, metalloproteinases, lipocalins, complement, kallikreins, carbonic anhydrases and tumor necrosis factors, it was noted that only a limited number of family members showed differential expressions, suggesting a restricted glandular expression. Utilizing these genes, pathways of inter-reactive genes have been constructed for apoptosis and fatty acid homeostasis, leading to modeling of possible underlying events inducing disease. Thus, these different approaches to analyze microarray data permit identification of multiple sets of genes of interest whose expressions and expression profiles may correlate with molecular mechanisms, signaling pathways and/or immunological processes involved in the development and onset of SjS in this mouse model, thereby providing new insight into the underlying cause or regulation of this disease.
Keywords: Sjögren's syndrome, keratoconjunctivitis sicca, animal model, microarray, biomarker
Introduction
Sjögren's syndrome (SjS) is a systemic autoimmune disease initially targeting primarily the salivary and lacrimal glands, resulting in xerostomia sicca (dry mouth) and/or keratoconjunctivitis sicca (dry eye) disease(s), respectively (Jonsson et al., 2004). Despite expanding efforts to define the genetic, environmental and immunological bases of SjS, the underlying etiology of this disease remains ill-defined. Over the past couple of decades, a variety of mouse strains, including the NOD mouse, have been developed to study the immuno-pathophysiological nature of SjS. Based on results of studies using NOD mice and various gene knock-out (KO) congenic partner strains of NOD, we have proposed that the development and onset of autoimmune exocrinopathy in this model of SjS is comprised of two mutually distinct steps: (i) an initial lymphocyte-independent phase exhibiting intrinsic problems in exocrine tissue homeostasis or differentiated function, and (ii) the subsequent tissue-specific immunological attack by activated T-cells, B-cells and their products against the targeted salivary and lacrimal glands. Furthermore, this disease process can be divided into at least three distinct temporal and consecutive phases. In Phase 1, aberrant genetic, physiological and biochemical activities, resulting presumably from retarded salivary gland development and increased acinar cell apoptosis, occur between 6-10 weeks of age. In Phase 2, occurring around 10-18 weeks of age, exocrine gland injury is observed concomitant with the appearance of leukocytic infiltrates and evolution of lymphocytic foci (LF) consisting mostly of T and B cell aggregates. In Phase 3, onset of clinical disease as defined by measurable loss of salivary and lacrimal gland secretory function occurs, usually starting between 20-24 weeks of age (Cha et al., 2002b; Nguyen et al., 2007).
Salivary and lacrimal gland dysfunction in SjS is currently thought to result initially from the production of pro-inflammatory cytokines capable of inducing cellular apoptosis and auto-antibodies reactive with the muscarinic acetylcholine and adrenergic receptors, then from a progressive loss of acinar cell mass by an unknown mechanism, but possibly the action of infiltrating T cells. Nevertheless, the pathological changes observed in NOD mice appear to occur as a consequence of altered glandular homeostasis (Cha et al., 2001). Aberrant proteolytic activity, elevated apoptosis, down-regulated epidermal growth factor (EGF) gene expression, and reduced α-amylase activity are commonly observed in NOD mice around 8 weeks of age prior to disease onset and independent of detectable autoimmunity. While the factors driving these alterations remain unknown, this altered glandular homeostasis is hypothesized to be the basis for why autoreactive T-cells eventually develop reactivity against exocrine gland tissue (Robinson et al., 1996). Thus, one might expect that, during the development and onset of SjS, multiple genes, signaling pathways, molecular networks and immunological processes will exhibit temporal and intricate expressions.
Over the past decade, we have obtained considerable information from studies using single-gene KO mice, e.g., Il4, Il10, Ifnγ, C3, and Stat6 gene KOs, thereby revealing the importance of such factors in SjS-like disease (Nguyen et al., 2007). Besides the fact that such an approach is time-consuming, these types of studies are suboptimal for discovering new genes and/or molecular networks underlying the development and onset of SjS-like disease since each factor studied is known to have global effects on the immune system, thereby complicating interpretation. As a result, we recently took advantage of microarray technology to screen differential gene expressions within the submandibular glands of C57BL/6.NOD-Aec1Aec2 mice covering the times at which initial onset of detectable autoimmunity in this mouse model of SjS occurs. Results of that study identified sequential activations of several biological processes and signaling pathways considered important in SjS disease, including IFN-γ and non-mitochondrial apoptosis, endosomal TLRs and their related IRFs, as well as BAFF/APRIL and B cell activation (Killedar et al., 2006).
The C57BL/6.NOD-Aec1Aec2 mouse is a recently generated model of SjS in which the Idd3 region of chromosome 3 and the Idd5 region of chromosome 1 derived from the NOD mouse were bred into the SjS-non-susceptible C57BL/6 mouse, thereby conferring a SjS-like disease susceptibility that mimics that of NOD. This new SjS-susceptible strain is designated C57BL/6.NOD-Aec1Aec2, where Aec1 corresponds to Idd3 (of chromosome 3) and Aec2 corresponds to Idd5 (of chromosome 1) (Brayer et al., 2000; Cha et al., 2002a). In the present study, we have utilized the C57BL/6.NOD-Aec1Aec2 mouse model to carry out a genome-wide and temporal analysis of genes that are differentially-expressed in the lacrimal glands during development and early onset of dacryoadenitis and xerophthalmia. This study is based on the hypothesis that identification of genes exhibiting changes in expression that correlate with disease progression will provide a general snapshot of molecular signaling pathways associated with pathophysiological alterations in the lacrimal glands and subsequent onset of autoimmunity.
Materials and Methods
Animals
C57BL/6.NOD-Aec1Aec2 mice were bred and maintained under SPF conditions within the Department of Pathology's Mouse Facility with oversight by Animal Care Services at the University of Florida, Gainesville. The animals were maintained on a 12 hr light-dark schedule and provided food and acidified water ad libitum. For this study, male mice were euthanized either at 4, 8, 12, 16 or 20 weeks of age. Euthanasia was carried out by cervical dislocation after deep anesthetization with isoflurane. There are no indications that this procedure affects physiological function of the exocrine glands. Both the breeding and use of these animals for the present studies were approved by the University of Florida IACUC.
Preparation of RNA for detection of differentially expressed genes in microarray analyses
Total RNA was isolated from one extra-orbital lacrimal gland freshly excised from individual C57BL/6.NOD-Aec1Aec2 mice (n=4-6 per age group) at either 4, 8, 12, 16 or 20 weeks of age using the RNeasy Mini-Kit (Qiagen, Valencia, CA), as per the manufacturer's protocol. The second lacrimal glands from each mouse were snap-frozen and individually stored at -80°C for backup purposes. To account for any asynchrony of SjS-like disease within C57BL/6.NOD-Aec1Aec2 mice, each age group was derived from at least two litters. Hybridizations were carried out on each of the 26 individual RNA samples using Affymetrix GeneChip Mouse Genome 430 2.0 Arrays per maufacturer's instructions. Each GeneChip contains 45,000 probe sets which analyze the expression level of over 39,000 transcripts and variants from over 34,000 well characterized mouse genes.
Differential gene expression analysis
Microarray data were normalized using the “robust multi-array average” (GCRMA) algorithm and analyzed using the LIMMA (Linear Models for Microarray Analysis) package from the R Development Core Team (The R Project for Statistical Computing, http://www.r-project.org) to perform differential expression analyses. LIMMA takes into account the correlation between replicates and uses the empirical Bayes approach which gives stable inference for relatively small number of arrays (Smyth, 2005). In this study, the “fdr” method to adjust the p-values for multiple testing (Benjamini and Hochberg, 1995) was used to control the false discovery rate. Since the data represent 5 equally spaced time points, multiple models were used to identify the temporal patterns of gene expression. These included the linear fit (degree = 1), quadratic fit (degree = 2), cubic fit (degree = 3) and quartic fit (degree = 4) regression models. B-statistics (the log of the odds of a gene showing either positive or negative trends over time) were calculated for each gene. Genes exhibiting a B-statistic >1.5 were considered differentially expressed in the current analysis. As shown in Table 1, this represents a level of probability that any specific gene is differentially expressed >82%. Duplicate genes, when present, were removed and their expression levels averaged across the duplicates. Genes exhibiting a B-statistic >1.5 were considered differentially expressed.
Table 1.
The effect of B statistics cutoffs on probability and number of genes selected
| B-statistics cutoffs | Odds of differential expression | Probability of being differentially expressed | Number of genes |
|---|---|---|---|
| B = 2.0 | 7.389 | (7.389/1+7.389)= 0.881 | 427 |
| B = 1.5 | 4.482 | (4.482/1+4.482)= 0.818 | 552 |
| B = 1.0 | 2.718 | (2.718/1+2.718)= 0.731 | 714 |
| B = 0.0 | 1.000 | (1.00/1+1.00)= 0.500 | 1202 |
Verification of selected genes by semi-quantitative RT-PCR
Total RNA, prepared from freshly explanted lacrimal glands using the RNeasy Mini Kit (Qiagen, Valencia, CA), was used to synthesize cDNA. In brief, each synthesis was carried out using RNA (4 μg), Superscript II reverse transcriptase (Invitrogen Life Technologies, Carlsbad, CA), and pd(T)12-18 oligomeric DNA (Amersham Pharmacia, Piscataway, NJ). The cDNA was quantified by spectrophotometry and semi-quantitative PCRs performed using 1 μg of cDNA as template. Following an initial denaturation at 94°C for 4 min, each PCR was carried out for 40 cycles consisting of 94°C for 1 min, optimal annealing temperatures for 45 sec, and 72°C for 2 min. The forward and reverse sequences of each primer set were: Akt1, F:AGGATGTTTCTACTGTGGGCAGCA, R:TGTCTCTGAACAGCATGGGACACA ApoE, F:AGATGGAGGAACAGACCCAGCAAA, R:TGTTGTTGCAGGACAGGAGAAGGA Ctsb, F:AGATTTGGGCGATGGCCTTCAAAC, R:ATGTGCTTGCTACCTTCCTCTGGT Fdft1, F:AGTCGCAAGGATGGAGTTCGTCAA, R:AACGTAGTGGCAGTACTTGTCCCA and G3pdh, F:GCCATCACTGCCACCCAGAAG, R:GTCCACCACCCTGTTGCTGCA PCR products were size separated by electrophoresis using a 0.9% agarose gels and visualized with ethidium bromide staining. PCR band intensities were compared to G3pdh using the Flourchem Imaging densitometer system (Alpha Innotech Corporation; San Leandro, CA). Relative band intensities were determined by dividing the intensity of selected genes mRNA by the density of G3pdh band.
Cluster analysis
Cluster Analysis was performed for grouping differentially expressed genes exhibiting similar expression patterns. Differentially expressed genes were analyzed using the HPCluster program. HPCluster is a two-stage algorithm: the first stage is based on BIRCH (Balanced Iterative Reducing and Clustering using Hierarchies), while the second stage is a conventional k-Means. With BIRCH, a tree of clustered features defining the partitioning of high dimensional space was generated, followed by a conventional k-Means clustering of each cluster feature obtained with BIRCH.
Gene ontology analysis
Associations of the differentially expressed genes with biological processes, molecular functions and pathways were annotated using the PANTHER (Protein ANalysis THrough Evolutionary Relationships) classification system (http://www.pantherdb.org, (Thomas et al., 2003)). To determine if the observed number of gene counts exceeded the expected counts, one-tailed p-values for enrichment of a particular biological process, molecular function or pathway were calculated using the standard Fisher's exact test.
Pathway analysis
Pathway Studio Version 5.0 software (Ariadne Genomics) and ResNet mammalian database were used to construct pathways depicting the molecular interactions based on the differentially expressed sets of genes. ResNet is a database of molecular interactions and biological relationships extracted from the biomedical literature. Analyses of the potential pathways were manually curated to identify validated data. Partial summaries of the literature references used for extracting these interactions are available as a supplementary file (PathwayRef.html).
Results
The present study was designed to define gene expression profiles within the lacrimal glands of C57BL/6.NOD-Aec1Aec2 mice at five time points representing a pre-disease stage (4 weeks), the early pre-clinical stage (8 weeks), the initial influx of leukocytes into the lacrimal glands (12 weeks), the early clinical phase of autoimmunity (16 weeks), and the early onset of clinical SjS-like disease characterized by secretory dysfunction (20 weeks). C57BL/6.NOD-Aec1Aec2 mice exhibit both the pathophysiological characteristics and reduced secretory responses observed with NOD mice during development and onset of SjS-like disease (Brayer et al., 2000; Cha et al., 2002a; Nguyen et al., 2007); however, the disease process is not fully synchronized between individual mice. Nevertheless, by examining these five time points using 4-6 individual mice at each time point, genes identified as being differentially expressed are hypothesized to correlate with one or more manifestations of aberrant glandular homeostasis, initiation of autoimmunity, and subsequent onset of lacrimal gland secretory dysfunction.
Differential gene expressions in lacrimal glands of C57BL/6.NOD-Aec1Aec2 mice during development and onset of SjS-like disease
Although many genes of C57BL/6.NOD-Aec1Aec2 mice appear to be differentially expressed in the lacrimal glands at any particular time point, 552 specific genes were identified as being differentially expressed globally based on our analyses using the Linear Models for Microarray Analysis software and B-statistics. As summarized in the heat-map shown in Figure 1, these 552 genes can be tentatively divided into one of 4 highly reproducible clusters, each of which exhibits a specific temporal gene expression profile. Also presented are plots, based on HPCluster analysis, showing the average gene expressions for each cluster of genes at the 5 time points examined. For quick verification of results obtained from the microarrays, 4 genes (Akt1, ApoE, Ctsb and Fdft1) were selected randomly for semi-quantitative RT-PCR analysis as they represented genes that were expressed at high levels, low levels and intermediate levels in the lacrimal glands of C57BL/6J.NOD-Aec1Aec2 mice at the various ages tested. The expression of these genes in the lacrimal glands relative to G3pdh proved highly consistent with the relative expressions obtained from the microarrays (data not shown), thus validating the general expressions obtained with the microarrays.
Figure 1.
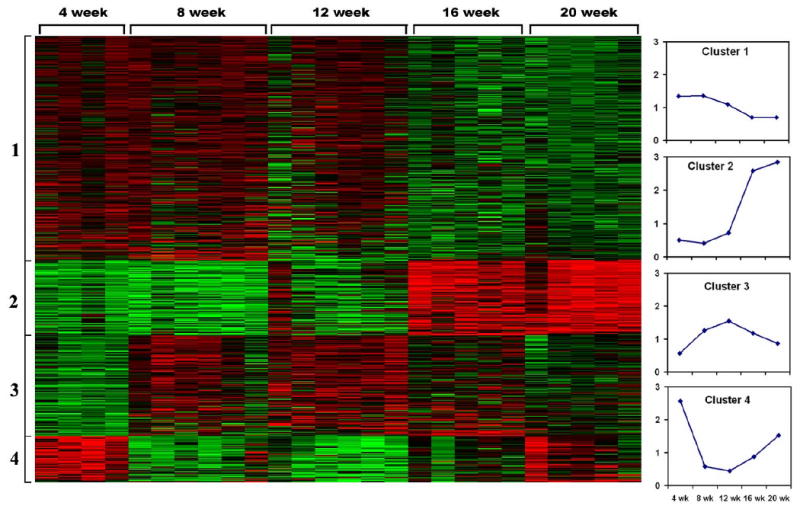
Heat-map of differentially expressed genes (n = 552) in the lacrimal glands of individual C57BL/6.NOD-Aec1Aec2 male mice at 4, 8, 12, 16 and 20 weeks of age (n = 4-6 mice per age group), grouped into 4 clusters based on temporal expression profiles. Up-regulated gene expressions are shown in red, down-regulated gene expressions are shown in green.
Biological, molecular and functional activities of the differentially expressed genes
Of the 552 differentially expressed genes identified by microarray analysis, 539 could be associated with biological pathways (Table 2A), biological processes (Table 2B) and/or molecular functions (Table 2C) using the PANTHER classification system. Each function listed in these tables reached significance of p<0.05, although additional functional activities not reaching this subjective cut-off level of significance could be identified, e.g., PDGF, VEGF and EFG (Sup File: diff_genes_functions.xls). Pathways appearing in Table 2A of special note for SjS include T and B cell activation, Fas signaling and apoptosis, as well as IFN-γ and integrin signaling pathways. Each of these areas has been identified as possible contributors to exocrine gland dysfunction in this mouse model, as well as human SjS. Similarly, biological processes identified in Tables 2B & 2C of interest include protein, carbohydrate, lipid and fatty acid metabolism, as well as apoptosis. While acinar cell apoptosis has long been considered an important event in onset of SjS, recent gene mapping data have indicated that the genetic region of chromosome 1 conferring SjS-susceptibility on NOD and NOD-derived mice, as well as C57BL/6.NOD-Aec1Aec2 mice, contains multiple genes that regulate homeostasis of fatty acids, high density lipids and lipoproteins, and that these mice develop lipid deposits within the lacrimal glands often correlating with onset of dacryoadentitis (Nguyen et al., 2006b).
Table 2. Pathways, biological processes and molecular functions represented in 552 differentially expressed genes with highest statistical discrimination.
| Classifications | # Genes | % Genes | p-value |
|---|---|---|---|
| A. Enriched Pathways | |||
| B cell activation (P00010) | 8 | 1.50% | 0.0004 |
| FAS signaling pathway (P00020) | 5 | 0.90% | 0.0013 |
| Apoptosis signaling pathway (P00006) | 10 | 1.90% | 0.0024 |
| Ubiquitin proteasome pathway (P00060) | 7 | 1.30% | 0.0025 |
| Salvage pyrimidine ribonucleotides (P02775) | 3 | 0.60% | 0.0028 |
| T cell activation (P00053) | 9 | 1.70% | 0.0038 |
| Hypoxia response via HIF activation (P00030) | 4 | 0.70% | 0.0040 |
| Integrin signalling pathway (P00034) | 11 | 2.00% | 0.0095 |
| Interferon-gamma signaling pathway (P00035) | 3 | 0.60% | 0.0216 |
| Parkinson disease (P00049) | 6 | 1.10% | 0.0279 |
| Ras Pathway (P04393) | 5 | 0.90% | 0.0297 |
| Huntington disease (P00029) | 8 | 1.50% | 0.0406 |
| Angiogenesis (P00005) | 9 | 1.70% | 0.0486 |
| PDGF signaling pathway (P00047) | 7 | 1.30% | 0.0549 |
| VEGF signaling pathway (P00056) | 4 | 0.70% | 0.0558 |
| EGF receptor signaling pathway (P00018) | 6 | 1.10% | 0.0616 |
| B. Biological processes | |||
| Apoptosis (BP00179) | 26 | 4.80% | 1.18E-05 |
| Intracellular protein traffic (BP00125) | 40 | 7.40% | 1.29E-05 |
| Protein metabolism and modification (BP00060) | 104 | 19.30% | 2.73E-05 |
| Amino acid metabolism (BP00013) | 15 | 2.80% | 6.49E-05 |
| Protein targeting and localization (BP00137) | 12 | 2.20% | 0.0008 |
| Electron transport (BP00076) | 15 | 2.80% | 0.0029 |
| Carbohydrate metabolism (BP00001) | 21 | 3.90% | 0.0049 |
| Lipid, fatty acid and steroid metabolism (BP00019) | 27 | 5.00% | 0.0073 |
| Transport (BP00141) | 40 | 7.40% | 0.0082 |
| Oncogenesis (BP00281) | 16 | 3.00% | 0.0142 |
| Cell cycle (BP00203) | 28 | 5.20% | 0.0211 |
| C. Molecular functions | |||
| Ligase (MF00170) | 24 | 4.50% | 7.14E-06 |
| Oxidoreductase (MF00123) | 28 | 5.20% | 0.0005 |
| Kinase (MF00107) | 28 | 5.20% | 0.0006 |
| Membrane traffic protein (MF00267) | 15 | 2.80% | 0.0033 |
| Transferase (MF00131) | 31 | 5.80% | 0.0055 |
| Select regulatory molecule (MF00093) | 35 | 6.50% | 0.0182 |
| Synthase and synthetase (MF00118) | 10 | 1.90% | 0.0205 |
| Isomerase (MF00166) | 7 | 1.30% | 0.0419 |
| Transporter (MF00082) | 20 | 3.70% | 0.0489 |
To identify the various biological processes linked with genes grouped by cluster, gene ontology analyses were performed separately for each cluster and the results presented in Table 3. As above, the listed biological functions are those that reached a significance of p<0.05, despite the fact that additional functional activities were identified that did not reach this cut-off level of significance (a few of which are listed). For cluster 1, consisting of 274 genes and exhibiting an up-regulated gene expression during the early stages of disease development, the biological processes identified tend to be altered biochemical and physiological activities. Likewise, a similar pattern is observed for the 123 genes grouped in cluster 3, except the peak differential gene expression tends toward a slightly later time-point than that observed for genes in cluster 1 (12 weeks versus 4-8 weeks of age, respectively) In contrast, for cluster 2 which consists of 86 genes and exhibits a strong up-regulated gene expression at the later stages of disease development, the major biological processes are associated with autoimmunity and lipid, steroid and fatty acid metabolism. Lastly, for cluster 4, consisting of 56 differentially expressed genes that are highly up-regulated early (4 weeks of age) and again late (20 weeks of age), the major biological process is apoptosis. This latter observation corresponds to several published reports (see Nguyen et al., 2007) indicating that a wave of acinar cell apoptosis occurs in the exocrine glands of SjS-susceptible mice both prior to development of autoimmunity and during onset of glandular dysfunction.
Table 3. Biological processes of differentially expressed genes of each cluster.
| Classification of Clustered Genes | # Genes | % Genes | p-value |
|---|---|---|---|
| Cluster 1 (274 differentially expressed genes) | |||
| Protein metabolism and modification (BP00060) | 69 | 19.30% | 1.65E-08 |
| Intracellular protein traffic (BP00125) | 25 | 7.40% | 1.32E-05 |
| Amino acid metabolism (BP00013) | 11 | 2.80% | 2.01E-05 |
| Protein targeting and localization (BP00137) | 7 | 2.20% | 0.0040 |
| Carbohydrate metabolism (BP00001) | 12 | 3.90% | 0.0108 |
| Transport (BP00141) | 22 | 7.40% | 0.0152 |
| Sulfur metabolism (BP00101) | 4 | 0.70% | 0.0181 |
| Miscellaneous (BP00211) | 5 | 1.30% | 0.0200 |
| Apoptosis (BP00179) | 10 | 4.80% | 0.0292 |
| Nucleoside, nucleotide and nucleic acid metabolism (BP00031) | 46 | 14.70% | 0.0354 |
| Cell cycle (BP00203) | 15 | 5.20% | 0.0448 |
| Lipid, fatty acid and steroid metabolism (BP00019) | 10 | 5.00% | 0.2873 |
| Cluster 2 (86 differentially expressed genes) | |||
| Immunity and defense (BP00148) | 16 | 18.60% | 0.0002 |
| Intracellular protein traffic (BP00125) | 8 | 9.30% | 0.0103 |
| Lipid, fatty acid and steroid metabolism (BP00019) | 7 | 8.10% | 0.0133 |
| Transport (BP00141) | 9 | 10.50% | 0.0238 |
| Apoptosis (BP00179) | 4 | 4.70% | 0.0719 |
| Cluster 3 (123 differentially expressed genes) | |||
| Electron transport (BP00076) | 6 | 4.90% | 0.003706 |
| Carbohydrate metabolism (BP00001) | 8 | 6.50% | 0.003715 |
| Apoptosis (BP00179) | 7 | 5.70% | 0.007357 |
| Oncogenesis (BP00281) | 6 | 4.90% | 0.013014 |
| Coenzyme and prosthetic group metabolism (BP00081) | 3 | 2.40% | 0.037304 |
| Lipid, fatty acid and steroid metabolism (BP00019) | 7 | 5.70% | 0.071052 |
| Cluster 4 (56 differentially expressed genes) | |||
| Apoptosis (BP00179) | 5 | 8.90% | 0.003476 |
| Cell structure and motility (BP00285) | 6 | 10.70% | 0.018519 |
| Other metabolism (BP00289) | 4 | 7.10% | 0.029781 |
| Cell cycle (BP00203) | 5 | 8.90% | 0.039548 |
| Signal transduction (BP00102) | 11 | 19.60% | 0.206816 |
| Lipid, fatty acid and steroid metabolism (BP00019) | 3 | 5.40% | 0.226915 |
Phase-specific gene expression in the lacrimal glands of C57BL/6.NOD-Aec1Aec2 mice during development of SjS-like disease
Since these microarray data represent differential gene expressions that cover the full mouse genome and, at the same time, span temporally the chronic progressive development and early onset of autoimmune-mediated dacryoadenitis and xerophthalmia in C57BL/6.NOD-Aec1Aec2 mice, any gene can be examined for changes in expression of its transcript profile. As described above, functional pathways identified by the clustering of differentially expressed genes are markedly distinct over the five selected time points examined. Thus, it might be expected that individual genes will show mutually distinct expression kinetics, possibly providing insight into the changing patho-physiological nature of the lacrimal gland and/or the inflammatory responses.
Although studies linking specific genes with SjS are still limited (and even fewer for xerophthalmia per se), several genes or gene products have been identified as being either associated with SjS, potentially important during development of SjS, and/or associated with diseases linked to SjS, such as SLE and RA. These include such genes as ApoE (Pertovaara et al., 2004), Clu (Tsubota, 2007), Ctla4 (Graham et al., 2006), Fas/Fasl (Bolstad et al., 2000), Gstim1 (Morinobu et al., 1999), Il7r (Teutsch et al., 2003), Ifih1 (Martinez et al., 2008), IgG (Kumagai et al., 1997), Irf5 (Miceli-Richard et al., 2007), Lyzs (Kumagai et al., 1997), Mbl (Wang et al., 2004), Ptpn22 (Lee et al., 2005), Sh2b3 (Lappalainen et al., 2008), Stat4 (Remmers et al., 2007), Tap2 (Kumagai et al., 1997), Tgfβ1, Tnfa (Gottenberg et al., 2004), and Tnfaip3 (Koczan et al., 2008). Using a pair-wise analysis, a surprisingly large number of these genes associated with human rheumatic diseases exhibited temporal changes in their expressions in the lacrimal glands of C57BL/6.NOD-Aec1Aec2 mice despite the fact these mice represent genetically only a single individual. Results, presented in Figure 2A, show that different sets of these genes are maximally expressed at different time points during development of disease relative to their expressions in lacrimal glands from 4 week old mice. For example, Fas, Ifih1, Irf5, Sh2bp1, Tgfβ1 (8 weeks), ApoE, Clu, Il10rb, Il7r, Lyzs (12 weeks), Gstm1, Tap2 (16 weeks), and Ig-k, Ig-h, and Ig-j (20 weeks) are all up-regulated, although some much stronger than others. At the same time, several of these genes, e.g., Ctla4, Mbl2, Ptpn22, Stat4, Tnfa and Tnfaip3 showed no changes in their expression profiles relative to their 4 week expressions (only data on Mbl2 shown). These data suggest that this full set of diverse genes reportedly associated with SjS and other autoimmune diseases may be species-specific, organ-specific and/or disease-specific or non-specific. Of interest, however, one gene that has recently been reported to be a potential new biomarker for keratoconjunctivitis sicca in humans is clusterin (Tsubota, 2007). As shown in Figure 2A, the clusterin gene, Clu, in contrast to clusterin-associated protein-1 gene, Cluap1, is highly up-regulated during the entire time-frame for development of SjS-like disease in C57BL/6.NOD-Aec1Aec2 mice, with peak expression at 12 weeks of age. Like the Ig-associated gene expressions, Clu remains strongly expressed through 20 weeks of age, or onset of disease, thereby being detectable during the clinical disease state. Similar profiles were observed with ApoE (Apolipoprotein E) and Lyzs (lysozyme).
Figure 2.

Temporal changes in gene expressions in the lacrimal glands of C57BL/6.NOD-Aec1Aec2 mice for genes that are associated with SjS, SLE and/or RA in humans (A) and genes considered important for disease development in the salivary glands of NOD and NOD-derived mice (B). Expression profiles are presented for these genes at 8, 12, 16 and 20 weeks of age relative to 4 weeks of age.
Two studies carried out with salivary glands from NOD (Delaleu et al., 2008) or C57BL/6.NOD-Aec1Aec2 (Killedar et al., 2006) mice have already identified a significant number of proteins and genes, respectively, that are differentially expressed. A few of these genes thought to be markers of the disease state include Abpb, ApoA1, Baff (Blys), Ccl11, Ccr7, Cxcr3, Cxcr4, Egf, Fgl, Il10r, Isg, Ltb, Ltbr, Nfkβia, Pgf, Rac1, Raf1, Socs3, Stat6, Traf3, and Vcam1. As presented in Figure 2B, many of these genes are also differentially expressed at specific time points relative to their expression in lacrimal glands from 4 week old mice. For example, at the 8 week time point, ApoA1bp (but not ApoA1), Isg20, Ltbr, Pgf, Rac1, and Traf3 reach maximum expression levels. At the 12 week time point, maximum expression levels are reached for Abpb, Casp8, Cas8aipb, Egf, and Ltb, while at 16 weeks Fgl2, Nfkβia, Socs3 and Vcam1 exhibit maximum expressions. In each case, these genes show relatively rapid declines in expression levels thereafter, many returning to baseline or below baseline by 20 weeks of age when glandular dysfunction is observed. This is especially true of genes expressed during the early stages of disease development.
Differential expression of selected genes within gene families
An interesting observation derived from these microarray data is the fact that individual genes within a gene family can exhibit markedly different expression profiles, not only quantitatively but also temporally. This is clearly demonstrated in the comparative expressions of several gene families thought to be important markers of SjS, including cystatins (Figure 3A), cathepsins (Figure 3B), matrix metalloproteinases (Figure 3C), lipocalins (Figure 3D), various complement (C) components (Figure 4), the chemokines (Figure 5), kallikreins (Figure 6A), carbonic anhydrases (Figure 6B) and members of the TNF super-family of proteins (Figure 6C). Since these families of genes encode factors that tend to regulate the gene expressions of many other families, and the fact that only a relatively few genes within a family are differentially expressed, these genes must be considered potentially important for disease development, even if they have not been specifically identified within the 552 genes singled out above by statistical considerations. Of special note, for example, are the different expression profiles for cathepsin S and cathepsin B in relationship to the inhibitor molecule cystatin C, with cathepsin S apparently being resistant to the regulatory action of cystatin C.
Figure 3.

Temporal gene expression of cystatins (A), cathepsins (B), matrix metalloproteinases (C) and lipocalins (D) in the lacrimal glands of C57BL/6.NOD-Aec1Aec2 mice at 8, 12, 16 and 20 weeks of age relative to 4 weeks of age.
Figure 4.

Temporal gene expression of the C1q-associated (A) and other components (B) of complement in the lacrimal glands of C57BL/6.NOD-Aec1Aec2 mice at 8, 12, 16 and 20 weeks of age relative to 4 weeks of age.
Figure 5.

Temporal gene expressions of chemokine-associated Ccl (A), Cxcl (B) and Ccr (C) genes in the lacrimal glands of C57BL/6.NOD-Aec1Aec2 mice at 8, 12, 16 and 20 weeks of age relative to 4 weeks of age.
Figure 6.

Temporal gene expression of various members of the kallikrein (A), carbonic anhydrase (B) and tumor-necrosis factor (C) gene families in the lacrimal glands of C57BL/6.NOD-Aec1Aec2 mice at 8, 12, 16 and 20 weeks of age relative to 4 weeks of age.
Modeling molecular interactions defined by the differentially expressed genes
A major goal of microarray studies is to construct multi-genic pathways depicting possible molecular interactions that define pathogenic activities based on related sets of differentially expressed genes. To achieve this, analyses were performed using Pathway Studio Version 5.0 software and the ResNet mammalian database. Interactions identified, based on any given set of genes, were manually curated by evaluating each ResNet description from which the relationship or interaction was derived. Validated interactions were collated for final pathway visualizations. By first selecting biological processes from those listed in Table 2, then genes within those biological processes with high statistical significances, as listed in Table 3, molecular interactions were constructed to show possible inter-connective pathways encompassing some of the differentially expressed genes within a clustered group. One inter-connective biological process of particular interest for SjS is apoptosis, and in the current study 26 genes were identified having a cumulative statistical p value <0.000012. Apoptosis within the lacrimal and salivary glands is considered an important factor in initiating subsequent autoimmunity (Zoukhri, 2006). Interestingly, these apoptosis-linked genes appear mainly within cluster groups 1, 3 and 4, thus subsets of these genes are being differentially expressed throughout the development of disease.
In fact, several genes even appear within cluster 2, when glandular dysfunction is known to occur, although this subset does not reach statistical significance (p<0.072). A cautionary note, however, is the fact that genes within apoptotic pathways can also be present in cell survival pathways, e.g., the NF-kβ pathway. One software-generated inter-relationship of these apoptosis-related genes is presented in Figure 7. Although activation/regulation of these interactive pathways can be initiated by a number of cytokines known to be expressed in the exocrine glands of NOD and NOD-derived strains, e.g., TNF-α, IL-1β, CSF2 (GM-CSF), IFN-γ, IL-2, IL-18, and IL-6, which cytokine or set of cytokines initiates the process is unknown. Two of these cytokines, IL-6 and TNF-α, possess the capability of exerting either an anti-apoptotic or a pro-apoptotic effect. IL-6 is a major inflammatory cytokine shown to down-regulate expression of the anti-apoptotic molecule clusterin, but clusterin remains highly up-regulated throughout the development of SjS-like disease. IL-6 is also a major regulator of CD4+ TH17 cells, recently shown to be present in the salivary glands of these SjS-susceptible mice at onset of disease (Nguyen et al., 2008). In contrast, TNF-α is capable of activating BIRC-2 (and BIRC-3), factors that via their binding to TRAF-1 and TRAF-2 can induce expression of NF-kβ and subsequently reduced caspase activity. However, Birc2 and Birc3 are highly reduced in the lacrimal glands of mice at their later ages and this potentially could promote apoptosis seen at the later stages of SjS. On the other hand, IFN-γ, GM-CSF, IL-2, and IL-18 can up-regulate expression of caspase-8 leading to activation of caspase-3. Perhaps the most striking observation seen in these curated pathways is the possible involvement of Akt, an anti-apoptotic serine/threonine kinase. Each of the inflammatory cytokines can apparently channel to the Akt molecule. Activated Akt is capable of phosphorylating many downstream molecules such as caspase-9, Forkhead, Bad, and p21 to promote cell survival. However, in the absence of phosphorylation, these downstream effectors are not activated, leading to increased apoptosis. Although the relative importance of the Akt pathway in SjS remains ill-defined, the microarray analyses revealed that Akt and many of its associated genes are significantly reduced at each time point analyzed relative to 4 weeks. A reduced Akt activity would lower the threshold for apoptosis. Thus, while pathway construction may identify important genes and/or genetic mechanisms that can give rise to hypotheses, how a specific pathway functions will require considerably more analysis.
Figure 7.
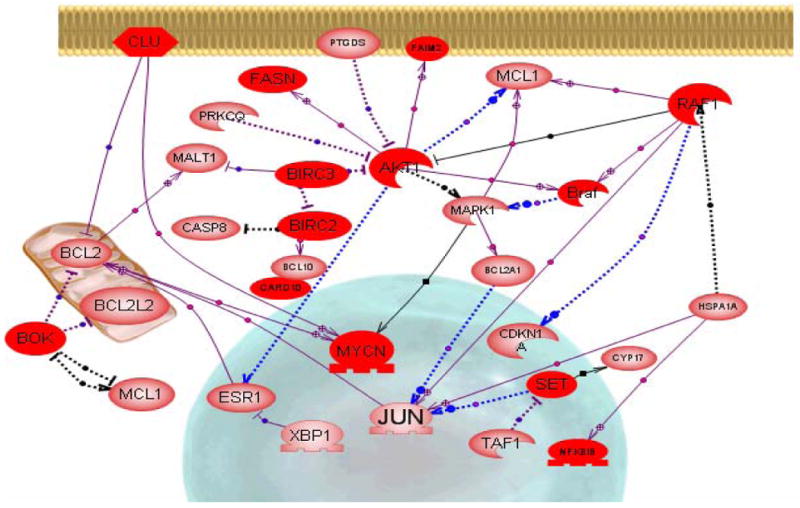
The inter-relationships of genes associated with apoptosis differentially expressed in the lacrimal glands of C57BL/6.NOD-Aec1Aec2 mice. The inter-relationships were created by Pathway Studio Version 5.0 software using the ResNet mammalian database. Interactions identified were manually validated and collated for final pathway visualization.
Discussion
With the present study, we have applied microarray technology to identify genes whose temporal expressions are differentially regulated during development and early onset of dacryoadenitis and xerophthalmia in the NOD-congenic C57BL/6.NOD-Aec1Aec2 mouse model of SjS. Previous investigations of C57BL/6.NOD-Aec1Aec2 mice led to the concept that the Aec2 region on chromosome 1 tends to regulate the numerous pre-disease-associated patho-physiological changes that occur in the salivary and lacrimal glands during the early stages of disease, while the Aec1 region on chromosome 3 controls the activation of the autoimmune response leading to clinical disease (Brayer et al., 2000; Cha et al., 2002a). Overall, then, C57BL/6.NOD-Aec1Aec2 mice represent an excellent model for identifying candidate genes responsible for both the early development and subsequent onset of SjS-like disease. However, very few genes that were identified as differentially expressed actually reside within either the Aec1 or Aec2 genetic regions, whereas the vast majority are scattered throughout the genome. This raises serious questions about what might be a primary candidate gene regulating development and onset of SjS versus what genes represent activations of downstream secondary events.
Results presented herein provide two facets of a genomic microarray approach to understanding the underlying immuno-pathophysiological nature of SjS, and autoimmune diseases in general. First, global genomic analyses of differentially-expressed genes during the development and onset of clinical disease permits an extensive overview of biological processes and gene interactions revealing potentially important pathways even when many genes within a particular pathway may not exhibit altered expression. Examples of this include the up-regulation of genes involved in apoptosis, B cell activation and homeostasis of lipid, lipoprotein and fatty acid metabolism, three biological processes that are considered important parameters in lacrimal gland dysfunction. Second, identification of individual genes that exhibit dysregulation at specific phases of disease may point to additional candidate genes regulating down-stream pathologic consequences. Examples of this include genes encoding C1q, MMP-3, Cathepsin S, Kallikrein 9 or 16, and CCL-9. Despite the fact that the present study is merely an initial foray into a temporal genomic analysis of differentially-expressed genes in SjS, results support many previous concepts proposed to explain onset of exocrine gland dysfunction. In addition, many new biological processes of potential interest have been identified that require further review. However, it is important to note that the present analysis represents a global and temporal profile of physiological, biochemical, immunological and cellular changes that occur from both changes in age and disease development, as we have not, in this study, subtracted out differential gene expressions that might be occurring naturally in non-disease lacrimal glands. This will require a similarly designed study to identify changes that occur in lacrimal glands of the comparative C57BL/6J parental strain. Such studies may narrow further the genes that are disease-associated, even though it is highly possible that the disease process may alter normal age-dependent pathways, as well.
Although microarray data permits cataloging a multitude of genes that are differentially expressed, perhaps one of the more interesting results highlighted by the present study is the ability of the microarray analyses to demonstrate the rapidly changing gene expressions during the chronic progression of disease development and subsequent onset of clinical SjS, or exocrine gland dysfunction. Somewhat surprisingly, most genes exhibiting a statistically significant differential expression were up-regulated, not only at a specific time point during disease development, but for a very limited time-frame. Furthermore, a large number of genes that exhibited strong differential expressions had maximal expression just prior to, or at initiation of, detectable inflammation, i.e., 8-12 weeks of age. This might be expected considering the numerous aberrant biochemical and physiological activities observed in the lacrimal and salivary glands occurring prior to and independent of disease onset. As a consequence, a quick look at the expression profiles reveals that at time of clinical disease, virtually all gene actions are no longer up-regulated, suggesting considerable patho-physiological activities within the lacrimal gland tissue prior to decreased tear secretion rates. Of note, these gene expression patterns mimic our previous studies delineating disease in the NOD, NOD-derived and C57BL/6.NOD-Aec1Aec2 mouse models where the SjS-like disease could be divided into several phases of disease development based on predictable patho-physiological activities, initiation of glandular inflammation and subsequent immune-mediated acinar cell dysfunction. Thus, a necessary task for the future will be to correlate these temporal changes in gene expressions with specific temporal changes in the patho-physiological and immunological observations. One great example of this is the expression profiles of the Ig genes (Figure 2A) where their expressions correlate perfectly with the appearance, expansion and persistence of B cells within the lacrimal glands.
The analyses presented in the current study are based on two thought processes. The first is strictly the identification of genes that are differentially expressed based on statistical evaluations across the development of disease. For the current study, we specifically chose a cut-off value of B-statistics = 0.05 that identified 552 genes with a probability >80% that these genes are differentially expressed. These were considered genes of possible interest identified in an unbiased manner. The second process, however, was to perform a pair-wise analysis in which each gene expression at 8, 12, 16 and 20 weeks was compared to its expression at 4 weeks, an age-point considered pre-disease. This analysis was used to determine genes that were up-regulated during the development and onset of SjS and were considered genes of possible interest for a specific biological process associated with disease onset. One drawback (or bias) to this latter analysis is the assumption that nothing of interest is occurring at 4 weeks of age in the lacrimal gland, a potentially naïve assumption. Nevertheless, this pair-wise analysis revealed individual genes often belonging to a gene family that exhibited temporal changes in expression. Although our focus on genes that were down-regulated in the current analysis is relatively limited, such genes must be considered genes of interest in development of interactive pathways, as discussed for Figure 8 below.
Figure 8.

Schematic showing inter-relationships of clustered genes associated with fatty acid, lipid and lipoprotein homeostasis based on differentially-expressed genes identified in lacrimal glands of C57BL/6.NOD-Aec1Aec2 mice. Associations of the differentially-expressed genes to fatty acid, lipid and lipoprotein homeostasis were annotated using Pathway Studio and PANTHER softwares.
In this report, we have selected several gene families that, by temporal pair-wise comparisons, indicate restricted differential expressions among the individual genes of each family. These gene families include C1q and complement, the chemokines, carbonic anhydrases, kallikreins and TNF. Although several reports have indicated a strong relationship between C1q polymorphisms and SLE in humans (Botto and Walport, 2002), the role of complement in SjS remains, at best, speculative. Our recent studies in NOD and C57BL/6.NOD-Aec1Aec2 mice indicate a critical role for C3 in development of salivary and lacrimal gland dysfunction (Nguyen et al., 2006a). Results from the present microarray studies indicate that several members of the C1q family of genes, especially transcripts of C1qα, C1qβ and C1qγ, were strongly up-regulated, C1qbp weakly up-regulated, while all other associated members remained unchanged. Analysis of other complement components revealed that C2 maintained a fairly constant expression over time, as expected, C3 and C4 showed a bimodal up-regulated response, while expressions of C6 through C9 were unchanged. The latter observation suggests that the complement membrane attack complex plays little or no role in SjS-associated lacrimal gland disease, as might be predicted from the high levels of the complement membrane attack complex inhibitor, clusterin.
Recently, Delaleu et al. (Delaleu et al., 2008) reported that several CCL chemokines, e.g., 2, 5, 7, 9, 19 and 22, and CXCL chemokines, e.g., 5 and 10, were differentially expressed in sera and/or saliva of NOD mice compared to levels observed in BALB/c mice, suggesting these proteins could be used as biomarkers since they correlated with the state of hyposalivation. The most prevalent Ccl gene transcripts in the lacrimal glands are Ccl8 and Ccl9, and except for a small elevation in Ccl6, the other genes for CCL proteins remained temporally unchanged. With respect to the Cxcl family of genes, weak up-regulation was seen for Cxcl1, Cxcl9, Cxcl10 and Cxcl12, while only one member of the Ccr family of genes, Ccrl1, exhibited an up-regulated expression which increased constantly over time. The expression of both CXCL12 and MMP-3 has been shown to be regulated by IL-4, and all three factors are often up-regulated in a synchronized fashion. In the lacrimal gland, both Cxcl12 and Mmp3 are up-regulated at the time when IL-4 has been shown to be critical for SjS progression (Gao et al., 2006).
Our recent proteomics studies (Doyle et al., 2007) have identified several kallikreins present in tears during development of SjS-like disease in NOD.B10-H2b mice, while Hu et al. (Hu et al., 2007) have reported that several of the carbonic anhydrases show markedly altered levels in saliva of SjS patients, with carbonic anhydrase I and carbonic anhydrase II being elevated and carbonic anhydrase VI being decreased. In the present report, the transcripts of two kallikreins (16 and 9) are highly up-regulated in the lacrimal glands of C57BL/6.NOD-Aec1Aec2 mice, peaking around 12 weeks of age before rapidly declining. Several other kallikrein genes (1, 6, 11, 21 and 26) show smaller degrees of up-regulation, while all other members of this family showed no changes, as represented by kallikrein 10. Interestingly, Takada, et al. (Takada et al., 2005) have reported that kallikrein is an autoantigen in the IQI mouse model of SjS. A similar expression pattern is exhibited by members of the family of genes (Car1 to Car13), that encode for the carbonic anhydrase proteins. In mice, the genes encoding carbonic anhydrases 1, 2 and 3 are located on chromosome 3 in a genetic region associated with SjS-susceptibility (Nguyen et al., 2006b). Unexpectedly, gene expression of Car3 was found to be strongly up-regulated in the lacrimal glands of C57BL/6.NOD-Aec1Aec2 mice, reaching a maximum just prior to onset of clinical disease. In contrast, expression of other carbonic anhydrase genes remained unchanged over time, as represented by Car1 and Car7. However, it should be noted that the transcript levels of Car2 were actually slightly down-regulated in the lacrimal glands of these mice compared to the 4 week levels, while Car6 became down-regulated, but only with onset of disease, the latter observation consistent with the report of Hu et al. (Hu et al., 2007) Interestingly, Ge & Spicer (Spicer et al., 1990) have reported that expressions of Car3 and Car2 vary inversely to one another, at the same time, Singh et al (Singh et al., 2005) have reported that Car3 plus Ncam2 can compensate for Car2 plus Ncam1.
Lastly, several members of the tumor necrosis factor super-family of genes, specifically Tnfaip1, Tnfaip3, Tnfsf7, Tnfrsf13c, Traf6 and Traf3, have shown various associations with SjS and other autoimmune diseases, in both humans and mice. As presented above, a number of Tnf family genes exhibit minimal up-regulated expression in the lacrimal glands of C57BL/6.NOD-Aec1Aec2 mice, including Tnfaip1 and Tnfaip3. Interestingly, Tnfsf13 (or APRIL) showed the strongest up-regulated expression, occurring at 8 weeks of age. TNFsf13 is a known B cell stimulating factor, and its appearance coincides with the appearance of B cells in the lacrimal glands. Surprisingly, Tnfsf13b (or Baff/Blys) exhibited no changes in gene expression, even though Tnfsf13b / Baff has been found to be up-regulated in the salivary gland (Killedar et al., 2006)
A serious concern or possible weakness in these microarray analyses is whether or not important data are missed when differential gene expressions are determined merely by statistical measurements. An example of this may involve the detectable expressions of chemokines, a large family of small, secreted proteins that regulate leukocyte migration and chemically attract leukocytes to tissue sites. It is assumed that in SjS small numbers of macrophages along with dendritic cells are the first leukocytes to enter the lacrimal glands, acting to recruit the T and B lymphocytes that eventually form the lymphocytic foci commonly seen in the exocrine glands of SjS patients. In the current study, with the exception of Ccl8, Ccl9 and Ccrl1, we found relatively few chemokine genes that one might consider as significantly up-regulated, raising the question whether this is merely indicative of the relative numbers of any one cell population in the lacrimal glands or whether there is truly a highly restricted chemokine expression. Unfortunately, this argument applies to several gene families where the number of cells involved in any one biological process per se may be relatively few. This issue may be resolved only by analyzing isolated and highly purified cell populations, whether acinar cells or inflammatory cells.
Lastly, it is imperative to comment on attempts to identify interactive gene pathways that might reveal the underlying molecular and biological events of SjS and/or SjS-like disease. A large number of biological processes and signaling pathways have been identified based on genes that are differentially expressed. On the other hand, many of the genes which have been analyzed to identify these biological processes and pathways are common to multiple pathways, thereby adding complexity to interpreting the microarray data. We presented above one example of a set of pathways defined by differentially-expressed (up-regulated) genes, i.e., those linked to apoptosis (or anti-apoptosis) identified by statistical significance. However, the biological process of apoptosis clearly demonstrates the complexity of such analyses, as both pro-apoptotic and anti-apoptotic functions appear to be occurring simultaneously, suggesting the outcome is based more on a balance of gene product function rather than an absolute expression. On the other hand, a second biological process that may be more focused involves lipid and fatty acid homeostasis. Like apoptosis, lipid and fatty acid homeostasis is also a biological process of interest for SjS since lipid depositions in the exocrine glands has been reported for both human SjS patients and NOD mice (Ding et al., 2006; Izumi et al., 1997). Microarray analyses permitted 27 genes with a cumulative statistical p value of 0.0073 (Table 2) to be assigned to this functional activity. Although sets of genes involved in fatty acid and lipid homeostasis appear within all 4 cluster profiles (as listed in Table 3), the subset that reached statistical significance (p<0.02) shows up in cluster 2, a time when most differentially expressed genes are associated with the autoimmune response and early onset of the clinical phase of SjS-like disease (>18 weeks of age). Using the 27 genes identified as differentially expressed, then adding genes associated with pathways defined by these 27 genes, we have generated a schematic that might explain the role of altered lipid homeostasis in the pathophysiology of lacrimal gland dysfunction in SjS. This hypothetical model is presented in Figure 8.
In brief, retinoic acid, together with its receptors RXR-α and RAR, is a critical factor in myeloid cell development, including dendritic cells. RXR-α functions as a transcription factor that, along with prostaglandin-α-activated PPAR-γ, activates genes that, among others, help regulate fatty acid, lipoprotein and cholesterol homeostasis within cells and tissues. Dysregulation of this homeostasis is reflected by (i) down-regulation of the gene encoding membrane-associated protein FDFT-1 involved in influx of farnesyl-pyrophosphate despite an up-regulation of PMVK that synthesizes farnesyl-pyrophosphate, (ii) down-regulation of genes encoding membrane-associated proteins involved in efflux of cholesterol, e.g., ABC-α1, even though ABC-γ1 is up-regulated, and (iii) an up-regulation of genes that encode proteins regulating influx of oxidized LDL, including LIP-c and the LDL-receptor, LRPR. We hypothesize, therefore, that an imbalance in the retinoic acid pathway leading to an imbalance in the homeostasis of fatty acids, lipoproteins and cholesterol results not only in lipid depositions within the lacrimal gland, but also the appearance of dysfunctional dendritic cell populations in C57BL/6.NOD-Aec1Aec2 mice that exhibit reduced responses to CSF, as previously reported for NOD mice (Serreze et al., 1993).
In summary, we have used a genomic approach to identify genes that are differentially expressed in the lacrimal glands during the development and early onset phases of SjS-like disease of C57BL/6.NOD-Aec1Aec2 mice. This approach identified 552 genes that could be grouped into one of four expression patterns during development of disease. In addition, at least 2200 genes exhibited marked changes in their expressions during the time-frame studied, i.e., from 4 weeks to 20 weeks of age. While more complete analyses of these data will require considerable time yet, a number of expected and unexpected biological processes, signaling pathways and potential dysfunctions have been identified. As might be predicted, virtually all biological processes during the early stages of disease (4 - 16 weeks of age) relate to altered cell functions, with inflammation- and autoimmunity-related processes appearing much later (16 - 20 weeks of age). Most importantly, these types of analyses permit construction of possible bases for SjS that can now be examined in greater detail, possibly identifying the specific SjS-susceptibility candidate genes and downstream molecular pathways.
Acknowledgments
We wish to thank Ms. Janet Cornelius for overseeing the breeding of the mice used in this study.
Supported in part by: PHS grant DE-014344 (to A.B.P.) from the National Institutes of Health and the University of Florida's Center for Orphaned Autoimmune Disorders. C.Q.N. was supported by a post-doctoral fellowship from PHS grant T32 DE07200.
Footnotes
Publisher's Disclaimer: This is a PDF file of an unedited manuscript that has been accepted for publication. As a service to our customers we are providing this early version of the manuscript. The manuscript will undergo copyediting, typesetting, and review of the resulting proof before it is published in its final citable form. Please note that during the production process errors may be discovered which could affect the content, and all legal disclaimers that apply to the journal pertain.
References
- Benjamini Y, Hochberg Y. Controlling the false discovery rate: a practical and powerful approach to multiple testing. J R Statist Soc B. 1995;57:289–300. [Google Scholar]
- Bolstad AI, Wargelius A, Nakken B, Haga HJ, Jonsson R. Fas and Fas ligand gene polymorphisms in primary Sjögren's syndrome. J Rheumatol. 2000;27:2397–2405. [PubMed] [Google Scholar]
- Botto M, Walport MJ. C1q, autoimmunity and apoptosis. Immunobiology. 2002;205:395–406. doi: 10.1078/0171-2985-00141. [DOI] [PubMed] [Google Scholar]
- Brayer J, Lowry J, Cha S, Robinson CP, Yamachika S, Peck AB, Humphreys-Beher MG. Alleles from chromosomes 1 and 3 of NOD mice combine to influence Sjögren's syndrome-like autoimmune exocrinopathy. J Rheumatol. 2000;27:1896–1904. [PubMed] [Google Scholar]
- Cha S, Nagashima H, Brown VB, Peck AB, Humphreys-Beher MG. Two NOD Idd-associated intervals contribute synergistically to the development of autoimmune exocrinopathy (Sjögren's syndrome) on a healthy murine background. Arthritis Rheum. 2002a;46:1390–1398. doi: 10.1002/art.10258. [DOI] [PubMed] [Google Scholar]
- Cha S, Peck AB, Humphreys-Beher MG. Progress in understanding autoimmune exocrinopathy using the non-obese diabetic mouse: an update. Crit Rev Oral Biol Med. 2002b;13:5–16. doi: 10.1177/154411130201300103. [DOI] [PubMed] [Google Scholar]
- Cha S, van Blockland SC, Versnel MA, Homo-Delarche F, Nagashima H, Brayer J, Peck AB, Humphreys-Beher MG. Abnormal organogenesis in salivary gland development may initiate adult onset of autoimmune exocrinopathy. Exp Clin Immunogenet. 2001;18:143–160. doi: 10.1159/000049194. [DOI] [PubMed] [Google Scholar]
- Delaleu N, Immervoll H, Cornelius J, Jonsson R. Biomarker profiles in serum and saliva of experimental Sjögren's syndrome: associations with specific autoimmune manifestations. Arthritis Res Ther. 2008;10:R22. doi: 10.1186/ar2375. [DOI] [PMC free article] [PubMed] [Google Scholar]
- Ding C, MacVeigh M, Pidgeon M, da Costa SR, Wu K, Hamm-Alvarez SF, Schechter JE. Unique ultrastructure of exorbital lacrimal glands in male NOD and BALB/c mice. Curr Eye Res. 2006;31:13–22. doi: 10.1080/02713680500428613. [DOI] [PubMed] [Google Scholar]
- Doyle ME, Boggs L, Attia R, Cooper LR, Saban DR, Nguyen CQ, Peck AB. Autoimmune dacryoadenitis of NOD/LtJ mice and its subsequent effects on tear protein composition. Am J Pathol. 2007;171:1224–1236. doi: 10.2353/ajpath.2007.070388. [DOI] [PMC free article] [PubMed] [Google Scholar]
- Gao J, Killedar S, Cornelius JG, Nguyen C, Cha S, Peck AB. Sjögren's syndrome in the NOD mouse model is an interleukin-4 time-dependent, antibody isotype-specific autoimmune disease. J Autoimmun. 2006;26:90–103. doi: 10.1016/j.jaut.2005.11.004. [DOI] [PubMed] [Google Scholar]
- Gottenberg JE, Busson M, Loiseau P, Dourche M, Cohen-Solal J, Lepage V, Charron D, Miceli C, Sibilia J, Mariette X. Association of transforming growth factor beta1 and tumor necrosis factor alpha polymorphisms with anti-SSB/La antibody secretion in patients with primary Sjögren's syndrome. Arthritis Rheum. 2004;50:570–580. doi: 10.1002/art.20060. [DOI] [PubMed] [Google Scholar]
- Graham DS, Wong AK, McHugh NJ, Whittaker JC, Vyse TJ. Evidence for unique association signals in SLE at the CD28-CTLA4-ICOS locus in a family-based study. Hum Mol Genet. 2006;15:3195–3205. doi: 10.1093/hmg/ddl395. [DOI] [PubMed] [Google Scholar]
- Hu S, Wang J, Meijer J, Ieong S, Xie Y, Yu T, Zhou H, Henry S, Vissink A, Pijpe J, et al. Salivary proteomic and genomic biomarkers for primary Sjögren's syndrome. Arthritis Rheum. 2007;56:3588–3600. doi: 10.1002/art.22954. [DOI] [PMC free article] [PubMed] [Google Scholar]
- Izumi M, Eguchi K, Nakamura H, Nagataki S, Nakamura T. Premature fat deposition in the salivary glands associated with Sjogren syndrome: MR and CT evidence. AJNR Am J Neuroradiol. 1997;18:951–958. [PMC free article] [PubMed] [Google Scholar]
- Jonsson R, Dowman SJ, Gordon T. Sjögren's syndrome. In: Koopman W, editor. Arthritis and Allied Conditions-A Textbook in Rheumatology. Philadelphia: Lippincott Williams & Wilkins; 2004. pp. 1681–1705. [Google Scholar]
- Killedar SY, Eckenrode SE, McIndoe RA, She JX, Nguyen CQ, Peck AB, Cha SR. Early pathogenic events associated with Sjögren's syndrome (SjS)-like disease of the nod mouse using microarray analysis. Lab Invest. 2006;86:1243–1260. doi: 10.1038/labinvest.3700487. [DOI] [PubMed] [Google Scholar]
- Koczan D, Drynda S, Hecker M, Drynda A, Guthke R, Kekow J, Thiesen HJ. Molecular discrimination of responders and non-responders to anti-TNF-alpha therapy in rheumatoid arthritis by etanercept. Arthritis Res Ther. 2008;10:R50. doi: 10.1186/ar2419. [DOI] [PMC free article] [PubMed] [Google Scholar]
- Kumagai S, Kanagawa S, Morinobu A, Takada M, Nakamura K, Sugai S, Maruya E, Saji H. Association of a new allele of the TAP2 gene, TAP2*Bky2 (Val577), with susceptibility to Sjögren's syndrome. Arthritis Rheum. 1997;40:1685–1692. doi: 10.1002/art.1780400919. [DOI] [PubMed] [Google Scholar]
- Lappalainen I, Thusberg J, Shen B, Vihinen M. Genome wide analysis of pathogenic SH2 domain mutations. Proteins. 2008 doi: 10.1002/prot.21970. [DOI] [PubMed] [Google Scholar]
- Lee AT, Li W, Liew A, Bombardier C, Weisman M, Massarotti EM, Kent J, Wolfe F, Begovich AB, Gregersen PK. The PTPN22 R620W polymorphism associates with RF positive rheumatoid arthritis in a dose-dependent manner but not with HLA-SE status. Genes Immun. 2005;6:129–33. doi: 10.1038/sj.gene.6364159. [DOI] [PubMed] [Google Scholar]
- Martinez A, Varade J, Lamas JR, Fernandez-Arquero M, Jover JA, de la Concha EG, Fernandez-Gutierrez B, Urcelay E. Association of the IFIH1-GCA-KCNH7 chromosomal region with rheumatoid arthritis. Ann Rheum Dis. 2008;67:137–138. doi: 10.1136/ard.2007.073213. [DOI] [PubMed] [Google Scholar]
- Miceli-Richard C, Comets E, Loiseau P, Puechal X, Hachulla E, Mariette X. Association of an IRF5 gene functional polymorphism with Sjögren's syndrome. Arthritis Rheum. 2007;56:3989–3994. doi: 10.1002/art.23142. [DOI] [PMC free article] [PubMed] [Google Scholar]
- Morinobu A, Kanagawa S, Koshiba M, Sugai S, Kumagai S. Association of the glutathione S-transferase M1 homozygous null genotype with susceptibility to Sjögren's syndrome in Japanese individuals. Arthritis Rheum. 1999;42:2612–2615. doi: 10.1002/1529-0131(199912)42:12<2612::AID-ANR15>3.0.CO;2-V. [DOI] [PubMed] [Google Scholar]
- Nguyen C, Cornelius J, Singson E, Killedar S, Cha S, Peck AB. Role of complement and B lymphocytes in Sjögren's syndrome-like autoimmune exocrinopathy of NOD.B10-H2b mice. Mol Immunol. 2006a;43:1332–1339. doi: 10.1016/j.molimm.2005.09.003. [DOI] [PubMed] [Google Scholar]
- Nguyen C, Singson E, Kim JY, Cornelius JG, Attia R, Doyle ME, Bulosan M, Cha S, Peck AB. Sjögren's syndrome-like disease of C57BL/6.NOD-Aec1 Aec2 mice: gender differences in keratoconjunctivitis sicca defined by a cross-over in the chromosome 3 Aec1 locus. Scand J Immunol. 2006b;64:295–307. doi: 10.1111/j.1365-3083.2006.01828.x. [DOI] [PubMed] [Google Scholar]
- Nguyen CQ, Cha SR, Peck AB. Sjögren's syndrome (SjS)-like disease of mice: the importance of B lymphocytes and autoantibodies. Frontiers in Bioscience. 2007;12:1767–1789. doi: 10.2741/2187. [DOI] [PubMed] [Google Scholar]
- Nguyen CQ, Hu MH, Li Y, Stewart C, Peck AB. Salivary gland tissue expression of interleukin-23 and interleukin-17 in Sjögren's syndrome: Findings in humans and mice. Arthritis Rheum. 2008;58:734–743. doi: 10.1002/art.23214. [DOI] [PMC free article] [PubMed] [Google Scholar]
- Pertovaara M, Lehtimaki T, Rontu R, Antonen J, Pasternack A, Hurme M. Presence of apolipoprotein E epsilon4 allele predisposes to early onset of primary Sjögren's syndrome. Rheumatology (Oxford) 2004;43:1484–1487. doi: 10.1093/rheumatology/keh383. [DOI] [PubMed] [Google Scholar]
- Remmers EF, Plenge RM, Lee AT, Graham RR, Hom G, Behrens TW, de Bakker PI, Le JM, Lee HS, Batliwalla F, et al. STAT4 and the risk of rheumatoid arthritis and systemic lupus erythematosus. N Engl J Med. 2007;357:977–986. doi: 10.1056/NEJMoa073003. [DOI] [PMC free article] [PubMed] [Google Scholar]
- Robinson CP, Yamamoto H, Peck AB, Humphreys-Beher MG. Genetically programmed development of salivary gland abnormalities in the NOD (nonobese diabetic)-scid mouse in the absence of detectable lymphocytic infiltration: a potential trigger for sialoadenitis of NOD mice. Clin Immunol Immunopathol. 1996;79:50–59. doi: 10.1006/clin.1996.0050. [DOI] [PubMed] [Google Scholar]
- Serreze DV, Gaskins HR, Leiter EH. Defects in the differentiation and function of antigen presenting cells in NOD/Lt mice. J Immunol. 1993;150:2534–2543. [PubMed] [Google Scholar]
- Singh U, Sun T, Shi W, Schulz R, Nuber UA, Varanou A, Hemberger MC, Elliott RW, Ohta H, Wakayama T, Fundele R. Expression and functional analysis of genes deregulated in mouse placental overgrowth models: Car2 and Ncam1. Dev Dyn. 2005;234:1034–1045. doi: 10.1002/dvdy.20597. [DOI] [PubMed] [Google Scholar]
- Spicer SS, Ge ZH, Tashian RE, Hazen-Martin DJ, Schulte BA. Comparative distribution of carbonic anhydrase isozymes III and II in rodent tissues. Am J Anat. 1990;187:55–64. doi: 10.1002/aja.1001870107. [DOI] [PubMed] [Google Scholar]
- Smyth GK. Limma: linear models for microarray data. In: Gentleman R, Carey V, Dudoit S, Irizarry R, Huber W, editors. Bioinformatics and Computational Biology Solutions using R and Bioconductor. Springer; New York: 2005. pp. 397–420. [Google Scholar]
- Takada K, Takiguchi M, Konno A, Inaba M. Autoimmunity against a tissue kallikrein in IQI/Jic Mice: a model for Sjögren's syndrome. J Biol Chem. 2005;280:3982–3988. doi: 10.1074/jbc.M410157200. [DOI] [PubMed] [Google Scholar]
- Teutsch SM, Booth DR, Bennetts BH, Heard RN, Stewart GJ. Identification of 11 novel and common single nucleotide polymorphisms in the interleukin-7 receptor-alpha gene and their associations with multiple sclerosis. Eur J Hum Genet. 2003;11:509–515. doi: 10.1038/sj.ejhg.5200994. [DOI] [PubMed] [Google Scholar]
- Thomas PD, Campbell MJ, Kejariwal A, Mi H, Karlak B, Daverman R, Diemer K, Muruganujan A, Narechania A. PANTHER: a library of protein families and subfamilies indexed by function. Genome Res. 2003;13:2129–2141. doi: 10.1101/gr.772403. [DOI] [PMC free article] [PubMed] [Google Scholar]
- Tsubota K, Mishima K, Obara K, Yamada H, Inoue H, Saito I. Reactive Oxygen Species Can Be Controlled By The Secretory Glycoprotein, Clusterin, From Side Population Cells In The Lacrimal Gland: A New Intervention For Age-Related Dry Eye Disorders. Tear Film and Ocular Surface 2007 (Taormina) 2007 [Google Scholar]
- Wang H, Nakamura K, Inoue T, Yanagihori H, Kawakami Y, Hashimoto S, Oyama N, Kaneko F, Fujita T, Nishida T, Mizuki N. Mannose-binding lectin polymorphisms in patients with Behcet's disease. J Dermatol Sci. 2004;36:115–117. doi: 10.1016/j.jdermsci.2004.07.011. [DOI] [PubMed] [Google Scholar]
- Zoukhri D. Effect of inflammation on lacrimal gland function. Exp Eye Res. 2006;82:885–898. doi: 10.1016/j.exer.2005.10.018. [DOI] [PMC free article] [PubMed] [Google Scholar]