Abstract
Molecular depth profiling and three-dimensional imaging using cluster projectiles and SIMS have become a prominent tool for organic and biological materials characterization. To further explore the fundamental features of cluster bombardment of organic materials, especially depth resolution and differential sputtering, we have developed a reproducible and robust model system consisting of Langmuir–Blodgett (LB) multilayer films. Molecular depth profiles were acquired, using a 40-keV C60+ probe, with LB films chemically alternating between barium arachidate and barium dimyristoyl phosphatidate. The chemical structures were successfully resolved as a function of depth. The molecular ion signals were better preserved when the experiment was performed under cryogenic conditions than at room temperature. A novel method was used to convert the scale of fluence into depth which facilitated quantitative measurement of the interface width. Furthermore, the LB films were imaged as a function of depth. The reconstruction of the SIMS images correctly represented the original chemical structure of the film. It also provided useful information about interface mixing and edge effects during sputtering.
Keywords: Molecular depth profiling, 3D imaging, Langmuir, Blodgett films, Multilayers, Cluster beam, SIMS
1. Introduction
The recent development of cluster projectiles has opened new opportunities for materials characterization by SIMS. In particular, depth profiling of molecular species has become possible, which has proved successful experiments on many organic and biological systems [1–5] This success is mainly attributed to the enhanced sputter yields and lower damage accumulation of cluster bombardment, especially for the C60+ projectile [6,7] Recently, the concept of three-dimensionally (3D) characterizing the sample has also emerged as a result of the combination of molecular depth profiling and SIMS imaging. The capability of 3D imaging to acquire chemical information as a function of depth provides unique and valuable insight of biological functions and mechanisms [8,9]
At this point, there are still many unknown fundamental issues that need to be understood in order to further develop molecular depth profiling and 3D imaging. One of the important points is to determine the depth resolution and the degree of interface mixing, especially for organic–organic interfaces. The depth resolution can be affected by surface roughness, differential sputtering, and parameters associated with the primary projectile. A reproducible and robust platform with minimal intrinsic chemical mixing between the layers is necessary. LB films are such a model system since they are known to have well-defined layered structures and sharp interfaces between the layers [2,10,11] Here, we report molecular depth profiling and 3D imaging results using this model system. The LB multilayer films are formed with chemically alternating layers of barium salts of arachidic acid (AA) and dimyristoyl phosphatidic acid (DMPA) on bare silicon wafers or Au-patterned silicon substrates. These films were characterized by SIMS and a C60+ probe as a function of depth to detect buried interfaces with cluster bombardment and to determine the properties of multilayer systems.
2. Experimental
The following materials were used without further purification: AA, barium chloride, potassium hydrogen carbonate, and copper(II) chloride (all purchased in powder from Sigma–Aldrich Co., St. Louis, MO), DMPA (Avanti Polar Lipids, Inc., Alabaster, AL), methanol, and chloroform. The water used was purified by a Nanopure Diamond Life Science Ultrapure Water System (Barnstead International Inc., Dubuque, IA). The details of LB film preparation have been described elsewhere [12] The LB films were formed on a hydrophilic silicon wafer or Au-patterned silicon substrate. For patterned substrates, the silicon wafer was first covered by TEM grids fixed by copper tape, which allowed the Au to be deposited onto the bare silicon area. After deposition, metal grids were removed, leaving an Au-patterned silicon substrate. The Au bars were about 100 nm higher than the Si area as measured by a profilometer. The topography was retained after LB film deposition since the LB films formed on both the silicon and Au area. A KLA-Tencor Nanopics 2100 atomic force profilometer (AFP) was used to measure the surface topography and crater depth.
The depth profiling and 3D imaging were performed in a home-built ToF-SIMS instrument equipped with a 40-keV C60+ ion source (Ionoptika; Southampton, UK). The details of this instrument have been described elsewhere [5] For depth profiling, the samples were sputtered by the C60+ beam in dc mode followed by the acquisition of mass spectra from inside the sputtered region with 25% of the erosion area using the C60+ projectile at an ion fluence of 1010 cm−2. The 3D imaging experiments were also performed by alternating between sputter cycles and data acquisition cycles, but the imaging field-of-view was the same size as the sputter area.
3. Results and discussion
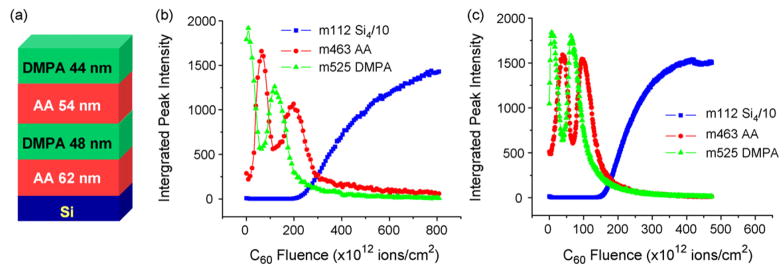
The LB film (LB20-4) depth profiled by the C60+ ion beam consists of 23 layers of AA, 22 layers of DMPA, 20 layers of AA, and 20 layers of DMPA, from bottom to top. The thickness of each chemical block is shown in Fig. 1(a). The depth profile experiments of LB20-4 were performed at both room temperature (RT) and liquid nitrogen temperature (LN2T). The characteristic peaks for both molecules are observed in the mass spectra, at m/z 463 for AA and m/z 525 for DMPA. The integrated intensities of these two peaks as well as the Si signal are plotted against the C60+ fluence (Fig. 1). Both profiles successfully resolve the chemical variation in the film which is displayed as the alternation of the two signals. The initial increase of m/z 525 most probably is due to surface contamination. After the film is removed, the Si signal increases while the AA and DMPA signals go to a minimum value. The most significant difference between the two profiles is the signal intensity of the bottom two chemical blocks, which drops by about 50% in the RT profile yet retains the same level as the top blocks in the LN2T profile. Damage accumulation appears to be less severe at low temperature. A possible reason for this effect is that thermal energy created from ion bombardment is quenched at lower temperature, creating less chemical degradation. Interestingly, as is also seen in Fig. 1, the sputter rate is larger at lower temperature, an effect not previously observed. A possible explanation for this result is that the LB film rigidity increases after being cooled, making it a better target for keeping the deposited energy near the surface.
Fig. 1.
(a) Schematic drawing of the LB20-4 with red, green, and blue representing AA, DMPA, and silicon respectively; (b) depth profile of LB20-4 at room temperature; (c) depth profile of LB20-4 at cryogenic temperature. (For interpretation of the references to color in this figure legend, the reader is referred to the web version of the article.)
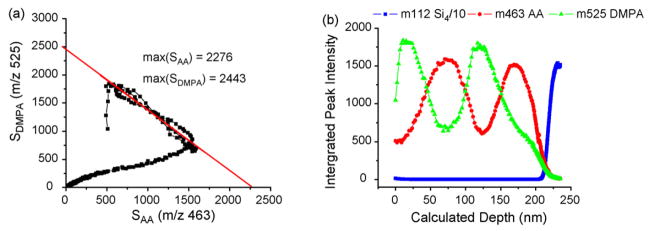
The depth profiling of LB20-4 shows that it is possible to acquire chemical information from buried organic layers. More importantly, it provides a system to quantify the organic–organic interface width. To establish this width, it is necessary to convert the scale of fluence to depth. As shown in Fig. 2(a), the AA and DMPA signals are linearly correlated with each other until the profile reaches the Si region (except the initial contamination region). The two intercepts of the linear fit represent the maximum values that can be obtained in the mass spectra for the two signals. The sputter rate is calculated according to the following equation:
where RAA and RDMPA are the sputter rate of pure AA and DMPA LB films. By multiplying the sputter rate with the sputter time at each data point, the depth scale is obtained as shown in Fig. 2(b). The interface width is calculated by monitoring the signal disappearance or appearance between 16 and 84% of the difference between the maximum and the minimum values. The widths for 3 DMPA–AA interfaces are measured to be 23, 22, and 25 nm, from top to bottom. These numbers are slightly larger than those reported for the organic–inorganic interfaces [1,2,5,13] using a variety of cluster projectiles.
Fig. 2.
(a) Correlation plot of two peak intensities, m/z 463 (SAA) and m/z 525 (SDMPA). The red line represents the linear fit. (b) Depth profile of LB20-4 with the calculated depth scale. (For interpretation of the references to color in this figure legend, the reader is referred to the web version of the article.)
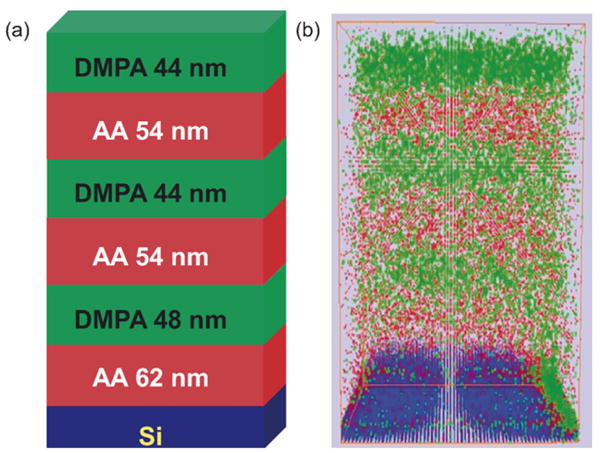
By taking images instead of mass spectra during the sputter intervals, 3D chemical imaging experiments were performed on alternating LB films. The sample used for 3D imaging is LB20-6 which consists of six alternating chemical blocks of AA and DMPA with about 20 layers in each block. Both the schematic drawing and the structure rebuilt from the profile images are shown in Fig. 3. The reconstructed images accurately represent the original chemical information. The sputtering is uniform in most areas except the edges where crater effects play a role. On the bottom right edge of Fig. 3(b), DMPA is present at the bottom since the field-of-view for sputtering and imaging are slightly offset during the experiment. At the center region of the images, the DMPA and AA signals merge at the interface showing the interface mixing.
Fig. 3.

(a) Schematic drawing of LB20-6 and the DMPA blocks are represented by green, AA blocks are represented in red and Si in blue and (b) the chemical structure rebuilt from the SIMS depth profile images with green showing the DMPA signal, red showing the AA signal, and blue showing Si signal. (For interpretation of the references to color in this figure legend, the reader is referred to the web version of the article.)
A film of 20 layers of DMPA on 21 layers of AA deposited on an Au-patterned Si substrate was also sputtered by C60+ (data not shown). The LB films cover both the Auand Siregions. After the removal of the films, the appearance of the Si signal in the Si area and disappearance of total ion signal in the Au area occur simultaneously, which means the sputter rates of the LB films on both materials are about the same. This model experiment suggests that 3D imaging on a laterally inhomogeneous substrate will be possible.
4. Conclusion
By examining chemically alternating LB films as a model system, we have shown that molecular depth profiling of organic–organic multilayers is possible with a C60+ projectile, especially at LN2T. The interface width is slightly larger than those measured for organic–inorganic interfaces. The structure rebuilt from the SIMS images shows interface mixing to a certain level. The AFP measurements show that the topography of the material is retained after C60+ sputtering.
Acknowledgments
Financial support from the National Institute of Health under grant # EB002016-13, the National Science Foundation under grant # CHE-555314, and the Department of Energy grant # DE-FG02-06ER15803 are acknowledged. The authors also thank Dr. David Allara and his research group for the use of ellipsometry, and Yanyan Cao and Dr. Thomas Mallouk’s group for metal deposition.
References
- 1.Wucher A, Sun SX, Szakal C, Winograd N. Molecular depth profiling of histamine in ice using a buckminsterfullerene probe. Anal Chem. 2004;76:7234–7242. doi: 10.1021/ac049641t. [DOI] [PubMed] [Google Scholar]
- 2.Sostarecz AG, Mcquaw CM, Wucher A, Winograd N. Depth profiling of Langmuir–Blodgett films with a buckminsterfullerene probe. Anal Chem. 2004;76:6651–6658. doi: 10.1021/ac0492665. [DOI] [PubMed] [Google Scholar]
- 3.Mahoney CM, Roberson SV, Gillen G. Depth profiling of 4-acetamindophenol-doped poly(lactic acid) films using cluster secondary ion mass spectrometry. Anal Chem. 2004;76:3199–3207. doi: 10.1021/ac035532n. [DOI] [PubMed] [Google Scholar]
- 4.Wagner MS. Molecular depth profiling of multilayer polymer films using time-of-flight secondary ion mass spectrometry. Anal Chem. 2005;77:911–922. doi: 10.1021/ac048945c. [DOI] [PubMed] [Google Scholar]
- 5.Cheng J, Winograd N. Depth profiling of peptide films with TOF-SIMS and a C-60 probe. Anal Chem. 2005;77:3651–3659. doi: 10.1021/ac048131w. [DOI] [PubMed] [Google Scholar]
- 6.Postawa Z, Czerwinski B, Szewczyk M, Smiley EJ, Winograd N, Garrison BJ. Enhancement of sputtering yields due to C-60 versus Ga bombardment of Ag{1 1 1} as explored by molecular dynamics simulations. Anal Chem. 2003;75:4402–4407. doi: 10.1021/ac034387a. [DOI] [PubMed] [Google Scholar]
- 7.Postawa Z, Czerwinski B, Winograd N, Garrison BJ. Microscopic insights into the sputtering of thin organic films on Ag{1 1 1} induced by C-60 and Ga bombardment. J Phys Chem B. 2005;109:11973–11979. doi: 10.1021/jp050821w. [DOI] [PubMed] [Google Scholar]
- 8.Fletcher JS, Lockyer NP, Vaidyanathan S, Vickerman JC. TOF-SIMS 3D biomolecular imaging of Xenopus laevis oocytes using buckminsterfullerene (C-60) primary ions. Anal Chem. 2007;79:2199–2206. doi: 10.1021/ac061370u. [DOI] [PubMed] [Google Scholar]
- 9.Wucher A, Cheng J, Winograd N. Protocols for 3-dimensional imaging with mass spectrometry. Anal Chem. 2007 doi: 10.1021/ac070692a. [DOI] [PubMed] [Google Scholar]
- 10.Blodgett KB. Films built by depositing successive monomolecular layers on a solid surface. J Am Chem Soc. 1935;57:1007–1022. [Google Scholar]
- 11.Blodgett KB. Properties of built-up films of barium stearate. J Phys Chem. 1937;41:975–984. [Google Scholar]
- 12.Zheng L, Winograd N. Alternating Langmuir–Blodgett multilayers as a molecular depth profile model. J Am Soc Mass Spectrom. 2007 doi: 10.1016/j.jasms.2007.10.020. [DOI] [PMC free article] [PubMed] [Google Scholar]
- 13.Wagner MS. Impact energy dependence of SF5+-induced damage in poly(methyl methacrylate) studied using time-of-flight secondary ion mass spectrometry. Anal Chem. 2004;76:1264–1272. doi: 10.1021/ac035330r. [DOI] [PubMed] [Google Scholar]


