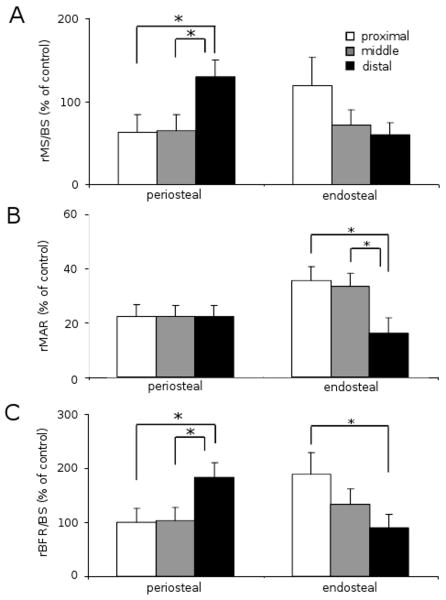
FIG. 4.
Increase in the morphometric parameters (n = 18). The results are expressed as mean ± SEM. The single asterisk indicates p < 0.05. (A) Increase in relative MS/BS (% of the control MS/BS value). (B) Increase in relative MAR (% of the control MAR value). (C) Increase in relative BFR/BS (% of the control BFR/BS value).

