

Abstract
The clinical value of assessing tumor glucose metabolism via F-18 Fluorodeoxyglucose (FDG) PET imaging in oncology is well established; however, the poor spatial resolution of PET is a significant limitation especially for early stage lesions. An alternative technology is optical molecular imaging, which allows for subcellular spatial resolution and can be effectively used with topical contrast agents for imaging epithelial derived cancers. The goal of this study was to evaluate the potential of optical molecular imaging of glucose metabolism to aid in early detection of oral neoplasia. Fluorescently labeled deoxyglucose (2-NBDG (2-[N-(7-nitrobenz-2-oxa-1,3-diazol-4-yl)amino]-2-deoxy-D-glucose)) was applied topically to tissue phantoms, fresh oral biopsies (n=32) and resected tumors specimens (n=2). High-resolution imaging results show that 2-NBDG can be rapidly delivered to oral epithelium using topical application. In normal epithelium, the uptake of 2-NBDG is limited to basal epithelial cells. In contrast high grade dysplasia and cancers show uptake of 2-NBDG in neoplastic cells throughout the lesion. Following 2-NBDG labeling, the mean fluorescence intensity of neoplastic tissue averages 3.7 times higher than that of matched non-neoplastic oral biopsies in samples from 20 patients. Widefield fluorescence images of 8-paired oral specimens were obtained pre- and post-labeling with 2-NBDG. Prior to labeling, neoplastic samples showed significantly lower autofluorescence than non-neoplastic samples. The fluorescence of neoplastic samples increased dramatically after labeling; the differential increase in fluorescence was on average 30 times higher in neoplastic samples than in normal samples. Topical application of 2-NBDG can therefore provide image contrast in both widefield and high-resolution fluorescence imaging modalities, highlighting its potential in early detection of oral neoplasia.
Keywords: Molecular Imaging, Fluorescent Glucose Analogs, Oral Cancer, Epithelial Cancer
Introduction
Non-invasive, molecular-specific imaging has the potential to improve both the early detection of cancer and the evaluation of tumor response to therapeutic intervention1-5. While molecular imaging technologies have contributed to our understanding of the molecular mechanisms of cancer development and progression 1, 3 in animal model systems, there has been limited translation of these technologies to the clinical practice 5, 6. The clinical use of molecular imaging in cancer has primarily centered on positron emission tomography (PET) imaging, using 18F-FDG (fluorodeoxyglucose) or 18F-FLT (3′-Deoxy-3′-18F-fluorothymidine) as contrast agents. PET imaging is now routinely used for staging and assessment of therapeutic response in cancer patients7-9.
Cancer cells have increased rates of glucose metabolism relative to normal cells10-12. To support this increased glucose consumption, cancer cells over-express glucose transporters (GLUT) and hexokinase enzymes. In 18FDG PET imaging, radioisotope labeled de-oxyglucose is actively transported by the GLUT transporters and phosphorlyated by the hexokinase enzyme. The phosphorylated de-oxyglucose molecule is selectively entrapped in cells, resulting in increased contrast for PET imaging4. While PET imaging has important clinical advantages especially for deep tissue imaging, it also suffers from significant limitations for detection of early stage lesions. The spatial resolution of PET is limited to 0.3-1 cm3, , 18F-based radiopharmaceuticals have a short half-life and a local cyclotron is required to produce the contrast agent. For these reasons, PET has had a limited role in the early detection of cancer and in cancer screening.
Optical molecular imaging is an alternative technology, which has the potential to address these limitations in areas of early stage epithelial lesions. The goal of this study was to evaluate the ability of optical molecular imaging of glucose metabolism to aid in the early detection of oral neoplasia. Fluorescently labeled deoxyglucose (2-NBDG (2-[N-(7-nitrobenz-2-oxa-1,3-diazol-4-yl)amino]-2-deoxy-D-glucose)) was applied topically to tissue phantoms, fresh oral biopsy specimens and resected tumors and the resulting fluorescence image contrast was evaluated.
2-NBDG is a fluorescent analogue of 18FDG13. The use of a fluorescently labeled deoxyglucose has several advantages compared to 18FDG. First, optical imaging can be used to obtain both widefield images of large areas of tissue labeled with 2-NBDG as well as sub-micron resolution images of regions of interest. The ability to combine widefield imaging and targeted high-resolution imaging is ideal for both the detection of pre-invasive lesions and for real-time mapping of tumor margins. Non-radioactive glucose analogues provide an attractive alternative to radiopharmaceuticals, which are cumbersome to use in cancer screening. In addition, 2-NBDG can be easily synthesized using commercially available reagents in a GMP (good manufacturing practice) grade laboratory for clinical applications, reducing the limitations associated with synthesis of FDG PET imaging agents. Since the molecular weight of 2-NBDG is only 330 Da, it is amenable for local topical delivery14-16 in epithelial tissue without the need for IV injection.
2-NBDG was initially developed to image glucose metabolism in various model systems13, 17, 18. It has been used to image glucose metabolism in E. coli19, yeast20 and pancreatic islet cells as well as in cultured neurons21. Studies by O' Neil et al.22 have measured the uptake kinetics of 2-NBDG in various cancer cell lines, demonstrating rapid uptake and retention of 2-NBDG in cancer cells. Several studies have shown that 2-NBDG is delivered to tumor cell lines via the glucose transporters and have shown that IV injected fluorescent glucose analogues can accumulate in tumors in animal models23, 24.
In this study, we evaluated the fluorescence contrast properties following topical delivery of 2-NBDG in freshly resected clinical specimens of normal and neoplastic oral mucosa using both high resolution and wide-field fluorescence imaging. In the first part of this study, we assess the spatial distribution of 2-NBDG labeling in oral epithelial specimens using high-resolution fluorescence imaging and evaluate the ratiometric contrast of 2-NBDG associated fluorescence between normal and abnormal paired clinical specimens. In the second part of the study, we evaluate the topical delivery of 2-NBDG in intact oral specimens and determine the effective contrast in high-resolution and widefield imaging modes. To address the clinical challenges associated with early detection, an ideal approach to molecular imaging would combine the ability to image large areas of tissue with high spatial resolution imaging25, 26 following topical administration of a contrast agent which can be easily stored for long periods of time at the point-of-care. To demonstrate the potential for real-time, high-resolution in vivo imaging in a clinical setting, 2-NBDG labeled biopsies were also imaged using a fiber optic micro-endoscope.
Materials and Methods
Materials
Biopsies of clinically normal and abnormal oral mucosa were obtained from patients suspected to have oral cancer at the University of Texas M.D. Anderson Cancer Center. Patients gave written informed consent to participate, and the study was reviewed and approved by the Institutional Review Boards at the UT MD Anderson Cancer Center and Rice University. The oral cancer cell line (1483 cells) was kindly provided by Dr. Lotan's laboratory at the MD Anderson Cancer Center. The cell and tissue culture media used in this study was DMEM/F-12 from Invitrogen. The basal media was supplemented with 10% FBS and L-glutamine. Cylindrical chambers (Transwell) with a polyester membrane at the bottom surface for tissue phantoms were obtained from BD Biosciences. 2-NBDG was obtained from Invitrogen Inc.
Methods
Topical delivery and image contrast properties of 2-NBDG in cells and tissue phantoms
Cell Line
To demonstrate the potential of high resolution and widefield imaging using 2-NBDG, initial studies were carried out using cultured cells in suspension and in three-dimensional culture designed to mimic the properties of epithelial tissue. Cells (∼0.3 millions) were plated 24 hours prior to labeling. In suspension, 1483 oral cancer cells were labeled using 0.05 mg/ml 2-NBDG in the presence of cell culture media for 30 minutes at 37° C. Concentration of 2-NBDG was selected based on a previous study conducted by Neil et al., 2005. The labeled cell suspension was washed with phosphate buffered saline (PBS) and imaged live using a Zeiss LSM 510 confocal microscope. Fluorescence confocal images were excited at 488 nm and fluorescence emission was collected using a bandpass emission filter (530-590 nm). Images were also collected from unlabeled control cells to assess the level of autofluorescence signal under the same imaging conditions.
Tissue Phantoms
To assess the ability to topically deliver 2-NBDG, three dimensional tissue models were prepared as described previously27. 1483 oral squamous cancer cells were allowed to grow for 24 hours in a cylindrical chamber to develop a three dimensional network within the collagen matrix. 0.05 mg/ml 2-NBDG was applied to the top surface of the phantoms, which were incubated for 30 minutes at 37° C and washed with PBS. In this study, we also evaluated the potential of DMSO as a permeation enhancer to facilitate delivery of 2-NBDG in intact tissue phantom. DMSO has been used as a permeation enhancer to facilitate intra-epithelial transport of molecules. For this study, phantoms were incubated with 2-NBDG with and without 10% DMSO solution. Fluorescence images were obtained of labeled phantoms using an in-house designed widefield multi-spectral digital microscope (MDM) 28 equipped with a bandpass excitation filter at 470-490 nm; fluorescence emission was collected using a long pass filter with 50% transmission at 540 nm. Images were also obtained from negative controls under the same imaging conditions. Negative controls included unlabeled tissue phantoms as well as cell-free collagen phantoms which were prepared and labeled in the same way as phantoms containing cells. After widefield imaging, tissue phantoms were sliced transversely using a Krumdieck tissue slicer to obtain viable 200-300 micron thick specimens 29. Transverse slices were imaged using a confocal fluorescence microscope using the same settings as for suspension cultures.
Labeling of transverse slices of paired clinical biopsies using 2-NBDG
To investigate whether the uptake of 2-NBDG differed in normal and neoplastic oral squameous epithelium, high-resolution fluorescence imaging of topically labeled transverse slices of paired, fresh clinically normal and abnormal oral biopsies was carried out. Matched biopsies were immediately placed in chilled culture media and transversely sliced to a thickness of 200-300 microns using a Krumdieck tissue slicer. In initial stages, two pairs of tissue slices were labeled with 2-NBDG at concentration of 0.02 mg/ml and 0.05 mg/ml. Concentration was varied to evaluate variation in degree of labeling. Results showed no significant variation in labeling intensity with a approximately 2.5 fold change concentration. Following this initial study, all the remaining tissue slices were topically labeled with 2-NBDG (0.05 mg/ml) for 30 minutes at 37° C, washed with PBS, and imaged using an in-house designed dual reflectance and fluorescence confocal microscope 30. Fluorescence images were obtained at 488 nm laser excitation, with a 488 nm dichroic and a bandpass emission filter (520-580 nm) 30. Reflectance confocal images were obtained from the same fields of view at 780 nm illumination and provided a guide to tissue morphology. Paired sets of biopsies were imaged using matched imaging conditions (detector gain and input laser power) and unlabeled control tissue slices from the same biopsies were used as a control to assess levels of autofluorescence. Further both labeled and unlabeled biopsies were evaluated using H&E analysis.
Topical delivery of 2-NBDG in paired sets of intact oral clinical specimens
To assess the potential of topical delivery of 2-NBDG in oral tissue samples, sets of intact oral biopsies and resected tumor specimens from each patient were incubated with topical application of 2-NBDG (0.05 mg/ml in 1x PBS). Matched set of biopsies were labeled in a 24 well plate with a 500 μl solution of 2-NBDG at concentration of 0.05 mg/ml. After 30 minutes of labeling at 37° C, unbound contrast agent was removed in a simple washing step using excess PBS. To compare the increase in fluorescence intensity of topically labeled tissue specimens, we acquired both pre-contrast and post–contrast images for each set of specimens using a commercially available widefield imaging system (Maestro, CRI Inc.). Images acquired before the application of 2-NBDG provide a measure of the tissue autofluorescence background signal and post-contrast images provide the total fluorescence intensity, including contributions from both autofluorescence and 2-NBDG labeling. For widefield imaging of intact tissues, each set of specimens was placed on a black plastic sheet. Widefield fluorescence images were obtained using bandpass excitation (BP 470-490 nm) and a long pass emission filter (LP 515). Pre- and post-contrast images were acquired using the same imaging conditions. Following widefield imaging, the biopsy samples were transversely sliced and imaged using a confocal fluorescence microscope (Zeiss LSM 510) using 488 nm laser excitation and a BP 530-580 nm emission filter.
Microendoscopic probe based imaging
To demonstrate the potential of real-time high-resolution in vivo optical imaging, the labeled biopsies were also imaged using a fiber optic fluorescence micro-endoscope 31. The micro-endoscope is based on a 900-micron outer diameter fiber-optic bundle that is small enough to pass through the instrumentation port of a standard endoscope. The distal tip of the microendoscope is placed in gentle contact with the tissue to be imaged. The fiber bundle directs excitation light from an LED centered at 455 nm (20 nm FWHM) and fluorescence is visualized through a 475 nm cut-off dichroic mirror using a CCD camera, yielding a high-resolution fluorescence image.
Quantification of imaging data
Results of tissue phantom study were quantified using ratio of mean fluorescence intensity (MFI) of labeled and control unlabeled slices. Mean fluorescence intensity was calculated using Photoshop 7.0. This procedure was implemented for both confocal and widefield images of tissue phantoms. Average of 3 samples was computed for both modes of imaging.
High-resolution fluorescence images of oral tissue slices were analyzed quantitatively to assess the relative fluorescence of clinically abnormal samples relative to clinically normal samples from the same patient following labeling with 2-NBDG. We first calculated the mean fluorescence intensity (MFI) within the epithelial section of each labeled tissue slice. The epithelium was identified using an overlay of the reflectance and fluorescence confocal images. The mean fluorescence intensity within the epithelium was then calculated using Photoshop 7.0. We then calculated the ratio of the MFI of the clinically abnormal sample to the MFI of the paired clinically normal sample from the same patient. Results were compared to the histopathologic diagnosis for each specimen; this ratiometric contrast provides a quantitative measure of expected contrast for detection of neoplasia.
For quantification of widefield imaging results, the mean fluorescence intensity averaged over a whole specimen was calculated from pre- and post-contrast images collected using the Maestro imaging device. Using these mean intensities, we evaluated a differential contrast measure for each set of specimens, calculated as the increase in the mean fluorescence intensity of the clinically abnormal sample after labeling divided by the increase in the mean fluorescence intensity of the clinically normal sample after labeling. The increase in mean fluorescence intensity for a particular specimen was calculated as the difference in the mean fluorescence intensity of the post-labeling and the pre-labeling values. This differential measure of contrast captures differences in both the 2-NBDG associated fluorescence and differences in the amount of autofluorescence.
Pathological Diagnosis
Following imaging, tissue samples were fixed, paraffin embedded and submitted for routine hematoxylin and eosin (H&E) staining and examined by board certified pathologist. To evaluate effects of 2-NBDG labeling on H&E staining, we compared 2-NBDG labeled slices with unlabeled control slices from the same biopsy set. Comparison of these slices showed no effect of labeling on H&E staining. Further H&E staining was similar for normal and clinically abnormal tissue independent of degree of staining with 2-NBDG. The pathological diagnosis was classified into the following four categories: (1) normal (including hyperplasia and hyperkeratosis), (2) mild to moderate dysplasia, (3) severe dysplasia and (4) cancer.
Results
Imaging of 2-NBDG labeled 1483 cancer cells in suspension and tissue phantoms
Results of high-resolution and widefield imaging of 2-NBDG based molecular contrast in model cell-culture systems are shown in Figure 1. Figure 1 (a) shows the uptake of 2-NBDG in 1483 oral squamous carcinoma cell line; fluorescence is predominantly localized to the cytoplasm. The fluorescence signal from 2-NBDG is significantly higher than the cellular autofluorescence signal from unlabeled cells. Figure 1(b) demonstrates labeling of cells in a tissue culture phantom following topical delivery of 2-NBDG. The transverse slice of a topically labeled phantom was imaged using high-resolution confocal fluorescence microscopy. Results show specific labeling of cells without significant non-specific labeling of the surrounding collagen matrix in the tissue phantom and significantly higher signal than autofluorescence from unlabeled control slice. Average contrast ratio (n= 3; paired labeled and unlabeled samples) for a tissue phantom study was 12.86 with a standard deviation of 2.4 units Figure 1(c) shows a widefield fluorescence image of labeled and unlabeled tissue culture phantoms and labeled and unlabeled cell-free phantoms. The fluorescence signal from the labeled phantom is significantly higher than the autofluorescence signal from the unlabeled tissue phantom and is also higher than the fluorescence of the cell-free negative controls. Average contrast ratio (n= 3 samples) for a widefield imaging of tissue phantoms was 7.6 with a standard deviation of 1.24 units. Result of permeation studies (data not shown) with and without DMSO shows that DMSO is not required for permeation of 2-NBDG in intact tissue phantoms.
Figure 1.


Images of cell culture based samples labeled with 2-NBDG. (a): Confocal fluorescence (left) and brightfield/fluorescence overlay (right) images of 2-NBDG uptake in living cells (top row) and comparison with autofluorescence levels in cells (bottom row). Scale bar represents 20 microns. (b): Confocal fluorescence (left) and brightfield/fluorescence overlay (right) images of 2-NBDG uptake in tissue phantoms and comparison with background autofluorescence in unlabeled tissue phantom transverse slice (bottom row). 2-NBDG was delivered topically to the intact phantom, which was sliced transversely prior to imaging. Scale bar represents 20 microns (c): Widefield fluorescence images of 2-NBDG labeled tissue phantoms (left) and unlabeled controls (right). The top row shows images of phantoms containing 1483 cancer cells; the bottom row shows images of cell-free negative controls. Scale bar represents 6.5 mm
To demonstrate that intracellular delivery of 2-NBDG is mediated via glucose transporters, we conducted a competition assay by varying the concentration of d-glucose in extracellular media with a fixed concentration of 2-NBDG. The results of the competition assay (Figure 2 (a) and (b)) show increased uptake of 2-NBDG in cells as the concentrations of glucose is reduced. Figure 2(a) shows representative images of cells incubated with a fixed concentration of 2-NBDG in media with varying concentrations of glucose (0 to 17.5 mM). Figure 2(b) shows a decrease in the average fluorescence intensity of cells as the glucose concentration in extracellular media is increased. The error bars in Figure 2(b) represent the standard deviation of 10 individual cells measurements (samples) for each experiment. These were randomly selected cells in the field of view. This result validates that delivery of 2-NBDG is mediated via glucose transporters and is in agreement with published reports of uptake of 2-NBDG in cancer cells 22, 23.
Figure 2.

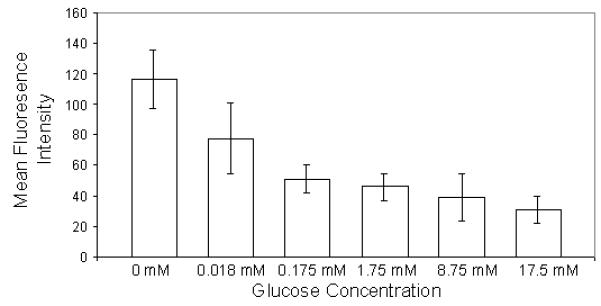
(a): Glucose competition assay: Images of cultured cells labeled with a fixed concentration of 2-NBDG as the media concentration of glucose is varied from 0-17.5 mM. Scale bar represents 100 microns (b) Average fluorescence intensity of labeled cells as the media concentration of glucose is varied.
Imaging of 2-NBDG labeled normal and abnormal fresh ex vivo oral tissue
Table 1 presents the anatomical sites and histological diagnoses of 20 clinically normal and abnormal paired biopsy sets and two resected tumor samples evaluated in this study. One of the clinically abnormal biopsies was histologically normal; three clinically normal samples could not be assessed histologically due to loss of epithelium during specimen processing. These three specimens were categorized based on clinical impression as indicated in Table 1.
Table 1.
Details of paired biopsy sets from various anatomic sites in oral cavity from patients and their pathologic diagnosis
| Patient Number |
Anatomical Site | Pathologic Diagnosis of Specimen Pair |
|---|---|---|
| 1 | Left FOM: Right FOM | Cancer\ Mild Dysplasia |
| 2 | Right tongue: Left tongue | Mild Dysplasia\ Normal |
| 3 | Left Buccal: Right Buccal | Cancer \ Normal |
| 4 | Central Lip: Right Lip | Severe Dysplasia\ Focal Cancer |
| 5 | Left Gingiva: Right Anterior Gingiva | Cancer\ Normal |
| 6 | Right Tongue: Left Interior Tongue | Mild Dysplasia\ Normal |
| 7 | Left Buccal: Gingiva | Cancer\ Clinically Normal |
| 8 | Left Tongue: Right Tongue | Cancer\ Mild Dysplasia |
| 9 | Left Buccal: Right Buccal | Cancer\ Clinically Normal |
| 10 | Left Anterior Tongue: Left Posterior Tongue |
Normal\ Normal |
| 11 | FOM (Resected Tumor) | Cancer |
| 12 | Tongue (Resected Tumor) | Cancer |
| 13 | Left tongue: Right tongue | Cancer\ Mild Dysplasia |
| 14 | Left posterior tongue: Right tongue | Cancer\ Mild Dysplasia |
| 15 | Left Ventral Tongue: Right Ventral Tongue | Cancer\ Clinically Normal |
| 16 | Right lip: Left Lip | Cancer\ Normal |
| 17 | Central lip: Left lip | Cancer\ Normal |
| 18 | Right FOM: Left FOM | Cancer\ Normal |
| 19 | Right Buccal Mucosa: Left Buccal Mucosa | Moderate dysplasia\ Normal |
| 20 | Right Tongue: Left Tongue | Cancer\ Normal |
We evaluated the spatial distribution of 2-NBDG labeling in transverse slices of fresh oral tissue using high resolution imaging and determined the ratiometric contrast between normal and abnormal biopsies. Figure 3 shows a representative image of slices of a biopsy pair labeled with 2-NBDG; the clinically normal specimen was also histologically normal and while the clinically abnormal specimen was diagnosed as mild to moderate dysplasia. In the clinically abnormal sample (Fig. 3a), most of the cells in the lower two-thirds of the epithelium illustrate uptake of 2-NBDG. In addition, some degree of labeling was also observed in the stromal section of the tissue. In contrast, in the normal biopsy (Fig. 3b) intracellular labeling is restricted to the basal cells. The labeling of basal cell layers in normal oral epithelium is consistent with the higher metabolic activity of these cells relative to the more differentiated superficial cells. To highlight the cellular pattern of 2-NBDG labeling, a section of the confocal image mosaic of each specimen is displayed at higher magnification in Fig.3. In both the normal and abnormal biopsy slices, most of the 2-NBDG labeling is observed in the cytoplasm of cells, similar to the results obtained in cultured cells.
Figure 3.


(a-b) Confocal fluorescence images of 2-NBDG labeled transverse slices of oral tissue specimens: (a): images of a clinically abnormal sample diagnosed as mild to moderate dysplasia and (b): images of a clinically and histologically normal sample. (c-d) Confocal fluorescence and reflectance images and corresponding histology images of intact tissue specimens labeled with 2-NBDG. Following labeling, samples were sliced transversely prior to imaging. (c): Clinically abnormal tissue diagnosed as invasive cancer. (d): Clinically and histologically normal sample. Scale bar represents 300 microns.
Penetration of 2-NBDG after topical delivery to fresh ex vivo oral tissue specimens
Our next aim was to evaluate the potential of topical delivery of 2-NBDG in intact oral tissue. Representative fluorescence and reflectance confocal image mosaics of a topically labeled oral biopsy pair are shown in Fig. 3(c-d); intact specimens were labeled and then transversely sliced to assess depth of penetration of the 2-NBDG. The histological evaluation of the clinically normal biopsy showed mild dysplasia and the clinically abnormal area was diagnosed as invasive carcinoma. Figure 3(c) shows images of confocal reflectance, confocal fluorescence and the corresponding histology of the clinically abnormal sample. 2-NBDG labeling is clearly seen in areas of tumor cells throughout the specimen. The stromal tissue separating the tumor nests does not show appreciable fluorescence, indicating low background staining. Labeling in the stroma is likely due to staining of fibroblasts as well as inflammatory cells. The level of stromal staining was significantly weaker than staining in epithelial regions. Figure 3 (d) shows a similar set of images for the clinically normal biopsy in this pair. Labeling in the clinically normal specimen, diagnosed as mild dysplasia, is limited to the basal cell layer. These results taken together suggest that 2-NBDG can be topically delivered to intact oral mucosa and penetrate sufficiently deep to label the entire epithelial layer as well as sub-mucosal tumor cells. This trend was observed for all tissue slices irrespective of their radial location from the edge of the biopsy sample. Further to validate this observation, we have conducted a pilot study (results not shown) in which tissue biopsies are embedded in agarose to limit leakage from edges. In these embedded samples, we also observed a similar labeling and penetration of 2-NBDG.
To evaluate the contrast ratio of 2-NBDG labeling, we calculated the ratio of the mean epithelial fluorescence intensity in the clinically abnormal biopsy to that of the corresponding clinically normal biopsy. Results are plotted as a function of the histopathologic diagnosis in Fig.4; error bars indicate the standard deviation. Results show that the mean fluorescence intensity of clinically abnormal samples is significantly higher than the mean fluorescence intensity of the clinically normal samples.
Figure 4.
Ratiometric contrast measure based on the ratio of the mean fluorescence intensity of the clinically abnormal epithelium to that of the clinically normal epithelium from the same patient. Results are plotted as a function of histopathologic diagnosis.
Our next goal was to evaluate the potential contrast available in widefield images using topically labeled intact tissue biopsies and resected tumor samples. Table 1 (Patient #13-20) shows the details of 8 paired biopsy sets that were evaluated using widefield imaging. Figure 5a shows representative widefield fluorescence images of a set of three biopsy specimens from one patient. The upper specimen was clinically and histologically normal while the lower two specimens were clinically abnormal and diagnosed as invasive cancer. Pre-contrast images (Fig. 5a left) were acquired before the application of 2-NBDG to provide a measure of the autofluorescence of each sample. In the pre-contrast images, the two lower specimens diagnosed as cancer have significantly lower autofluorescence signal than the normal specimen. In the post-contrast images (Fig. 5a right) after application of 2-NBDG, we observed a significant increase in the fluorescence signal of the cancer specimens; in contrast there was little change in the fluorescence of the normal specimen. Figure 5(b) shows the mean fluorescence intensities calculated for each specimen in the pre- and post-contrast images. Results demonstrate a substantial increase in the mean fluorescence intensity of the samples diagnosed as cancer and show only a small increase in the mean fluorescence intensity for the clinically normal sample.
Figure 5.


(a): Widefield fluorescence images of three oral specimens obtained pre- (left) and post- (right) labeling with 2-NBDG. The top specimen was clinically and histologically normal and the bottom two specimens were clinically abnormal and diagnosed as invasive cancer. (b): Mean fluorescence intensity calculated from pre- and post-contrast widefield images of intact biopsy specimens shown in (a). (c): Differential contrast measure based on the ratio of the increase in the mean fluorescence intensity of clinically abnormal epithelium to that of clinically normal epithelium from paired samples in 8 patients following labeling with 2-NBDG. Results are plotted as a function of histopathologic diagnosis. Scale bar represents 6.5 mm.
Figure 5(c) shows the differential contrast observed after 2-NBDG labeling for 8 pairs of clinically normal and abnormal samples as a function of the histologic diagnosis. Differential contrast was calculated as the ratio of the increase in the mean fluorescence intensity following labeling of the abnormal specimen relative to the increase in mean fluorescence intensity of the corresponding clinically normal sample. The differential contrast captures differences in both 2-NBDG associated fluorescence as well as differences in levels of tissue autofluorescence between clinically normal and abnormal samples. As shown in Fig. 5(c), the differential contrast achieved post-labeling ranges from 15-40 fold.
Microendoscopic probe based imaging
Figure 6 shows high-resolution fluorescence images of a clinically abnormal tissue biopsy topically labeled with 2-NBDG obtained with a commercial confocal system (Fig. 6a) and a fiber-optic fluorescence micro-endoscope (Fig. 6b). The specimen was diagnosed as invasive cancer. Both images show uptake of 2-NBDG within cells, and the micro-endoscope image illustrates the potential to obtain fluorescence images of 2-NBDG labeled tissue in real time. With the microendoscopic probe, the morphologic features of the tissue can be imaged with sub-cellular resolution and the signal to noise ratio from the labeled tissue biopsy is comparable with the results from a commercial confocal system.
Figure 6.


Comparison of high-resolution fluorescence imaging of 2-NBDG labeled oral cancer specimen obtained with (a): a commercial confocal microscope and (b): a fiber-optic fluorescence microendoscope. Scale bar represents 100 microns.
Discussion
Clinical detection of epithelial pre-malignant lesions and early stage carcinoma depends heavily on the experience of the examining clinician and the histopathologic evaluation of the targeted tissue. This is time consuming, costly and invasive in nature. New imaging approaches which utilize the differences in the autofluorescence of normal and neoplastic mucosa have shown promise as adjuncts for improving early detection of epithelial neoplasia in many organ sites 32, 33. However, the combination of fluorescence imaging with exogenously administered molecular-targeted contrast agents may allow for the simultaneous improvement in early detection and molecular characterization of early neoplastic lesions. To achieve this potential, there is a need to develop new optical contrast agents for molecular imaging25, 34. Currently, only indocyanine green and fluorescein are approved as fluorescent contrast agents for clinical applications25, 35-37. The contrast mechanism for these agents is based on non-specific accumulation of dye in the target tissue site. Alternatively, molecular imaging with targeted, optically active agents has the potential to improve early stage detection of neoplasia in a clinical setting. Prior work has shown the potential of fluorescent glucose analogues to image glucose metabolism in cancer cells lines and in tumor models in small animals22-24.
Our study provides an evaluation of the potential of 2-NBDG, a fluorescent analogue of FDG PET, for molecular imaging of oral neoplasia using clinical biopsies and resected tumor samples from the oral cavity. The results show an appreciable image contrast between normal and neoplastic samples labeled with 2-NBDG in wide field and high resolution fluorescence imaging modes. The results of this study provide a preliminary step towards clinical translation of 2-NBDG for optical imaging of oral neoplasia.
Using high resolution imaging, we show that topically delivered 2-NBDG can target cells throughout the entire epithelium, including cells adjacent to the basement membrane as well as sub-surface nests of tumor cells. The amount of 2-NBDG delivered using topical application is sufficient to produce contrast in both high resolution and widefield imaging. The advantages of non-invasive topical delivery are important; in most current molecular imaging applications, contrast agents are delivered using intravenous injection. Under these circumstances, contrast agent delivery is controlled in large part by blood circulation. This can limit the effective targeting of epithelial surfaces needed for detection of pre-invasive epithelial neoplasia due to the lack of vasculature in the epithelial layer. In this study, we show that topical delivery of 2-NBDG can yield significant contrast with relatively short incubation time. The topical method of delivery also can potentially reduce the non-specific interaction of molecular contrast agents with non-targeted tissues and can reduce the amount of contrast agent required for imaging applications.
Previous studies22 of 2-NBDG in cancer cell lines have shown rapid uptake of contrast agents by cancer cells, with a peak uptake within 15 minutes of incubation. Our results in cell lines show similar uptake kinetics, and results of topical delivery in whole biopsies and resected tumors showed effective contrast in both high resolution and widefield imaging after ∼30 minute incubation.
Our results demonstrate substantially higher 2-NBDG uptake in pre-neoplastic and neoplastic samples than in corresponding normal controls, reflecting increases in the metabolic activity of neoplastic oral tissue. The ratiometric contrast after labeling shows that the mean fluorescence intensity in neoplastic samples is significantly higher than the mean intensity in normal samples. In the cohort of specimens, the ratiometric contrast values for neoplastic samples relative to their corresponding normal samples ranged from 2 to 5 fold. Image contrast can be further enhanced by acquiring fluorescence images both pre- and post-labeling. The differential contrast measure reported here combines differences in autofluorescence and 2-NBDG associated fluorescence. This differential contrast provided a difference in signal for normal and neoplastic samples which ranged from 15 to 40 fold; a much larger ratio between clinically abnormal and normal biopsies as compared to the simple ratiometric contrast measure assessed post-labeling. The results of high resolution imaging using fiber optic based microendoscopic probe highlights the potential of real time in vivo imaging of 2-NBDG labeling in a clinical setting.
Although based on a relatively small number of clinical samples, the ratiometric and differential contrast ratios provide good separation of normal and neoplastic specimens. However, to assess the sensitivity of this approach for diagnosis of various stages of oral neoplasia ranging from mild-moderate dysplasia to cancer will require further studies with a larger number of specimens. These studies should include specimens from many anatomic sites within the oral cavity to assess the degree to which variations in the ratiometric and differential contrast ratios reported here reflect both differences in the histopathology as well as in the anatomic site of the specimen. Future clinical and animal studies are also required to establish the safety of 2-NBDG for clinical imaging in vivo as per regulatory standards. Further to successfully translate 2-NBDG based optical imaging to in-vivo clinical practice, future studies are required to develop optimal formulation (paste/gel) etc. of 2-NBDG to topical deliver contrast agent in oral cavity. In addition, future studies will also be required to determine optimal operational conditions such as fasting of patients to obtain effective contrast.
In summary, we evaluated 2-NBDG as a potential contrast agent for non-invasive detection of oral neoplasia. The results of the study using high-resolution confocal, real–time microendoscopic and widefield imaging illustrate that 2-NBDG can be used to detect neoplasia in clinical samples, highlighting its potential for clinical translation. The unique combination of high resolution and widefield imaging with topical application makes this contrast agent attractive for early detection of oral neoplasia in a clinical setting, and suggest that this approach has the potential to image pre-invasive disease in a manner that cannot currently is challenging to observe with PET imaging due to its limited spatial resolution.
Acknowledgement
We thank Vivian Mack for providing help with cell cultures, and BRP R01CA103830 NCI for funding.
Footnotes
This paper describes optical molecular imaging of glucose uptake in oral tissue and its potential for clinical diagnosis of oral neoplasia at the point-of-care.
References
- 1.Blasberg RG. Molecular imaging and cancer. Mol Cancer Ther. 2003;2(3):335–43. [PubMed] [Google Scholar]
- 2.Gelovani Tjuvajev J, Blasberg RG. In vivo imaging of molecular-genetic targets for cancer therapy. Cancer Cell. 2003;3(4):327–32. doi: 10.1016/s1535-6108(03)00082-5. [DOI] [PubMed] [Google Scholar]
- 3.Massoud TF, Gambhir SS. Molecular imaging in living subjects: seeing fundamental biological processes in a new light. Genes Dev. 2003;17(5):545–80. doi: 10.1101/gad.1047403. [DOI] [PubMed] [Google Scholar]
- 4.Massoud TF, Gambhir SS. Integrating noninvasive molecular imaging into molecular medicine: an evolving paradigm. Trends Mol Med. 2007;13(5):183–91. doi: 10.1016/j.molmed.2007.03.003. [DOI] [PubMed] [Google Scholar]
- 5.Pomper MG. Translational molecular imaging for cancer. Cancer Imaging. 2005;5(Spec No A):S16–26. doi: 10.1102/1470-7330.2005.0101. [DOI] [PMC free article] [PubMed] [Google Scholar]
- 6.Jaffer FA, Weissleder R. Molecular imaging in the clinical arena. Jama. 2005;293(7):855–62. doi: 10.1001/jama.293.7.855. [DOI] [PubMed] [Google Scholar]
- 7.Mankoff DA, Shields AF, Krohn KA. PET imaging of cellular proliferation. Radiol Clin North Am. 2005;43(1):153–67. doi: 10.1016/j.rcl.2004.09.005. [DOI] [PubMed] [Google Scholar]
- 8.Muzi M, Vesselle H, Grierson JR, Mankoff DA, Schmidt RA, Peterson L, Wells JM, Krohn KA. Kinetic analysis of 3′-deoxy-3′-fluorothymidine PET studies: validation studies in patients with lung cancer. J Nucl Med. 2005;46(2):274–82. [PubMed] [Google Scholar]
- 9.Stokkel MP, ten Broek FW, van Rijk PP. The role of FDG PET in the clinical management of head and neck cancer. Oral Oncol. 1998;34(6):466–71. doi: 10.1016/s1368-8375(98)00050-5. [DOI] [PubMed] [Google Scholar]
- 10.Larson SM. Positron emission tomography-based molecular imaging in human cancer: exploring the link between hypoxia and accelerated glucose metabolism. Clin Cancer Res. 2004;10(7):2203–4. doi: 10.1158/1078-0432.ccr-0002-4. [DOI] [PubMed] [Google Scholar]
- 11.Rajendran JG, Mankoff DA, O'Sullivan F, Peterson LM, Schwartz DL, Conrad EU, Spence AM, Muzi M, Farwell DG, Krohn KA. Hypoxia and glucose metabolism in malignant tumors: evaluation by [18F]fluoromisonidazole and [18F]fluorodeoxyglucose positron emission tomography imaging. Clin Cancer Res. 2004;10(7):2245–52. doi: 10.1158/1078-0432.ccr-0688-3. [DOI] [PubMed] [Google Scholar]
- 12.Shaw RJ. Glucose metabolism and cancer. Curr Opin Cell Biol. 2006;18(6):598–608. doi: 10.1016/j.ceb.2006.10.005. [DOI] [PubMed] [Google Scholar]
- 13.Yoshioka K, Takahashi H, Homma T, Saito M, Oh KB, Nemoto Y, Matsuoka H. A novel fluorescent derivative of glucose applicable to the assessment of glucose uptake activity of Escherichia coli. Biochim Biophys Acta. 1996;1289(1):5–9. doi: 10.1016/0304-4165(95)00153-0. [DOI] [PubMed] [Google Scholar]
- 14.Manganaro AM. Review of the transmucosal drug delivery. Mil Med. 1997;162(1):27–30. [PubMed] [Google Scholar]
- 15.Senel S, Hincal AA. Drug permeation enhancement via buccal route: possibilities and limitations. J Control Release. 2001;72(1-3):133–44. doi: 10.1016/s0168-3659(01)00269-3. [DOI] [PubMed] [Google Scholar]
- 16.Squier CA, Kremer MJ, Bruskin A, Rose A, Haley JD. Oral mucosal permeability and stability of transforming growth factor beta-3 in vitro. Pharm Res. 1999;16(10):1557–63. doi: 10.1023/a:1015052520467. [DOI] [PubMed] [Google Scholar]
- 17.Yoshioka K, Oh KB, Saito M, Nemoto Y, Matsuoka H. Evaluation of 2-[N-(7-nitrobenz-2-oxa-1,3-diazol-4-yl)amino]-2-deoxy-D-glucose, a new fluorescent derivative of glucose, for viability assessment of yeast Candida albicans. Appl Microbiol Biotechnol. 1996;46(4):400–4. doi: 10.1007/BF00166236. [DOI] [PubMed] [Google Scholar]
- 18.Yoshioka K, Saito M, Oh KB, Nemoto Y, Matsuoka H, Natsume M, Abe H. Intracellular fate of 2-NBDG, a fluorescent probe for glucose uptake activity, in Escherichia coli cells. Biosci Biotechnol Biochem. 1996;60(11):1899–901. doi: 10.1271/bbb.60.1899. [DOI] [PubMed] [Google Scholar]
- 19.Natarajan A, Srienc F. Dynamics of glucose uptake by single Escherichia coli cells. Metab Eng. 1999;1(4):320–33. doi: 10.1006/mben.1999.0125. [DOI] [PubMed] [Google Scholar]
- 20.Oh KB, Matsuoka H. Rapid viability assessment of yeast cells using vital staining with 2-NBDG, a fluorescent derivative of glucose. Int J Food Microbiol. 2002;76(1-2):47–53. doi: 10.1016/s0168-1605(01)00750-4. [DOI] [PubMed] [Google Scholar]
- 21.Itoh Y, Abe T, Takaoka R, Tanahashi N. Fluorometric determination of glucose utilization in neurons in vitro and in vivo. J Cereb Blood Flow Metab. 2004;24(9):993–1003. doi: 10.1097/01.WCB.0000127661.07591.DE. [DOI] [PubMed] [Google Scholar]
- 22.O'Neil RG, Wu L, Mullani N. Uptake of a fluorescent deoxyglucose analog (2-NBDG) in tumor cells. Mol Imaging Biol. 2005;7(6):388–92. doi: 10.1007/s11307-005-0011-6. [DOI] [PubMed] [Google Scholar]
- 23.Cheng Z, Levi J, Xiong Z, Gheysens O, Keren S, Chen X, Gambhir SS. Near-infrared fluorescent deoxyglucose analogue for tumor optical imaging in cell culture and living mice. Bioconjug Chem. 2006;17(3):662–9. doi: 10.1021/bc050345c. [DOI] [PMC free article] [PubMed] [Google Scholar]
- 24.Zhang Z, Li H, Liu Q, Zhou L, Zhang M, Luo Q, Glickson J, Chance B, Zheng G. Metabolic imaging of tumors using intrinsic and extrinsic fluorescent markers. Biosens Bioelectron. 2004;20(3):643–50. doi: 10.1016/j.bios.2004.03.034. [DOI] [PubMed] [Google Scholar]
- 25.Bremer C, Ntziachristos V, Weissleder R. Optical-based molecular imaging: contrast agents and potential medical applications. Eur Radiol. 2003;13(2):231–43. doi: 10.1007/s00330-002-1610-0. [DOI] [PubMed] [Google Scholar]
- 26.Sokolov K, Aaron J, Hsu B, Nida D, Gillenwater A, Follen M, MacAulay C, Adler-Storthz K, Korgel B, Descour M, Pasqualini R, Arap W, et al. Optical systems for in vivo molecular imaging of cancer. Technol Cancer Res Treat. 2003;2(6):491–504. doi: 10.1177/153303460300200602. [DOI] [PubMed] [Google Scholar]
- 27.Sokolov K, Galvan J, Myakov A, Lacy A, Lotan R, Richards-Kortum R. Realistic three-dimensional epithelial tissue phantoms for biomedical optics. J Biomed Opt. 2002;7(1):148–56. doi: 10.1117/1.1427052. [DOI] [PubMed] [Google Scholar]
- 28.Darren R, Kurachi C, Sokolov K, El-Naggar AK, Williams MD, Gillenwater A, Richards-Kortum R. A multispectral optical imaging device for in vivo detection of oral neoplasia. doi: 10.1117/1.2904658. Submitted. [DOI] [PMC free article] [PubMed] [Google Scholar]
- 29.Hsu ER, Gillenwater AM, Hasan MQ, Williams MD, El-Naggar AK, Richards-Kortum RR. Real-time detection of epidermal growth factor receptor expression in fresh oral cavity biopsies using a molecular-specific contrast agent. Int J Cancer. 2006;118(12):3062–71. doi: 10.1002/ijc.21720. [DOI] [PubMed] [Google Scholar]
- 30.Carlson AL, Coghlan LG, Gillenwater AM, Richards-Kortum RR. Dual-mode reflectance and fluorescence near-video-rate confocal microscope for architectural, morphological and molecular imaging of tissue. J Microsc. 2007;228(Pt 1):11–24. doi: 10.1111/j.1365-2818.2007.01818.x. [DOI] [PubMed] [Google Scholar]
- 31.Muldoon TJ, Nida DL, Williams MD, Gillenwater A, Richards-Kortum R. Subcellular resolution molecular imaging within living tissue by fiber microendoscopy. doi: 10.1364/oe.15.016413. Submitted. [DOI] [PMC free article] [PubMed] [Google Scholar]
- 32.Lane PM, Gilhuly T, Whitehead P, Zeng H, Poh CF, Ng S, Williams PM, Zhang L, Rosin MP, MacAulay CE. Simple device for the direct visualization of oral-cavity tissue fluorescence. J Biomed Opt. 2006;11(2):024006. doi: 10.1117/1.2193157. [DOI] [PubMed] [Google Scholar]
- 33.Poh CF, Zhang L, Anderson DW, Durham JS, Williams PM, Priddy RW, Berean KW, Ng S, Tseng OL, MacAulay C, Rosin MP. Fluorescence visualization detection of field alterations in tumor margins of oral cancer patients. Clin Cancer Res. 2006;12(22):6716–22. doi: 10.1158/1078-0432.CCR-06-1317. [DOI] [PubMed] [Google Scholar]
- 34.Kelloff GJ, Krohn KA, Larson SM, Weissleder R, Mankoff DA, Hoffman JM, Link JM, Guyton KZ, Eckelman WC, Scher HI, O'Shaughnessy J, Cheson BD, et al. The progress and promise of molecular imaging probes in oncologic drug development. Clin Cancer Res. 2005;11(22):7967–85. doi: 10.1158/1078-0432.CCR-05-1302. [DOI] [PubMed] [Google Scholar]
- 35.Fischer T, Gemeinhardt I, Wagner S, Stieglitz DV, Schnorr J, Hermann KG, Ebert B, Petzelt D, Macdonald R, Licha K, Schirner M, Krenn V, Kamradt T, Taupitz M. Assessment of unspecific near-infrared dyes in laser-induced fluorescence imaging of experimental arthritis. Acad Radiol. 2006;13(1):4–13. doi: 10.1016/j.acra.2005.07.010. [DOI] [PubMed] [Google Scholar]
- 36.Koyama T, Tsubota A, Nariai K, Mitsunaga M, Yanaga K, Takahashi H. Novel biomedical imaging approach for detection of sentinel nodes in an experimental model of gastric cancer. Br J Surg. 2007;94(8):996–1001. doi: 10.1002/bjs.5650. [DOI] [PubMed] [Google Scholar]
- 37.Licha K, Riefke B, Ntziachristos V, Becker A, Chance B, Semmler W. Hydrophilic cyanine dyes as contrast agents for near-infrared tumor imaging: synthesis, photophysical properties and spectroscopic in vivo characterization. Photochem Photobiol. 2000;72(3):392–8. doi: 10.1562/0031-8655(2000)072<0392:hcdaca>2.0.co;2. [DOI] [PubMed] [Google Scholar]