Abstract
Due to its ability to emit light, the luciferase from Renilla reniformis (RLuc) is widely employed in molecular biology as a reporter gene in both cell culture experiments and small animal imaging. To accomplish this bioluminesce, the 37 KDa enzyme catalyzes the degradation of its substrate coelenterazine in the presence of molecular oxygen, resulting in the product coelenteramide, carbon dioxide, and the desired photon of light. We successfully crystallized a stabilized variant of this important protein (RLuc8), and present the first structures for any coelenterazine-using luciferase. These structures are based on high resolution data measured to 1.4 Å and demonstrate a classic α/β-hydrolase fold. We also present data of a coe-lenteramide bound-luciferase, and reason that this structure represents a secondary conformational form following shift of the product out of the primary active site. During the course of this work, the structure of the luciferase’s accessory green fluorescent protein (RrGFP) was determined as well and shown to be highly similar to that of Aequorea GFP.
Keywords: luciferase, green fluorescent protein, Renilla reniformis, coelenterazine, alpha/beta-hydrolase
Introduction
Luciferases have become important research tools over the last two decades, due to their ability to emit light and therefore be monitored externally to the milieu they reside in. This ability has seen these bioluminescent proteins utilized widely as reporter genes in cell culture experiments and more recently in the context of small animal imaging [1]. The two main classes of luciferases employed as research tools are the beetle and coelenterazine luciferases. The beetle luciferases (e. g. firefly) use D-luciferin as their substrate, are highly similar (≥ 45% [2]), and have been extensively studied including structurally [3].
In contrast, no similarity is seen between most of the coelenterazine using luciferases identified so far (e. g. Gaussia, Renilla, Pleuromamma, Oplophorus) [4], even when the luciferases originate from species within the same family (Gaussia versus Pleuromamma). This has been taken to indicate that coelenterazine utilizing luciferases have emerged multiple times throughout the course of evolution. Of the coelenterazine luciferases, the luciferase from Renilla reniformis (RLuc) has been the most extensively studied [5] and the most widely employed for research use. To date, however, no structure has been elucidated of any of the coelenterazine using luciferases, including RLuc.
In Renilla reniformis, RLuc is found in membrane-bound intracellular structures within specialized light emitting cells [6,7] along with two other proteins, a closely interacting green fluorescent protein (RrGFP) [8], and a Ca++ activated luciferin binding protein (RrLBP) [9] (the almost identical luciferin binding protein from Renilla mülleri has recently been crystallized [10]). The chemical reaction that transpires in RLuc mediated bioluminescence involves the catalytic degradation of coelenterazine and proceeds through a dioxetane (also called dioxetanone or cyclic peroxide) intermediate step [11]. In vitro the reaction yields blue light (480 nm peak), but in vivo it is not RLuc that is the light emitter but rather RrGFP. The energy released by the luciferase catalyzed oxidation of coelenterazine is passed via resonance energy transfer to the fluorophore of RrGFP and emitted as a green photon [12], explaining the 505 nm peaked bioluminescence observed from the animal.
Since the cloning of the gene for RLuc [13] this luciferase has been widely used in molecular biology, mainly as a reporter gene. More recently the gene has been incorporated into reporter applications of increasing complexity, including fusion reporter genes [14–16], split-reporter complementation systems [17], and resonance energy transfer based sensors [18,19]. Work has also emerged utilizing variants of Renilla luciferase to create novel imaging probes by fusing the luciferase to engineered antibodies [20] and to generate self-illuminating quantum dots by attaching the luciferase as an internal light source [21]. In the development of these and other applications, the tertiary structure of the protein would be helpful in understanding the most effective way to employ the luciferase. For instance, structural data would allow assessment of potential steric hindrance issues prior to the creation of fusion protein constructs involving RLuc, and to assess which residues are available for site-specific conjugation reactions. Structural data would also be helpful in guiding rational alteration of the enzyme in pursuit of beneficial modification of its spectral and enzymatic properties [22,23].
The current work has focused on an 8 mutation variant of RLuc (RLuc8) in lieu of the native enzyme, as this variant is both more stable and more easily expressed than the native enzyme [22]. The protein’s structure was successfully determined from crystals grown under a number of different conditions, with a product bound structure highlighting residues that had previously been found important for determining the enzyme’s emission spectrum [23]. As RrGFP is known to physically associate with RLuc in vitro, work with RrGFP was pursued as well. RrGFP was found to be structurally very similar to the green fluorescent protein from Aequorea victoria (AvGFP) with the exception of containing a much stronger dimerization interface.
Results
Protein Characterization
Periplasmically expressed and purified RLuc8 was characterized by light scattering and MALDI-TOF mass spectrometry to assess the oligomeric state and mass of the protein. Light scattering results indicated that RLuc8 existed as a monomer in solution, as molar mass moment calculations indicated a molecular weight of 33.8 kDa (error: 7%) with a relatively low polydispersity across the gel filtration elution profile (~11%). By mass spectrometry, the periplasmically expressed RLuc8 was measured as 36.8 kDa - within error of the expected size of 36.9 kDa. A minor peak around 38.5 kDa was noticed on some preparations, and may indicate that the PelB signal peptide was not consistently processed and removed. This potential issue was addressed by moving to the N-terminal cleavable 6xHis tag periplasmic expression construct (S3RLuc8) as well as cytoplasmic expression constructs. Following thrombin digestion and purification, mass spectrometry of the S3RLuc8 protein showed the desired single peak.
One nicety of RrGFP purification, is that the level of purity attained can easily be monitored by the ratio of the protein’s OD498 to OD280. Higher ratio values imply greater purity and/or a greater percentage of RrGFP in which the fluorophore has matured. The previously reported ratio for pure RrGFP extracted from Renilla reniformis is OD498/OD280=5.6 [8]. Following purification, the recombinantly produced RrGFP produced here had an OD498/OD280 ratio of 5.8. The ability of this 6xHis tagged RrGFP to interact and allow resonance energy transfer with the 6xHis tagged RLuc8 was confirmed by combining the two proteins in 10 mM NaCl, 10 mM HEPES pH 7.4 at protein concentrations that precluded trivial transfer mechanisms from playing a large role in the emission, and observing a green-peaked emission spectrum matching the emission spectrum of RrGFP following the addition of coelenterazine (data not shown, see [24]).
Crystallization Condition Screening
A large number of conditions as well as RLuc8 variants were evaluated, a full detailing of which is available elsewhere [24] and only a pertinent synopsis follows. Conditions which led to crystals used for X-ray diffraction are given in Table 1. Photographs of these crystals, along with crystals from other conditions, are shown in Supplemental Figure 1. The initial crystallization conditions identified, RLuc8:diammonium, RLuc8:KSCN, S3RLuc8:thiomaltoside, led to high quality crystals. However, the growth time of the crystals was on the order of 3–6 months, which microseeding failed to accelerate. Additionally, coelenterazine and its analogs are sparingly soluble in aqueous solution, and a crystallization condition was desired containing an organic component to allow an appreciable amount of substrate to be included in the crystallization.
Table 1.
Conditions leading to crystals used for X-diffraction. All conditions were at 20°C, and protein and mother liquor were combined in a 1:1 ratio. KSCN: potassium thiocyanate. MPD: 2-methyl-2,4-pentanediol.
| Label | ||
|---|---|---|
| RLuc8:diammonium | Protein | periplasmically expressed RLuc8 at 20 mg/ml |
| Time | 8 months | |
| Mother Liquor | 0.3 M NaCl, 1.25 M diammonium phosphate, 0.1 M imidazole pH 8.0 | |
| Cryoprotectant | 45% saturated sodium malonate | |
| RLuc8:KSCN | Protein | periplasmically expressed RLuc8 at 20 mg/ml |
| Time | 8 months | |
| Mother Liquor | 0.15 KSCN, 15% w/v PEG 6000, 0.1 M Tris-HCl pH 7.4 | |
| Cryoprotectant | 25% glycerol | |
| S3RLuc8:thiomaltoside | Protein | periplasmically expressed S3RLuc8 at 30 mg/ml |
| Time | 5 months | |
| Mother Liquor | 0.4 M sodium acetate, 20% w/v PEG 3350, 1.8 mM n-Decyl-β-D-thiomaltoside | |
| Cryoprotectant | 45% saturated sodium malonate | |
| RLuc8/K25A/E277A:PEG/isopropanol | Protein | cytoplasmically expressed RLuc8/K25A/E277A at 18 mg/ml |
| Time | 1 day | |
| Mother Liquor | 0.1 M HEPES pH 7.5, 10% v/v isopropanol with 6 mg/ml benzyl-coelenterazine, 15% w/v PEG 3350 | |
| Cryoprotectant | mother liquor + 35% MPD | |
| RLuc8:PEG/isopropanol | Protein | cytoplasmically expressed RLuc8 at 21 mg/ml |
| Time | 1 month, 2 days with microseeding | |
| Mother Liquor | 0.1 M HEPES pH 7.5, 10% v/v isopropanol with 6 mg/ml coelenterazine, 15% w/v PEG 3350 | |
| Cryoprotectant | mother liquor + 35% MPD | |
| RrGFP:PEG/MPD | Protein | cytoplasmically expressed RrGFP at 48 mg/ml |
| Time | 4 days | |
| Mother Liquor | 0.1 M HEPES pH 7.5, 10% w/v PEG 6000, 5% v/v MPD | |
| Cryoprotectant | mother liquor + 35% MPD |
One semi-rational method employed to aid in crystallization is to switch a small number of charged surface residues to alanines [25], with the rationale that removal of hydrophilic residues reduces the desolvation associated entropy loss from formation of protein-protein contacts. Generally, these mutations are done without knowledge of the tertiary structure of the protein [26]. In our case, a structure had already been solved, so mutations were chosen “intelligently” based on known crystal contacts. The residue pairs chosen were: K12A/E106A, K25A/E277A, and E183A/K227A. All possible permutations of these pairs were expressed, purified, and shown to retain at least 60% of the parental protein’s activity (Supplemental Table 1). This work led to crystallization conditions (RLuc8/K25A/E277A:PEG/isopropanol, RLuc8:PEG/isopropanol)) that allowed inclusion of appreciable amounts of substrate.
RrGFP was found to crystallize readily in a number of different mother liquors within time scales of minutes to days. RrGFP will in fact slowly crystallize over several months when stored in 10 mM NaCl, 10 mM HEPES pH 7.4. The best diffraction data was obtained with the RrGFP:PEG/MPD condition.
Screening of RrGFP and cytoplasmically expressed RLuc8 in a 2:1 molar ratio (one RrGFP dimer per RLuc8) produced co-crystals as demonstrated by gel electrophoresis. These crystals were needle-like and of insuffcient size to achieve diffraction below 5 Å. Molecular replacement using the RrGFP and RLuc8 structures on this low resolution co-crystal diffraction data was unsuccessful.
Structures of RLuc8
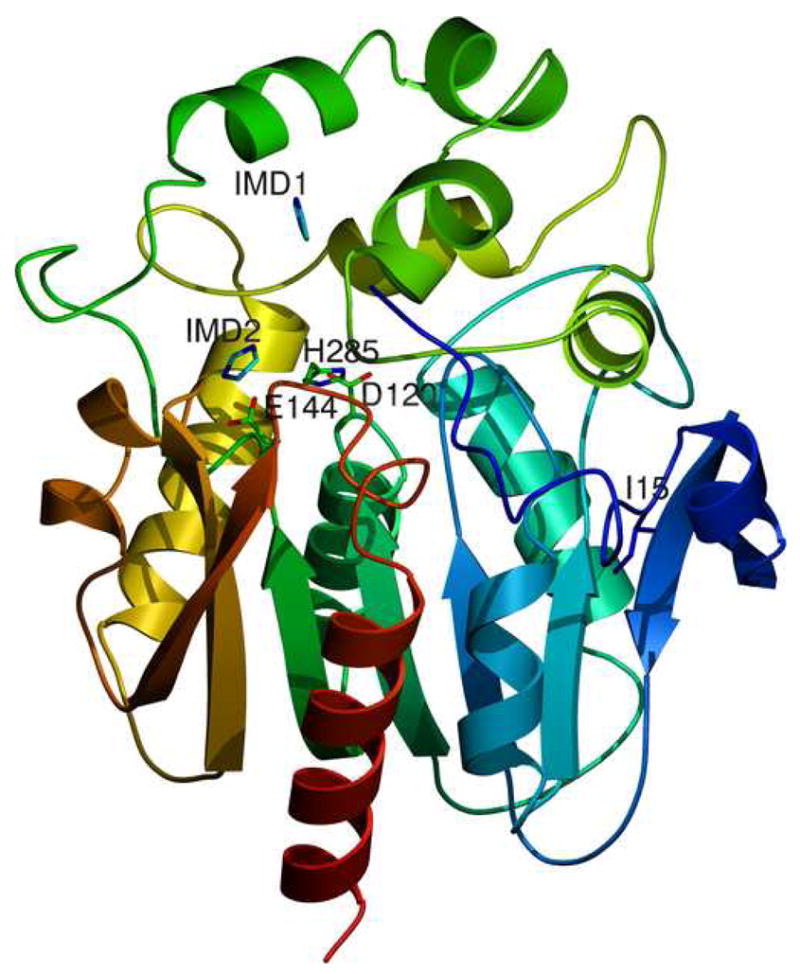
The structure derived from the RLuc8:diammonium condition is presented in Figure 1a, with statistics for this as well as structures discussed later given in Table 2. Residues 4–308 (of 311 total) were successfully identified in the electron density data. Not identified were two residues from the N-terminus, along with 3 residues on the C-terminus and the 6xHis tag. The resultant structure from the RLuc8:KSCN condition was almost identical to that from RLuc8:diammonium (Cα root mean square deviation 0.2 Å), with the sole exception that only one of the imidazoles (corresponding to IMD1 in Figure 1a) was observable in the data.
Figure 1.
Structure of the luciferase from Renilla reniformis
1a Cartoon representation of the structure derived from the RLuc8:diammonium condition. Residues 4–308 of RLuc8 are shown, with the N-terminus (N) in blue and the C-terminus (C) in red. The presumptive catalytic triad residues of D120, E144, and H285 [22] are marked, along with the two imidazole molecules (IMD1, IMD2) present in the structure. Also marked is the residue I15 mentioned in the discussion.
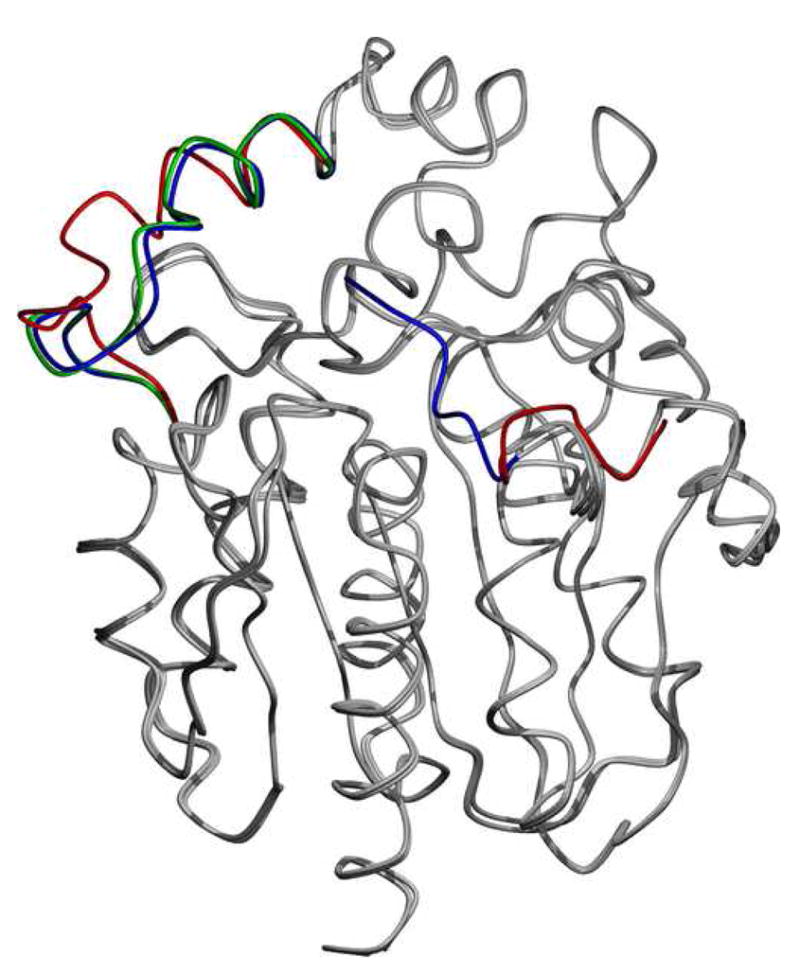
1b Superposition of the two monomers from the S3Rluc8:thiomaltoside condition and the diammonium structure. Regions that differ are the N-terminal domain and the loop domain over the active site. The regions of deviations are highlighted with blue for the diammonium condition, and red and green for monomers 1 and 2 of the thiomaltoside condition, respectively. Other than these two regions, the proteins are almost identical (Cα root mean square deviation <0.4 Å).
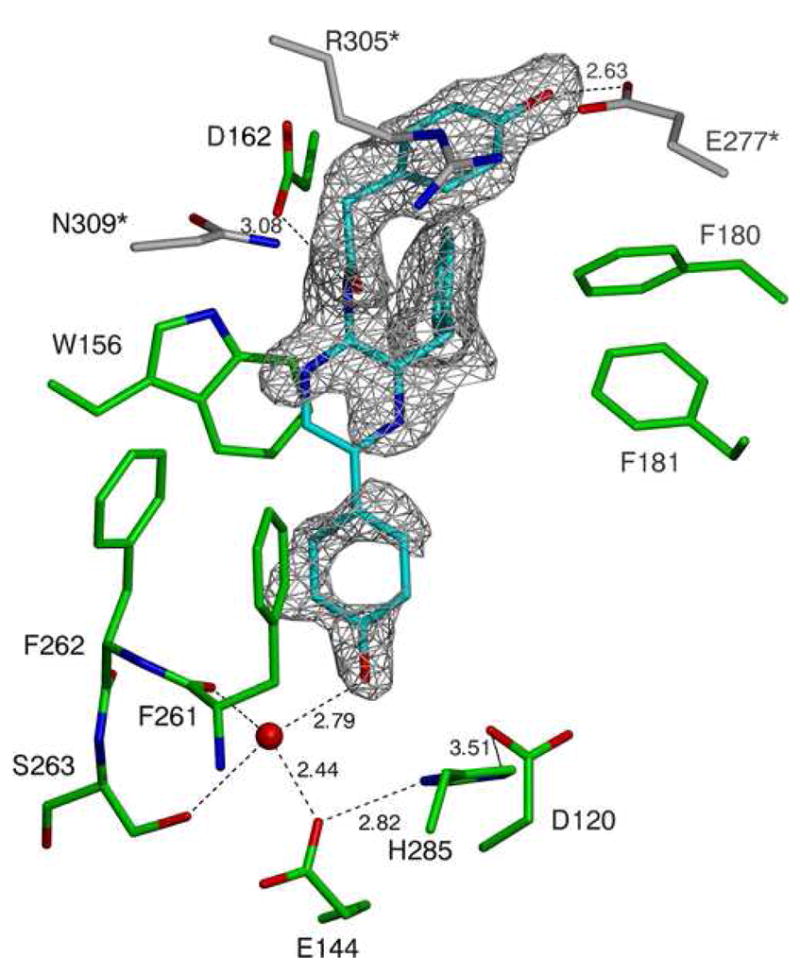
1c A close-up cartoon representation of the active site of the structure derived from the RLuc8:PEG/isopropanol condition. Coelenteramide is shown in cyan, residues from the luciferase molecule binding the coelenteramide are shown in green, and residues from the neighboring luciferase (via crystallographic contacts) are shown in gray. The red spheres represent water molecules, and the black dashed lines represent predicted hydrogen bonds. The gray mesh represents a σA weighted Fo - Fc difference map before the inclusion of the coelenteramide in the model phases, contoured at 2.0σ.
Table 2.
Statistics for the crystallographic structures of RLuc8 and related proteins as well as RrGFP. Crystallization conditions are given in Table 1. The cross-validation statistic Rfree was computed from a randomly chosen subset (5%) of the diffraction data that had been excluded from the model refinement process [59]. Rworking was calculated as Σhkl ||Fobs| – |Fcalc||/Σhkl |Fobs|.
| RLuc8 diammonium | RLuc8 KSCN | S3RLuc8 thiomaltoside | RLuc8/K25A/E277A PEG/isopropanol | RLuc8 PEG/isopropanol | RrGFP PEG/MPD | |
|---|---|---|---|---|---|---|
| Protein Database (PDB) ID | 2PSD | 2PSE | 2PSF | 2PSH | 2PSJ | 2PSL |
| Cell Parameters | ||||||
|
| ||||||
| space group | P 61 | P 61 | P 21 21 21 | P 21 | P 21 | P 21 21 2 |
| protomers/asymmetric unit | 1 | 1 | 2 | 2 | 2 | 4 |
| dimensions (Å) | ||||||
| a | 119.5 | 119.4 | 81.2 | 51.8 | 51.3 | 73.7 |
| b | 119.5 | 119.4 | 82.3 | 75.7 | 74.5 | 85.4 |
| c | 48.0 | 48.0 | 90.4 | 89.2 | 89.2 | 158.4 |
| angles (degrees) | ||||||
| β | 90.00 | 90.00 | 90.00 | 76.48 | 103.45 | 90.00 |
| Data Collection Statistics | ||||||
|
| ||||||
| number of reflections | 76,989 | 12,081 | 117,436 | 61,463 | 58,523 | 135,321 |
| possible reflections | 77,128 | 13,542 | 119,446 | 63,008 | 60,685 | 145,458 |
| completeness (%) | 99.8 | 89.2 | 98.3 | 98.3 | 96.4 | 93.0 |
| Model Statistics | ||||||
|
| ||||||
| resolution range (Å) | 50-1.4 | 44-2.5 | 50-1.4 | 50-1.8 | 50-1.8 | 50-1.55 |
| Rfree (%) | 18.3 | 23.2 | 19.4 | 22.9 | 21.6 | 34.2 |
| Rworking (%) | 16.5 | 19.1 | 17.3 | 19.5 | 18.9 | 30.3 |
| Rmerge (%) | 6.8 | 20.6 | 6.7 | 16.1 | 8.8 | 8.4 |
| r.m.s.d. bond lengths (Å) | 0.009 | 0.017 | 0.007 | 0.009 | 0.009 | 0.006 |
| r.m.s.d. bond angles (deg) | 1.4 | 1.6 | 1.2 | 1.2 | 1.2 | 0.857 |
| mean B factor (Å2) | 21.0 | 29.2 | 15.6 | 18.1 | 21.4 | 20.2 |
The crystals from the S3RLuc8:thiomaltoside condition were in an orthorhombic setting (rather than the hexagonal lattice observed for the diammonium phosphate and potassium thiocyanate conditions), and contained two protomers in the asymmetric unit. Interestingly, the N-terminal (residues 3–13) of one of the protomers in the asymmetric unit interacted with its neighboring protein, turning away from the presumptive active site in doing so, contrary to the observation in the diammonium phosphate structure. A superposition of the two monomers from this condition with the previous RLuc8:diammonium structure, shown in Figure 1b, highlights this change, as well as that the loop region containing residues 153–163 opened toward solvent. These findings were taken to imply that these regions of RLuc8 are structurally flexible.
The crystal structure obtained from the RLuc8/K25A/E277A:PEG/isopropanol condition lacked sufficient electron density to allow placement of a portion of the cap domain (residues 153–162), which again would be consistent with flexibility in this region of the protein. In addition to these missing residues, neither substrate nor product could be identified in the electron density. Unexpectedly, the surface mutations (K25A, E277A) made in this construct with the intention that they would aid in crystallization were not involved in contacts between proteins in this crystal.
Further screening led to RLuc8:PEG/isopropanol, which successfully yielded electron density for the reaction product coelenteramide in difference maps of the active site (Figure 1c), although the density in parts of the coelenteramide structure appear weak suggesting disorder of either static or dynamic nature. The locations of residues 153–154 were disordered as well and were not included in the model.
A possible explanation for the preference of benzyl-coelenterazine in crystallizing RLuc8/K25A/E277A versus coelenterazine in crystallizing RLuc8, can be proposed based on the interactions of coelenteramide with the protein’s residues as shown in Figure 1c. This closeup shows that a hydroxyl group in coelenteramide interacts with E277 through a predicted hydrogen bond. In RLuc8/K25A/E277A, this glutamate has been mutated to alanine and the predicted hydrogen bond cannot form. Benzyl-coelenterazine lacks this hydroxyl group; presumably there is a favorable hydrophobic interaction between A277 and the hydroxyl-lacking benzene ring.
Variants of the protein RLuc8/K25A/E277A were created containing alanine substitutions at the presumptive catalytic triad residues D120, E144, or H285 [22], with the hope that these potentially inactivating mutations would allow crystallization of the protein in complex with substrate rather than product. However, neither coelenterazine nor coelenteramide was observed in the resulting electron density maps derived from these crystals.
Structure of RrGFP
The resulting structure from X-ray diffraction of the RrGFP:PEG/MPD crystallization condition is presented in Figure 2a, with the corresponding statistics given in Table 2. In the obtained structure of RrGFP, the initial 6 and last 7 amino acids of the primary sequence could not be located in the electron density. Although the electron density maps were of very high quality, the R factors were unusually high (~30%), suggesting some type of disorder or deviation from ideality that could not be modeled using translation/libration/screw (TLS) models for each protomer [27] - one such possibility is the high solvent B factor (~69) and low Wilson B (~14), suggesting a significant amount of solvent disorder relative to protein.
Figure 2.
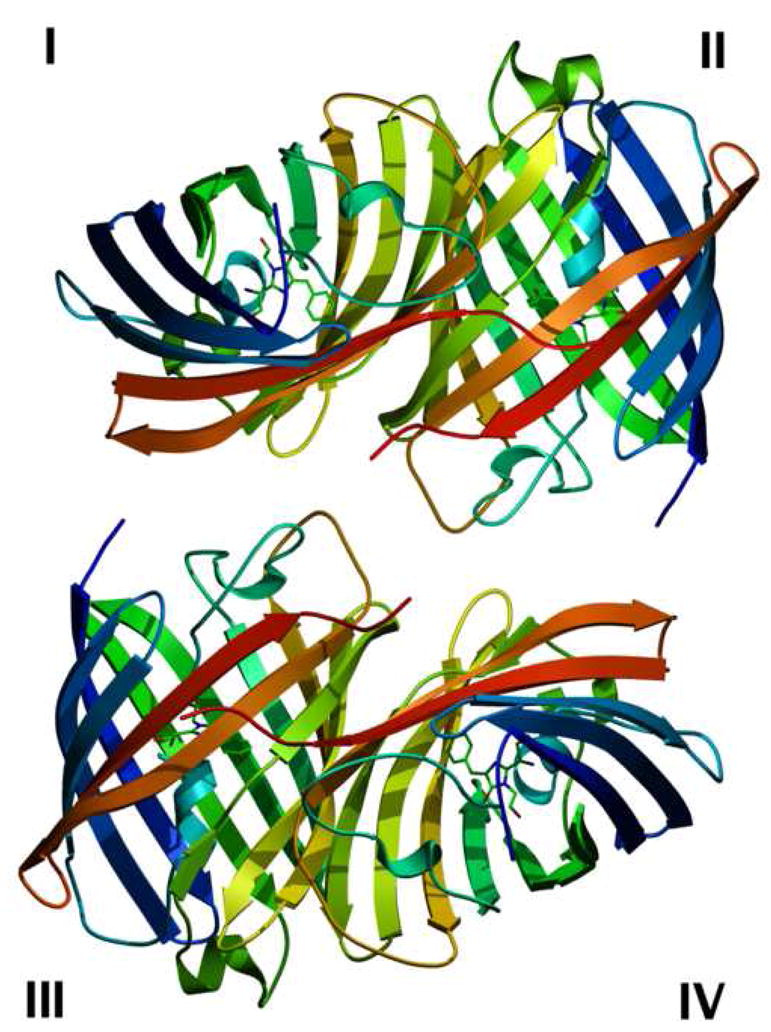
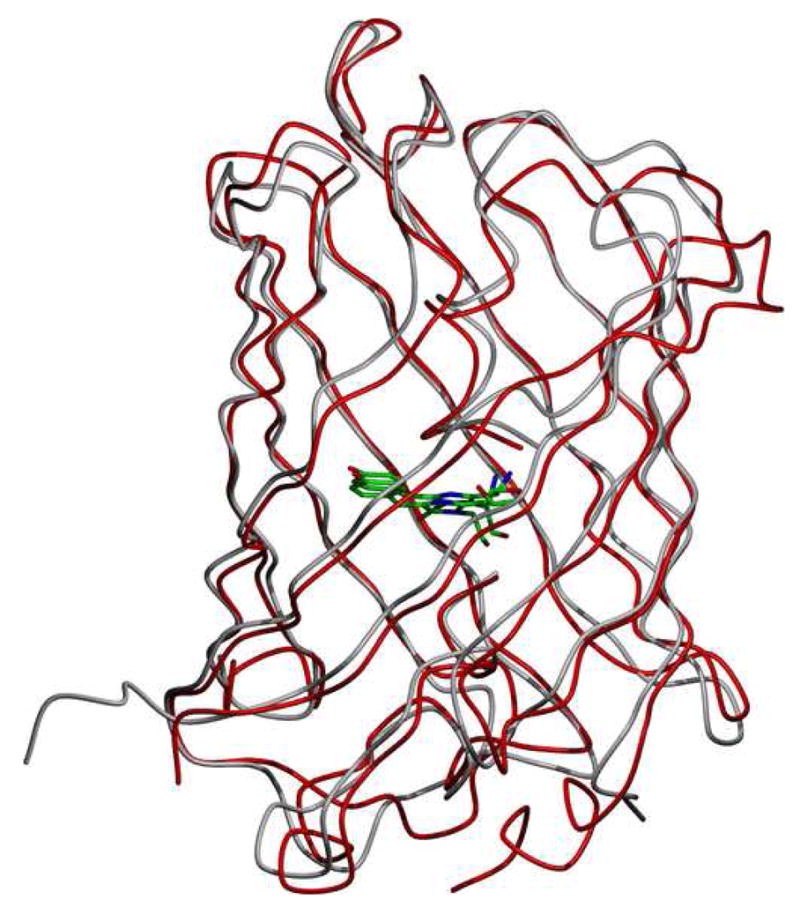
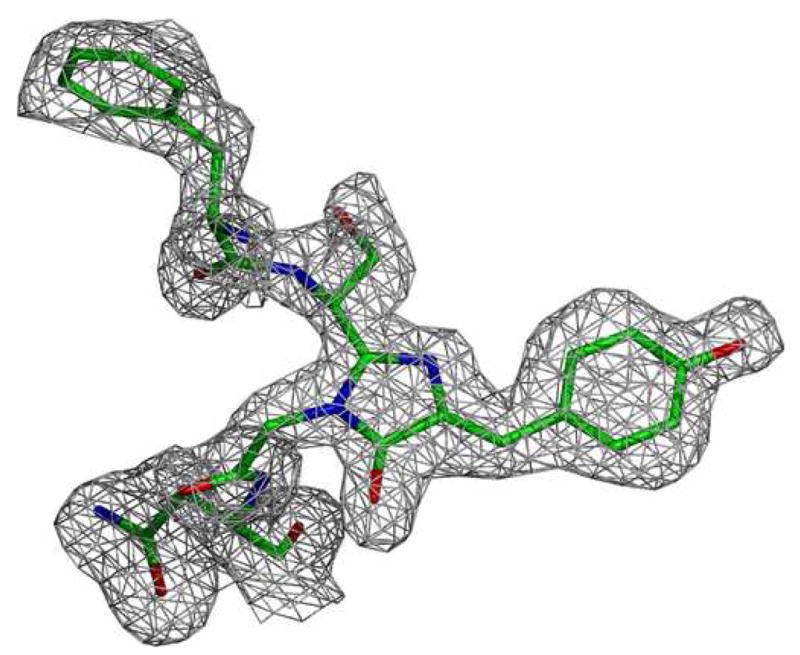
Structure of the green fluorescent protein from Renilla reniformis (RrGFP). The condition used is labeled as RrGFP:PEG/MPD in Table 1. Residues from 7–226 (of 233 total) were identified in the data.
2a Cartoon representation of a single unit cell of the RrGFP crystal. The four protomers in each unit cell are labeled I–IV. For each protomer, its N-terminus is shown in blue and its C-terminus is shown in red.
2b Superposition of RrGFP and the GFP from Aequorea victoria (AvGFP). The molecule at the center of the β-barrel is the fluorophore. The primary sequences of the two GFPs are 28% identical and 50% similar. PDB ID 1EMA was used for the AvGFP structure [58].
2c Close-up cartoon representation of the RrGFP fluorophore. The gray mesh represents a σA weighted Fo − Fc difference map before the inclusion of the coelenteramide in the model phases, contoured at 2.0σ.
The tertiary fold pattern seen is the classic β-barrel characteristic of the fluorescent proteins, and the expected fluorophore of p-hydroxybenzylidene-imid-azolidone was readily apparent in the electron density data (Figure 2c) [28,29]. A comparison of RrGFP and AvGFP is shown in Figure 2b. Unsurprisingly given the close primary sequence similarity between RrGFP and AvGFP (50% similar, 28% identical), the resultant structure for RrGFP is analogous to the previously known structure for AvGFP (Cα root mean square deviation 1.4 Å).
RrGFP is known to be a dimer [8]. Accessible surface area (ASA) calculations for the interface between the protomers I and II (equivalently III and IV) in Figure 2a yield an interface interface ASA of 1316 Å2 and 14 hydrogen bonds, appropriate values for a dimerization interface [30]. In contrast, the other interface in the crystallographic unit (I–III, or II–IV) had an interface ASA of 156 Å2 and 1 hydrogen bond. For comparison, AvGFP, which is known to weakly dimerize [31], has an ASA of 848 Å2, and 8 hydrogen bonds on the interface corresponding to the dimerization interface of RrGFP.
Discussion
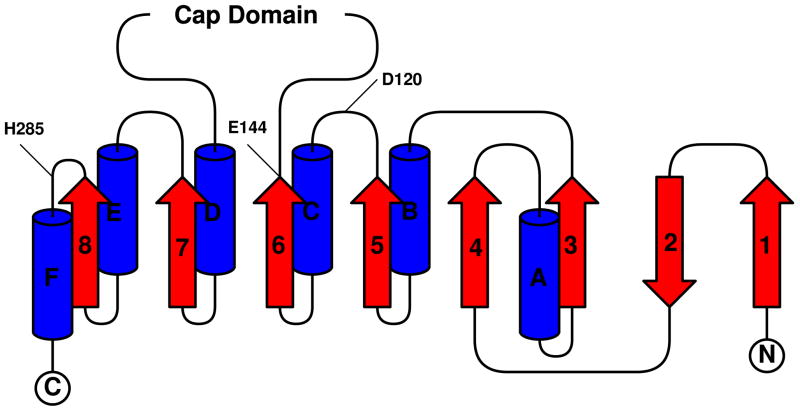
Much like the similar bacterial haloalkane dehalogenase [32], Renilla luciferase has a characteristic α/β-hydrolase fold sequence at its core [33] and shares the conserved catalytic triad of residues employed by the dehalogenases [22]. The level of primary sequence similarity is somewhat surprising given that the dehalogenases are hydrolases while the luciferase is an oxidase, and hypotheses on how this situation may have came to be from an evolutionary standpoint have previously been discussed [22]. Now with the structure of the luciferase, the high level of tertiary structure similarity to the haloalkane dehalogenases can be noted as well (Cα root mean square deviations ~1.5 Å for LinB structures). A topological map of the RLuc8 α/β-hydrolase fold is shown in Figure 3a, along with the locations of the presumptive catalytic triad residues D120/E144/H285A within this diagram. α/β-hydrolases have their nucleophile (D120 in RLuc) immediately after the fifth β-sheet (β5) in what is termed the “nucleophile elbow”. The sequence pattern for this elbow is generally G-X-Nuc-X-G [34] in the α/β-hydrolases, and corresponds to GHDWG (residues 118–122) in Renilla.
Figure 3.
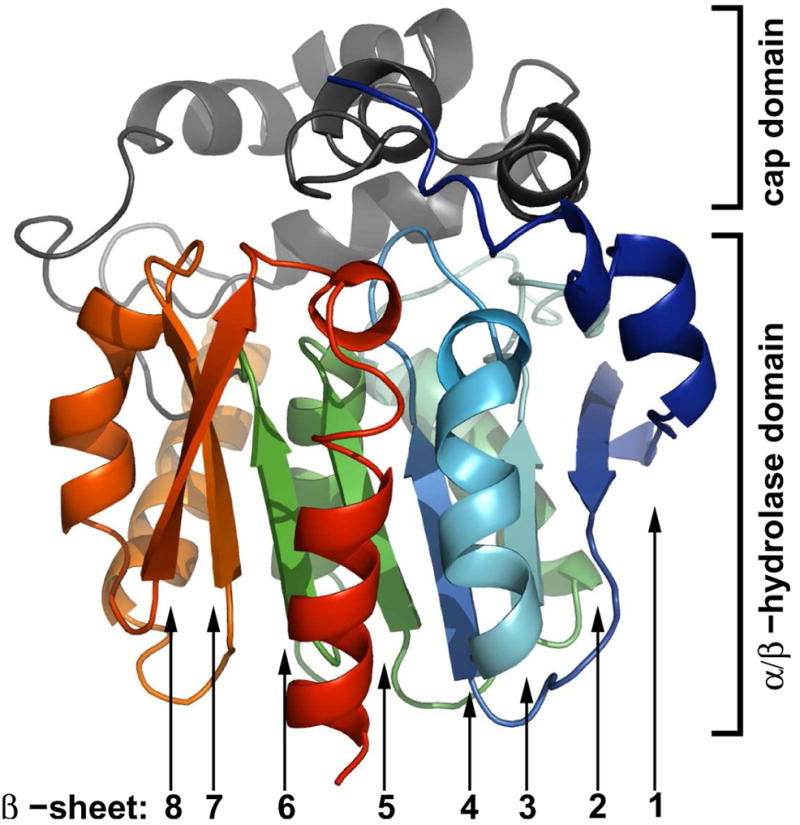
3a The topology of RLuc8’s α/β-hydrolase fold domain. α-helices are shown in blue, and β-sheets are shown in red. Numbering/lettering of the sheets/helices is done with respect to the standard for α/β-hydrolases [33], and the locations of the presumptive catalytic residues are marked. The cap domain is an excursion from the fold pattern comprised of residues 146–230 in the the luciferase.
3b The domains of RLuc8. Shown are the location of the cap domain (in gray) and α/β-hydrolase fold domain (blue to red) in the context of the crystal structure.
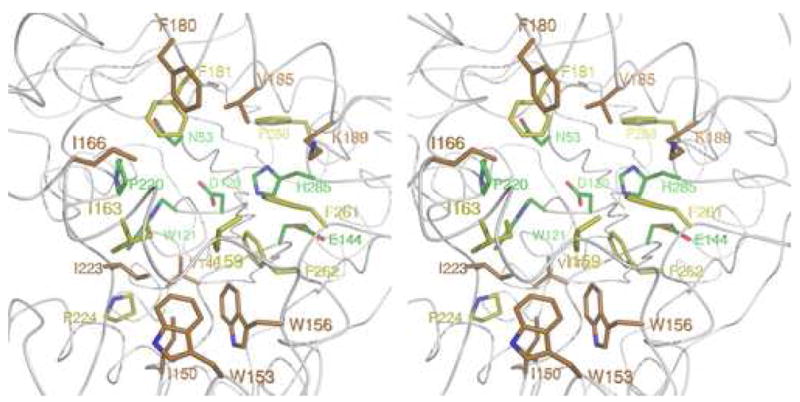
3c A close-up stereo cartoon representation of the active site of the RLuc8:diammonium structure. The presumptive active site residues are color coded with respect to the average degree of enzymatic perturbation mutagenesis at the site yields, based on previously published data [22,23]. Mutations at green, yellow, and orange colored residues were associated with <1%, 1–10%, or 10–100% of full enzymatic activity, respectively.
A feature observable in the RLuc8 structures (Figure 1a) that was not apparent in previous homology models is the wrapping of the N-terminus around the protein toward the front of the presumptive enzymatic pocket. There was also occasional variability in the placement of the initial ~10–15 residues (e. g. monomer 1 in Figure 1b), indicating that this region of the protein may contain a high degree of conformational flexibility. Variants of RLuc8 with the N-terminal clipped up to position I15 are relatively well tolerated and retain >25% of activity (data not shown, see [24]), demonstrating that this N-terminal region is not required for enzymatic activity of the protein. It has been a general observation in our laboratory that fusion proteins created by attachment to the N-terminus of RLuc have a greater propensity towards low luciferase activity than fusions made by attachment to the C-terminus of RLuc. Based on the structural data and the non-essentialness of the N-terminal region from an enzymatic standpoint, it can be hypothesized that this drop in activity for N-terminal fusions is due to steric hindrance of the RLuc active site.
In the RLuc8:diammonium structure two imidazole molecules, apparently from the mother liquor, were located in the presumptive catalytic pocket of the molecule. Previous reports [35] have reported enhanced enzymatic activity of RLuc in the presence of imidazole, with a maximal activity enhancement of 2-fold at ~4 mM. While the reason for this potentiation remains unclear, a plausible explanation is that imidazole maintains the enzymatic pocket in a conformation appropriate for binding coelenterazine. Interestingly, the mother liquor for the RLuc8:KSCN condition did not include imidazole, although density corresponding to a single molecule of imidazole was present in the diffraction data from this condition. This indicates that the imidazole molecule is retained within the protein during the nickel affinity purification, and is bound tightly enough to remain attached through two additional steps of chromatography.
The main conformation changes in the coelenteramide-bound structure from the RLuc8:PEG/isopropanol condition compared to the previous diammonium phosphate condition, were a slight outward shift of the residues F261/F262/S263 and a larger outward movement of residues from W153 to A163. Residues 153–163 are within the cap domain (Figure 3) of the enzyme, a domain that has been suggested to be flexible for the purposes of substrate binding in the haloalkane dehalogenases [36]. It can be expected that portions of the cap domain in Renilla luciferase, specifically residues 153–163, are similarly flexible for this same purpose. The finding of flexibility is further supported by the high B-factors found for these residues, and the outward movement of this portion of the enzyme may indicate conformational changes in response to binding of the coelenteramide.
Several lines of evidence indicate that the observed location for coelenteramide in the RLuc8:PEG/isopropanol structure is not the location of the substrate during the enzymatic reaction nor the location of the product during emission of the bioluminescence photon. First, if the coelenteramide location shown in Figure 1c was the catalytic location, it would seem to indicate that two monomers of RLuc are involved in the enzymatic reaction. The reaction rate of RLuc, however, is first order with respect to enzyme concentration (Supplemental Figure 2) indicating that only one protein monomer is involved in the reaction. Second, a variant with truncation of the last 5 amino acids of the protein (including the residue N309) retains 40% of the enzymatic activity (data not shown, see [24]). Third, the K25A/E277A mutations resulted in only a 40% drop in activity (Supplemental Table 1). One might expect a much larger drop in activity if E277 was directly involved in the enzymatic activity. Finally, many of the residues in the putative active pocket identified as being important for activity (e. g. N53, D120, I223 [22,23]) would be rather distant (6–8 Å ) from the substrate/product if the observed coelenteramide location was correct.
It has been previously noted that the fluorescent emission spectrum of RLuc mixed with coelenteramide does not reconstitute the recorded bioluminescence emission spectrum [5]. Coelenteramide, however, is known to strongly inhibit the enzymatic reaction with a Ki ~20 nM [37], so it must be able to bind to RLuc tightly. The explanation for this phenomenon has been that the chemical environment coelenteramide experiences changes immediately following emission of the bioluminescence photon [35]. This in turn leads us to the hypothesis that the coelenteramide location changes immediately after the enzymatic reaction and emission of the bioluminescence photon, with the coelenteramide sliding partially out of the active pocket due to a conformational change in the luciferase’s cap domain. In this hypothesis, the location of coelenteramide in the crystal structure presented here represents this “secondary” binding position and not the position of product/substrate during the enzymatic reaction.
Previously reported random and semi-rational mutation experiments on RLuc have been able to alter the enzyme’s substrate specificity [22] as well as shift its bioluminescence emission spectra [23]. While the coelenteramide bound structure of RLuc8 cannot fully explain these alterations, the structure does highlight many of the residue locations previously found to be most important in altering its emission spectrum (e. g. D162, F181, F261, F262) and should serve as a initial starting point for further rational alteration of the enzyme.
These previous reports have also yielded extensive data as to the enzymatic effects of mutagenesis on presumptive active site residues. This data, displayed diagrammatically in Figure 3c, shows that the residue locations where mutagenesis most effects enzymatic activity (N53, D120, W121, E144, P220, H285) are clustered toward the back of the active pocket. These 6 critical residues include the aforementioned catalytic triad, and are likely involved in coordinating the attack of the coelenterazine molecule by molecular oxygen during catalysis or alternatively may form an adduct with the coelenterazine. Around this core of critical resides, is a surrounding ring of less critical hydrophobic and aromatic residues (predominantly isoleucines, valines, phenylalanines, and trytophans). This ring is presumptively involved in assuring specificity when binding the hydrophobic coelenterazine molecule and orientating it with respect to the catalytic residues.
Further studies will be needed to elucidate the exact enzymatic mechanism of Renilla luciferase and why its catalyzed reaction differs from that of the haloalkane dehalogenases despite their structural similarity. A number of mechanism-based coelenterazine analog inhibitors have been previously synthesized [38] and may prove useful for both future crystallography work and for the study of the luciferase’s enzymatic kinetics. Additionally, work is ongoing using anoxic conditions in an attempt to crystallize the luciferase with its substrate.
Materials and Methods
Constructs
The plasmids pBAD-pelB-RLuc8 and pBAD-RLuc8, used for periplasmic and cytoplasmic expression respectively, have previously been described [22] (rluc8 GenBank Identifier 127951035). The proteins expressed from these plasmids contain a non-cleavable C-terminal 6xHis tag, with the only difference between the two being the mature protein from the periplasmic construct lacks an N-terminal methionine. An additional periplasmic expression plasmid, pBAD-pelB-6xHis-thr-S3RLuc8, was created containing an N-terminal thrombin cleavable 6xHis tag. The final product of this plasmid is referred to as S3RLuc8, as after thrombin digestion the resulting protein consists of an N-terminal glycine followed by the RLuc8 sequence beginning at residue S3. The cytoplasmic expression plasmid pBAD-RLuc8 was used as the basis for the various surface mutation constructs, including pBAD-RLuc8/K25A/E277A.
The gene for RrGFP (GenBank Identifier 14161475) was obtained from the plasmid pUC18-RrGFP (gift of Dr. Bruce Bryan, NanoLight Technology) and used to create the cytoplasmic expression plasmid pBAD-RrGFP containing RrGFP with a non-cleavable C-terminal 6xHis tag.
Expression and Purification
Expression and initial nickel affinity purification from the pBAD-pelB-RLuc8 and pBAD-RLuc8 plasmids were done as previously described [22,24]. For the plasmid pBAD-pelB-6xHis-thr-S3RLuc, expression and nickel affinity purification were similar, with the alterations that incubation of the culture following induction was done at 30°C for 6 h, and thrombin digestion was done immediately following nickel affinity purification by incubating with 1 μg calf α-thrombin per mg protein overnight at 4°C.
Purification continued with anion exchange and then gel filtration chromatography, both done at 4°C. For anion exchange chromatography, the protein (at this point in 300 mM NaCl containing buffer from the nickel affinity chromatography) was diluted with anion exchange start buffer (10 mM NaCl, 10 mM Tris pH 8) to a NaCl concentration of <60 mM. The diluted protein was bound to an anion exchange column (Source 15Q, GE Healthcare, Piscat-away, NJ) and eluted with a gradient of NaCl. Elution occurred at ~100 mM NaCl. Gel filtration chromatography was performed with a 320 ml volume Sephacryl S-100 column (GE Healthcare) and a running buffer of 10 mM NaCl, 10 mM HEPES, pH 7.4. Purified protein (in 10 mM NaCl, 10 mM HEPES, pH 7.4) was concentrated as necessary using 10 kDa cut-off Amicon Ultra centrifugal concentrators (Millipore, Billerica, MA).
Cytoplasmic expression and purification of RrGFP from pBAD-RrGFP was done identically to the protocol described above for pBAD-RLuc8, with the exception that the culture was grown at 24°C and the time after induction was increased to 24 h.
Characterization
Luciferase activity was measured using coelenterazine (Prolume, Pinetop AZ) and a Turner 20/20n luminometer (Turner Designs, Sunnyvale CA) as previously described [22].
Protein size and monodispersity were confirmed using a Superdex 200 analytical grade gel-filtration column (GE Healthcare) followed by in-line multi-angle light scattering (MALS) and refractive index detectors (DAWN EOS and Optilab DSP, Wyatt Technologies, Santa Barbara, CA). A dn/dc value of 0.185 ml/g was assumed in all calculations, and all processing was performed using the ASTRA software package (Wyatt Technologies).
Appropriate molecular weights were confirmed using a Matrix Assisted Laser Desorption/Ionization Time of Flight (MALDI-TOF) mass spectrometry (Bruker Daltonics, Billerica MA). All samples were spotted using a sinapinic acid matrix (Ciphergen Biosystems, Fremont CA) and analyzed in positive ion mode.
Crystallization
Crystallography trials were done in either hanging-drop or sitting-drop formats using the Hampton Screens (Hampton Research, Aliso Viejo, CA) or the Wizard Screens (Emerald BioSystems, Bainbridge Island, WA). For hanging-drop screening, drop sizes were generally 3 μl and consisted of 50% mother liquor and 50% of the protein solution. Sitting-drop setups were utilized for 96-well plate high-throughput screening, with 0.5 μl drops consisting of 50% mother liquor and 50% protein. Cryoprotection was done by either passing the crystal through a saturated solution of malonate [39] or a solution of mother liquor containing 35% MPD (2-methyl-2,4-pentanediol).
X-Ray Diffraction, Structural Determination, and Structural Analysis
As RLuc8 is 64% similar (44% identical) to the haloalkane dehalogenase LinB from Sphingomonas paucimobilis, a homology model of the luciferase was created using SWISS-MODEL [40] and crystal structures of LinB (PDB IDs 1IZ8, 1K63, 1K6E, 1IZ7, and 1MJ5) [41,42]. The loop regions of the homology model were removed, and the resulting data was used to bootstrap the phasing process via molecular replacement. Matthews coefficient calculations [43] suggested the presence of a monomer in the P61 asymmetric unit of the RLuc8:diammonium crystal that was located during molecular replacement with Phaser [44].
For RrGFP a homology model was created with SWISS-MODEL using the crystal structures of similar fluorescent proteins from the corals Montipora ef-florescens, Favia favus, and a Discosoma species (PDB IDs 1MOV, 1MOU, 1XSS, and 1GGX). This model was used similarly to the RLuc8 case to bootstrap the phasing process. Based on the expected molecular weight of RrGFP and the volume of the crystal cell, Matthews calculations suggested 4 protomers in the asymmetric unit [43]. All four were found during the molecular replacement search using Phaser [44].
Following initial phasing of RLuc8 and RrGFP, simulated annealing refinement against a maximum likelihood target function was carried out as implemented in the Crystallography and NMR System, version 1.1 [45]. Loop regions were then rebuilt using ARP/wARP [46,47], followed by additional simulated annealing refinement. Further rounds of refinement included the addition of water molecules and discrete side-chain disorder using Coot [48], and conjugate gradient refinement using a maximum likelihood target function as implemented in Refmac [49]. The final round of refinement in Refmac treated each monomer as an independent TLS (translation/libration/screw) group, which led to a significant reduction (2–3%) of R and Rfree in all cases. For RrGFP, 4-fold noncrystallographic symmetry restraints were used given the presence of 4 protomers in the asymmetric unit.
Once the finalized phase set for RLuc8 was obtained, other RLuc8 structures (such as the thiomaltoside structure) were determined using molecular replacement from this model, with refinement carried out as above.
To appropriately model the fluorophore in RrGFP, idealized coordinates for p-hydroxybenzylidene-imidazolidone were derived from HIC-Up database entry CRO [50,51]. Coelenteramide was modeled based on idealized coordinates generated using ChemSketch and CIF generation using Sketcher [52].
Accessible surface area calculations were made using the Protein-Protein Interaction Server [30,53], which utilizes an implementation of the algorithm of Lee et al. to calculate accessible surface area [54] and the program HBPLUS to calculate hydrogen bonds [55]. Graphics were created using POVScript+ [56]. Structural alignments with root mean square deviation calculations were made using the combinatorial extension method [57].
The structures and data reported here have been deposited in the RCSB Protein Data Bank, the corresponding identifiers are given in Table 2.
Supplementary Material
Acknowledgments
The authors would like to thank Dr. Axel T. Brunger for his critical reading and comments on the manuscript along with use of his crystallography equipment. This work was supported in part by a Stanford Bio-X Graduate Fellowship (AML), NCI CA114747 ICMIC P50 (SSG), and NCI R01 CA082214 (SSG).
Footnotes
Publisher's Disclaimer: This is a PDF file of an unedited manuscript that has been accepted for publication. As a service to our customers we are providing this early version of the manuscript. The manuscript will undergo copyediting, typesetting, and review of the resulting proof before it is published in its final citable form. Please note that during the production process errors may be discovered which could affect the content, and all legal disclaimers that apply to the journal pertain.
References
- 1.Contag CH, Spilman SD, Contag PR, Oshiro M, Eames B, Dennery P, Stevenson DK, Benaron DA. Visualizing gene expression in living mammals using a bioluminescent reporter. Photochem Photobiol. 1997;66:523–531. doi: 10.1111/j.1751-1097.1997.tb03184.x. [DOI] [PubMed] [Google Scholar]
- 2.Viviani VR. The origin, diversity, and structure function relationships of insect luciferases. Cell Mol Life Sci. 2002;59:1833–1850. doi: 10.1007/PL00012509. [DOI] [PMC free article] [PubMed] [Google Scholar]
- 3.Nakatsu T, Ichiyama S, Hiratake J, Saldanha A, Kobashi N, Sakata KKH. Structural basis for the spectral difference in luciferase bioluminescence. Nature. 2006;440:372–376. doi: 10.1038/nature04542. [DOI] [PubMed] [Google Scholar]
- 4.Markova SV, Golz S, Frank LA, Kalthof B, Vysotski ES. Cloning and expression of cDNA for a luciferase from the marine copepod Metridia longa. J Biol Chem. 2004;279:3212–3217. doi: 10.1074/jbc.M309639200. [DOI] [PubMed] [Google Scholar]
- 5.Matthews JC, Hori K, Cormier MJ. Purification and properties of Renilla reniformis luciferase. Biochemistry. 1977;16:85–91. doi: 10.1021/bi00620a014. [DOI] [PubMed] [Google Scholar]
- 6.Anderson JM, Cormier MJ. lumisomes, the cellular site of bioluminescence in coelenterates. J Biol Chem. 1973;248:2937–2943. [PubMed] [Google Scholar]
- 7.Spurlock BO, Cormier MJ. A fine structure of the anthocodium in Renilla mülleri. J Cell Biol. 1975;64:15–28. doi: 10.1083/jcb.64.1.15. [DOI] [PMC free article] [PubMed] [Google Scholar]
- 8.Ward WW, Cormier MJ. An energy transfer protein in coelenterate bioluminescence. characterization of the Renilla green-fluorescent protein. J Biol Chem. 1979;254:781–788. [PubMed] [Google Scholar]
- 9.Inouye S. Expression, purification and characterization of calcium-triggered luciferin-binding protein of Renilla reniformis. Protein Expr Purif. 2007;52:66–73. doi: 10.1016/j.pep.2006.07.028. [DOI] [PubMed] [Google Scholar]
- 10.Stepanyuk G, Liu ZJ, Markova SV, Frank LA, Vysotski ES, Lee J, Rose JP, Wang BC. Crystal structure of coelenterazine-binding protein from Renilla muelleri. doi: 10.1039/b716535h. to be published PDB ID 2HPS. [DOI] [PubMed] [Google Scholar]
- 11.Hart RC, Stempel KE, Boyer PD, Cormier MJ. Mechanism of the enzyme-catalyzed bioluminescent oxidation of coelenterate-type luciferin. Biochem Biophys Res Commun. 1978;81:980–986. doi: 10.1016/0006-291x(78)91447-x. [DOI] [PubMed] [Google Scholar]
- 12.Ward WW, Cormier MJ. Energy transfer via protein-protein interaction in Renilla bioluminescence. Photochem Photobiol. 1978;27:389–396. [Google Scholar]
- 13.Lorenz WW, McCann RO, Longiaru M, Cormier MJ. Isolation and expression of a cDNA encoding Renilla reniformis luciferase. Proc Natl Acad Sci. 1991;88:4438–4442. doi: 10.1073/pnas.88.10.4438. uniProtKB Entry: P27652. [DOI] [PMC free article] [PubMed] [Google Scholar]
- 14.Wang Y, Yu YA, Shabahang S, Wang G, Szalay AA. Renilla luciferase-Aequorea gfp (ruc-gfp) fusion protein, a novel dual reporter for real-time imaging of gene expression in cell cultures and in live animals. Mol Genet Genomics. 2002;268:160–168. doi: 10.1007/s00438-002-0751-9. [DOI] [PubMed] [Google Scholar]
- 15.Ray P, Wu AM, Gambhir SS. Optical bioluminescence and positron emission tomography imaging of a novel fusion reporter gene in tumor xenografts of living mice. Cancer Res. 2003;63:1160–1165. [PubMed] [Google Scholar]
- 16.Ray P, De A, Min JJ, Tsien RY, Gambhir SS. Imaging tri-fusion multimodality reporter gene expression in living subjects. Cancer Res. 2004;64:1323–1330. doi: 10.1158/0008-5472.can-03-1816. [DOI] [PMC free article] [PubMed] [Google Scholar]
- 17.Paulmurugan R, Gambhir SS. Monitoring protein-protein interactions using split synthetic Renilla luciferase protein-fragment-assisted complementation. Anal Chem. 2003;75:1584–1589. doi: 10.1021/ac020731c. [DOI] [PMC free article] [PubMed] [Google Scholar]
- 18.De A, Loening A, Gambhir S. An improved bioluminescence resonance energy transfer strategy for imaging intracellular events in single cells and living subjects. Cancer Res. 2007;67:7175–7183. doi: 10.1158/0008-5472.CAN-06-4623. [DOI] [PMC free article] [PubMed] [Google Scholar]
- 19.Hoshino H, Nakajima Y, Ohmiya Y. Luciferase-yfp fusion tag with enhanced emission for single-cell luminescence imaging. Nat Methods. 2007;4:637–639. doi: 10.1038/nmeth1069. [DOI] [PubMed] [Google Scholar]
- 20.Venisnik KM, Olafsen T, Loening AM, Iyer M, Gambhir SS, Wu AM. Bifunctional antibody-Renilla luciferase fusion protein for in vivo optical detection of tumors. Protein Eng Des Sel. 2006;19:453–460. doi: 10.1093/protein/gzl030. [DOI] [PubMed] [Google Scholar]
- 21.So MK, Xu C, Loening AM, Gambhir SS, Rao J. Self-illuminating quantum dot conjugates for in vivo imaging. Nat Biotechnol. 2006;24:339–343. doi: 10.1038/nbt1188. [DOI] [PubMed] [Google Scholar]
- 22.Loening AM, Fenn TD, Wu AM, Gambhir SS. Consensus guided mutagenesis of Renilla luciferase yields enhanced stability and light output. Protein Eng Des Sel. 2006;19:391–400. doi: 10.1093/protein/gzl023. [DOI] [PubMed] [Google Scholar]
- 23.Loening AM, Wu AM, Gambhir SS. Red-shifted Renilla luciferase variants for imaging in living subjects. Nat Methods. 2007;4:641–643. doi: 10.1038/nmeth1070. [DOI] [PubMed] [Google Scholar]
- 24.Loening AM. PhD thesis. Leland Stanford Junior University; 2006. Technologies for imaging with bioluminescently labeled probes. [Google Scholar]
- 25.Derewenda ZS. Rational protein crystallization by mutational surface engineering. Structure. 2004;12:529–535. doi: 10.1016/j.str.2004.03.008. [DOI] [PubMed] [Google Scholar]
- 26.Baud F, Karlin S. Measures of residue density in protein structures. Proc Natl Acad Sci. 1999;96:12494–12499. doi: 10.1073/pnas.96.22.12494. [DOI] [PMC free article] [PubMed] [Google Scholar]
- 27.Schomaker V, Trueblood KN. On the rigid-body motion of molecules in crystals. Acta Crystallogr B. 1968;24:63–76. [Google Scholar]
- 28.Ward WW, Cody CW, Hart RC, Cormier MJ. Spectrophotometric identity of the energy-transfer chromophores in Renilla and Aequorea green-fluorescent proteins. Photochem Photobiol. 1980;31:611–615. [Google Scholar]
- 29.Prasher DC, Eckenrode VK, Ward WW, PFG, Cormier MJ. Primary structure of the Aequorea victoria green-fluorescent protein. Gene. 1992;111:229–233. doi: 10.1016/0378-1119(92)90691-h. [DOI] [PubMed] [Google Scholar]
- 30.Jones S, Thornton JM. Principles of protein-protein interactions derived from structural studies. Proc Natl Acad Sci. 1996;93:13–20. doi: 10.1073/pnas.93.1.13. [DOI] [PMC free article] [PubMed] [Google Scholar]
- 31.Campbell RE, Tour O, Palmer AE, Steinbach PA, Baird GS, Zacharias DA, Tsien RY. A monomeric red fluorescent protein. Proc Natl Acad Sci. 2002;99:7877–7882. doi: 10.1073/pnas.082243699. [DOI] [PMC free article] [PubMed] [Google Scholar]
- 32.Holmquist M. Alpha/beta hydrolase fold enzymes: structure, functions and mechanisms. Cur Protein Pept Sci. 2000;1:209–235. doi: 10.2174/1389203003381405. [DOI] [PubMed] [Google Scholar]
- 33.Ollis DL, Cheah E, Cygler M, Dijkstra B, Frolow F, Franken SM, Harel M, Remington SJ, Silman I, Schrag J, Sussman JL, Verschueren KH, Goldman A. The alpha/beta hydrolase fold. Protein Eng. 1992;5:197–211. doi: 10.1093/protein/5.3.197. [DOI] [PubMed] [Google Scholar]
- 34.Heikinheimo P, Goldman A, Jeffries C, Ollis DL. Of barn owls and bankers: a lush variety of alpha/beta hydrolases. Structure. 1999;7:R141–146. doi: 10.1016/s0969-2126(99)80079-3. [DOI] [PubMed] [Google Scholar]
- 35.Matthews JC. PhD thesis. University of Georgia; 1976. Purification and characteristics of Renilla reniformis luciferase. [Google Scholar]
- 36.Schanstra JP, Janssen DB. Kinetics of halide release of haloalkane dehalogenase: evidence for a slow conformational change. Biochemistry. 1996;35:5624–5632. doi: 10.1021/bi952904g. [DOI] [PubMed] [Google Scholar]
- 37.Matthews JC, Hori K, Cormier MJ. Substrate and substrate analogue binding properties of Renilla luciferase. Biochemistry. 1977;16:5217–5220. doi: 10.1021/bi00643a009. [DOI] [PubMed] [Google Scholar]
- 38.Nakamura H, Wu C, Kato M, Kimura M. Syntheses of the mechanism-based inhibitors of coelenterazine bioluminescence. 11th International Symposium on Bioluminescence and Chemiluminescence, International Society for Bioluminescence and Chemiluminescence; Monterey, CA. 2000. pp. 127–130. [Google Scholar]
- 39.Holyoak T, Fenn TD, Wilson MA, Moulin AG, Ringe D, Petsko GA. Malonate: a versatile cryoprotectant and stabilizing solution for salt-grown macromolecular crystals. Acta Crystallogr D Biol Crystallogr. 2003;59:2356–2358. doi: 10.1107/s0907444903021784. [DOI] [PubMed] [Google Scholar]
- 40.Schwede T, Kopp J, Guex N, Peitsch MC. SWISS-MODEL: an automated protein homology-modeling server. Nucl Acids Res. 2003;31:3381–3385. doi: 10.1093/nar/gkg520. [DOI] [PMC free article] [PubMed] [Google Scholar]
- 41.Streltsov VA, Prokop Z, Damborsky J, Nagata Y, Oakley A, Wilce MC. Haloalkane dehalogenase LinB from Sphingomonas paucimobilis UT26: X-ray crystallographic studies of dehalogenation of brominated substrates. Biochemistry. 2003;42:10104–10112. doi: 10.1021/bi027280a. [DOI] [PubMed] [Google Scholar]
- 42.Oakley AJ, Klvana M, Otyepka M, Nagata Y, Wilce MC, Damborsky J. Crystal structure of haloalkane dehalogenase LinB from Sphingomonas paucimobilis ut26 at 0.95 Å resolution: dynamics of catalytic residues. Biochemistry. 2004;43:870–878. doi: 10.1021/bi034748g. [DOI] [PubMed] [Google Scholar]
- 43.Matthews BW. Solvent content of protein crystals. J Mol Biol. 1968;33:491–497. doi: 10.1016/0022-2836(68)90205-2. [DOI] [PubMed] [Google Scholar]
- 44.McCoy AJ, Grosse-Kunstleve RW, Storoni LC, Read RJ. Likelihood-enhanced fast translation functions. Acta Crystallogr D Biol Crystallogr. 2005;61:458–464. doi: 10.1107/S0907444905001617. [DOI] [PubMed] [Google Scholar]
- 45.Brünger AT, Adams PD, Clore GM, DeLano WL, Gros P, Grosse-Kunstleve RW, Jiang JS, Kuszewski J, Nilges M, Pannu NS, Read RJ, Rice LM, Simonson T, Warren GL. Crystallography & NMR system: A new software suite for macromolecular structure determination. Acta Crystallogr D Biol Crystallogr. 1998;54:905–921. doi: 10.1107/s0907444998003254. [DOI] [PubMed] [Google Scholar]
- 46.Perrakis A, Morris R, Lamzin VS. Automated protein model building combined with iterative structure refinement. Nat Struct Biol. 1999;6:458–463. doi: 10.1038/8263. [DOI] [PubMed] [Google Scholar]
- 47.Perrakis A, Harkiolaki M, Wilson KS, Lamzin VS. ARP/wARP and molecular replacement. Acta Crystallogr D Biol Crystallogr. 2001;57:1445–1450. doi: 10.1107/s0907444901014007. [DOI] [PubMed] [Google Scholar]
- 48.Emsley P, Cowtan K. Coot: model-building tools for molecular graphics. Acta Crystallogr D Biol Crystallogr. 2004;60:2126–2132. doi: 10.1107/S0907444904019158. [DOI] [PubMed] [Google Scholar]
- 49.Murshudov GN, Vagin AA, Dodson EJ. Refinement of macromolecular structures by the maximum-likelihood method. Acta Crystallogr D Biol Crystallogr. 1997;53:240–255. doi: 10.1107/S0907444996012255. [DOI] [PubMed] [Google Scholar]
- 50.Kleywegt G. Hetero-compound information centre HIC-Up. on the World Wide Web at http://xray.bmc.uu.se/hicup.
- 51.Kleywegt GJ, Jones TA. Databases in protein crystallography. Acta Crystallogr D Biol Crystallogr. 1998;54:1119–1131. doi: 10.1107/s0907444998007100. [DOI] [PubMed] [Google Scholar]
- 52.Vagin AA, Steiner RA, Lebedev AA, Potterton L, McNicholas S, Long F, Murshudov GN. REFMAC5 dictionary: organization of prior chemical knowledge and guidelines for its use. Acta Crystallogr D Biol Crystallogr. 2004;60:2184–2195. doi: 10.1107/S0907444904023510. [DOI] [PubMed] [Google Scholar]
- 53.Jones S. Protein-protein interaction server. 2003 on the World Wide Web at http://www.biochem.ucl.ac.uk/bsm/PP/server.
- 54.Lee B, Richards FM. The interpretation of protein structures: Estimation of static accessibility. J Mol Biol. 1971;55:379–400. doi: 10.1016/0022-2836(71)90324-x. [DOI] [PubMed] [Google Scholar]
- 55.McDonald IK, Thornton JM. Satisfying hydrogen-bonding potential in proteins. J Mol Biol. 1994;238:777–793. doi: 10.1006/jmbi.1994.1334. [DOI] [PubMed] [Google Scholar]
- 56.Fenn TD, Ringe D, Petsko GA. POVScript+: a program for model and data visualization using persistence of vision ray-tracing. J Appl Cryst. 2003;36:944–947. [Google Scholar]
- 57.Shindyalov IN, Bourne PE. Protein structure alignment by incremental combinatorial extension (CE) of the optimal path. Protein Eng. 1998;11:739–747. doi: 10.1093/protein/11.9.739. [DOI] [PubMed] [Google Scholar]
- 58.Ormö M, Cubitt AB, Kallio K, Gross LA, Tsien RY, Remington SJ. Crystal structure of the Aequorea victoria green fluorescent protein. Science. 1996;273:1392–1395. doi: 10.1126/science.273.5280.1392. [DOI] [PubMed] [Google Scholar]
- 59.Brünger AT. Free R value: a novel statistical quantity for assessing the accuracy of crystal structures. Nature. 1992;355:472–475. doi: 10.1038/355472a0. [DOI] [PubMed] [Google Scholar]
Associated Data
This section collects any data citations, data availability statements, or supplementary materials included in this article.


