

Abstract
Computational molecular design is a useful tool in modern drug discovery. Virtual screening is an approach that docks and then scores individual members of compound libraries. In contrast to this forward approach, inverse approaches construct compounds from fragments, such that the computed affinity, or a combination of relevant properties, is optimized. We have recently developed a new inverse approach to drug design based on the dead-end elimination and A* algorithms employing a physical potential function. This approach has been applied to combinatorially constructed libraries of small-molecule ligands to design high-affinity HIV-1 protease inhibitors [M. D. Altman et al. J. Am. Chem. Soc. 130: 6099–6013, 2008]. Here we have evaluated the new method using the well studied W191G mutant of cytochrome c peroxidase. This mutant possesses a charged binding pocket and has been used to evaluate other design approaches. The results show that overall the new inverse approach does an excellent job of separating binders from non-binders. For a few individual cases, scoring inaccuracies led to false positives. The majority of these involve erroneous solvation energy estimation for charged amines, anilinium ions and phenols, which has been observed previously for a variety of scoring algorithms. Interestingly, although inverse approaches are generally expected to identify some but not all binders in a library, due to limited conformational searching, these results show excellent coverage of the known binders while still showing strong discrimination of the non-binders.
Keywords: inverse design, scoring function, protein-ligand interaction, cytochrome c peroxidase, dead-end elimination, drug design
Introduction
The computational analysis of protein-ligand complexes is important in a number of fields. Current methods allow binding sites to be located1 and natural substrates to be identified for a given protein.2,3 They also permit the rational design of inhibitors, and in the future will likely allow potential drugs to be screened for harmful side effects. Whilst these methods are extraordinarily useful, a number of difficulties need to be addressed that limit current approaches. The scoring functions used to evaluate and rank compounds are approximate and may be inapplicable to varied libraries of compounds.4 This can lead to predictions of both false positives and false negatives. False positives are a problem in all computational methods. However, whilst false negatives are not desirable, it could be argued that from a design perspective they are less problematic than false positives, where the aim is to predict a set greatly enriched in high-affinity compounds. Compound scoring is also inextricably linked to conformational sampling, and inadequate sampling can limit the effectiveness of these methods. Recent work from this laboratory has focused on the development of a method for molecular design of inhibitors using an inverse approach with physical potential functions.5 The approach considers a library of potential ligands created combinatorially from a set of scaffolds and side groups. Each chosen scaffold is first placed systematically in the binding site in many different acceptable conformations and orientations. All scaffolds contain a number of attachable positions where side groups can be substituted, generally at hydrogen atoms. Every attachable position is associated with a library of side groups, each member of which exists as a set of discrete rotameric conformations. This problem framing is analogous to that used for inverse protein design.6-15 We use a pairwise decomposable energy function with the dead-end elimination (DEE)8,16 and A*13 algorithms to prune poor scoring compounds and poses to produce an energetically ordered list of the best computed binders. This ranked list is then re-evaluated using more sophisticated energy functions, which need not be pairwise additive, yielding a set of compounds predicted to bind tightly. This method has been applied to the rational design of HIV-1 protease inhibitors, which have shown high affinity binding in experimental validation.5 Here we evaluate the method using a test system, which has been used with other design approaches, and look for problems and potential solutions.
Small engineered binding sites have proven very useful for the study of protein-ligand binding. In the 1990s, a number of such sites were engineered. A hydrophobic binding site was created in a stable mutant of T4 lysozyme, L99A.17,18 Ninety-one different compounds were tested for binding affinity, providing information on the relative specificity of the site. This data was then used in computational studies.19-21 Later work yielded a double mutant, L99A/M102Q, that was able to bind small polar ligands.20,22 A charged binding site was also created from the protein cytochrome c peroxidase (CCP) by a mutation near the active site, W191G.23 The resulting pocket is buried within the protein close to the heme group and was found to bind a variety of small, typically singly-charged ligands. The protein and the binding site can be seen in Figure 1. This CCP mutant has been used subsequently to examine binding specificity, both experimentally24 and computationally.25,26 This has proven useful in identifying problems in molecular docking, in particular with the scoring functions that are employed, but inverse design methods have, thus far, not been tested in this way. The CCP site is particularly attractive due to the availability of large amounts of data. There are forty-three known binders and thirty-five of these have been crystallized with the protein at high resolution. Here we report the application of our inverse design approach to the engineered W191G CCP site with a set of small-molecule scaffolds and side groups. The aim was to identify areas in which the algorithm performs well and to find deficiencies and potential remedies.
Figure 1.

The cytochrome c peroxidase mutant W191G from PDB ID 2ANZ. On the left is a ribbon diagram with alpha helices in red and beta sheets in green. The heme group, the ligand 2,6-diaminopyridine and the conserved active site water molecule (1000) are displayed as atom-colored sticks. The active site is highlighted in a black box. The active site is shown in more detail on the right. The ligand is displayed as atom colored ball and sticks and the water molecule plus residues H175, L177, M230 and D235 are displayed as atom colored sticks.
Materials and Methods
Parallel designs were carried out in unbound and bound structures of the CCP W191G site. The unbound structure was from PDB ID 1CMQ23 at 2.30 Å resolution. The ligand-bound structure in complex with pyridine-2,6-diamine was selected from PDB ID 2ANZ26 at 1.75 Å resolution. The relatively large ligand in the bound state yields a cavity that can accommodate ligands of varying sizes. The use of unbound and bound structures permits the evaluation of induced fit effects. However, we are more concerned with the results from the bound structure because the inverse design method would commonly be used with a ligand-bound structure.
Preparation of protein structures
The two protein structures were then prepared as follows. Coordinates for the protein, the heme, the iron, and all the water atoms were taken from the PDB. The ligand was removed from the bound state. The protein and water hydrogen-atom positions were built using the HBUILD facility of the CHARMM27 program package with the CHARMM22 energy function. All asparagine and glutamine residues were then checked manually for potential hydrogen bonding and analyzed by NQ-Flipper.28 For 1CMQ, residues Q20, N24, N208, N220, Q240, and Q292 were altered by swapping the coordinates of the nitrogen and oxygen atoms to improve the hydrogen bonding patterns. For 2ANZ, residues Q20, N24, N208, Q240, and Q292 were altered. Histidine residues were checked for orientations and protonation state in the same manner, which resulted in all being assigned as delta protonated in each case and none being flipped. The residues lysine, arginine, aspartate, glutamate, cysteine, and tyrosine were also analyzed in this manner to check their protonation state. There was no evidence of any unusual protonation states and thus all lysine and arginine residues were assigned as positively charged, all aspartate and glutamate residues were assigned as negatively charged, and all cysteine and tyrosine residues were assigned as neutral. In the ligand-bound structure 2ANZ, the active site water molecule 1000 was retained within the site, as it is tightly bound and is present in all known complexes. This water was also retained in previous studies.25,26 In the unbound structure the retained water is number 308. The heme group present in CCP contains a ferric iron atom but the CHARMM22 heme parameters correspond to a ferrous iron atom. Calculations were thus performed to determine the partial charges on the heme atoms in this case. Calculations were performed on the entire heme group from the structure 2ANZ along with the iron-coordinating water molecule (1415) and the iron-coordinating histidine residue His175 capped with an acetylated N-terminus and an N-methylamido C-terminus. Hydrogen atoms were initially built using Gaussview.29 The partial atomic charges on the water and the protein atoms were constrained to the standard CHARMM22 charges to prevent charge transfer and then calculations were performed with Jaguar.30,31 The restricted Hartree-Fock model and the 3-21G basis set was used for all the atoms except the iron atom, for which a 6-31G+ basis set was used to account for d-orbitals. The system was geometry optimized to refine the hydrogen-atom positions and charges for the heme group were calculated using a RESP fit.32,33 The hydrogen-atom positions were then rebuilt using HBUILD27, consistent with the changes to the conformations of asparagine and glutamine residues. After minimization of the hydrogen-atom positions, the resultant structures were then rotated into a new coordinate frame and the protein atoms were assigned PARSE charges34 for use with Delphi.35 Precomputations for a grid-based estimation of van der Waals and electrostatic interactions were carried out. The methodology for creating these grids is discussed in reference 5.
Scaffold and Side Group Preparation
The sets of scaffolds and side groups describing the chemical and conformational space of potential ligands was constructed from a set of known binders and non-binders published by the Shoichet laboratory based on work performed for this site.26 The data can be found at http://shoichetlab.compbio.ucsf.edu/ccp_binders_decoys.xls and the structures are included here as supplementary figures 1 and 2. Each molecule was stripped to a core plus a number of side groups, yielding the scaffold shown in Figure 2. There were thirty-five core pieces, and these were combined with the twelve side groups shown in Figure 3, to give a total of 5843 possible compounds. This scheme provided for the computational construction of every binder and non-binder from the original data. Due to the combinatorial nature of ligand construction, some molecules not in the original data set and not previously characterized were also modeled and studied here. Both the scaffolds and the side groups were initially created using Gaussview29 with a hydrogen placed at each attachment site. The molecules were then geometry optimized with Gaussian 0336 using the restricted Hartree-Fock model employing the 3-21G basis set. The resulting structures were then re-evaluated with a single-point Gaussian 03 energy calculation using the restricted Hartree-Fock model with the 6-31G* basis set. The partial atomic charges were then assigned using a RESP fit.32,33 Previous work has shown that this scheme performs well compared to performing both the minimization and single-point calculation with the 6-31G* basis set.37 Protonation states were assigned as in previous studies.26 A systematic set of conformations was created for each scaffold and for each side group by rotating each rotatable torsion angle in increments of 30°. Van der Waals radii were scaled by 0.75 and each conformation where the scaled radii of any two non-bonded atoms overlapped was discarded. For all of the work with small molecules, CHARMm22 torsional parameters, van der Waals parameters and van der Waals radii were used throughout.38 This yielded an ensemble of conformations without steric clashes for the molecular building blocks of the chemical library.
Figure 2.

The set of scaffolds used to describe potential ligands. The letter R represents the positions on the scaffold at which side groups can be attached. Scaffolds with no R group represent a single ligand.
Figure 3.

The set of side groups used to describe potential ligands. The R represents the position where each side group attaches to the scaffold.
Inverse Design Methodology
The general methodology for carrying out the design has been discussed previously5 and is displayed as a flowchart in Figure 4. Here we will briefly sketch the approach and stress differences from previous work. The first step was to define the active site. This was done by defining a box encompassing the entire site and placing spheres at each grid point in a grid within this box with a resolution of 0.25 Å. Any spheres overlapping with the protein were removed from the grid and thus the resultant shape followed the surface of the active site and limited where atoms could be placed within the design. This differs from previous work in which the active site was defined by the coordinates of substrates. The next stage involved creating van der Waals and electrostatic grids for grid-based energy calculations. The scoring function employed in the combinatorial search procedure contains three primary components, a van der Waals packing term, a screened electrostatic interaction term, and desolvation penalties for both the designed ligand and the receptor. Grids for van der Waals energies are computed by placing a particular parameterized CHARMM atom type at each grid-point and computing its van der Waals interaction energy with the rest of the receptor. This is repeated for every atom type. To derive the van der Waals binding energy for a given molecule, the energetic contribution of each atom is calculated by trilinearly interpolating energies from the surrounding eight points of the appropriate grid. The target shape, in which the design is performed, is fixed throughout the combinatorial search portion of the algorithm, and calculations of grid-based potentials for the evaluation of electrostatic interaction and desolvation are performed using the linearized Poisson—Boltzmann equation. As shown previously, the electrostatic component of the binding free energy given a fixed shape for the bound and unbound states, fixed charges on the receptor, and a set of basis points within the ligand can be written as the sum of the screened electrostatic interaction term and desolvation penalties for both the designed ligand and the receptor.39 The basis points within the ligand are set to a regular cubic lattice and the electrostatic binding energy of any molecule can be approximated by trilinearly projecting each partial atomic charge to the grid points. This approximation estimates the electrostatic binding free energy of the molecule within the target shape, rather than the correct molecular surface of the ligand derived from radius parameters. Keeping the target shape constant allows for precomputation at each grid-point and is the basis for the fast grid-based electrostatics and solvation approximation.
Figure 4.

Outline of the inverse design scheme displayed as a flowchart.
In addition to van der Waals and electrostatic solvation terms, additional components of the score during the combinatorial search include a bump check against the target shape, ensuring that any molecule outside it has an infinite energy, as well as functional group/scaffold and functional group/functional group bump checks to ensure that designed molecules are not self-intersecting. Bump checks were chosen over traditional molecular mechanics internal energies because it is unclear when designing a small molecule how much internal strain is paid upon synthesis rather than binding. In order to use existing implementations of combinatorial search algorithms such as DEE and A*, the scoring function must be pairwise decomposable in functional group conformation and identity. This means that the total energy of a given scaffold with added functional groups consists of a constant term, a sum over the self energy contributions of each functional group alone, and a sum over contributions for each pair of functional groups. The constant term includes the grid-based van der Waals and electrostatic binding energy of the blunt scaffold, as well as the constant receptor desolvation term. The self energy for each attached functional group in a discrete conformation is the grid-based van der Waals contribution for all atoms, and the self electrostatic binding energy of the functional group can be computed through grid projection. In addition to electrostatic interaction and self desolvation, the indirect desolvation between the functional group and the scaffold must also be added to the self energy. Any functional group geometry that fails a bump check with the scaffold or with the shape is removed from further consideration in the combinatorial search. The contribution of a pair of functional groups to the binding free energy only contains the indirect solvation effects between them. If the two functional groups fail a bump check and clash, their pair energy contribution is infinite. The pairwise energy decomposition presented above is crafted such that the energy sums to same value as if the entire molecule, complete with scaffold and functional groups, was evaluated with the grid-based van der Waals and electrostatics/desolvation functions.
We used a van der Waals grid spacing of 0.125 Å and an electrostatic grid spacing of 0.5 Å. A finer grid size was used for the van der Waals component because the potential varies more rapidly in space and higher resolution was necessary to capture the steep repulsion when an atom of the ligand approaches the protein. On the other hand, the electrostatic potential is smoother and a lower resolution grid was sufficient. The van der Waals component is relatively inexpensive to compute at finer resolution in comparison to the Poisson--Boltzmann electrostatics. Each conformation of each scaffold was then subject to systematic placement in the active site with a translational enumeration of 0.25 Å and rotational enumeration such that the maximum arc length of atoms from the centroid swept out a distance of 1.0 Å between orientations. Scaffold poses were discarded if their calculated van der Waals binding energy was greater than zero or any two non-bonded atoms 0.75 scaled radii overlapped. The DEE/A* algorithm was then run on the set of low energy scaffold poses, which placed all side groups in all conformations and combinations on each scaffold pose. The torsion joining the scaffold to the side group was enumerated at 10°. The rigid binding free energy was computed for all the species created with the low resolution energy function detailed in Table I. This yielded an energy ranked list of molecules with the guarantee that no solutions were missed. For every scaffold pose, only the lowest-energy conformation of each particular designed molecule was retained. The ranked list was then pared down to a computationally feasible size by applying an energy cutoff. Compounds greater than 25.0 kcal/mol above the lowest energy result were removed. However, every copy of each binder and non-binder was retained to provide an estimate of binding affinity for each one. The resultant set of molecules was then re-analyzed using the medium resolution energy function detailed in Table I. At this stage another energy cutoff was applied and compounds greater than 15.0 kcal/mol above the lowest energy result were removed. All binders and non-binders were again retained. This final set of molecules was then evaluated using the two high-resolution energy functions, one of which includes a geometry optimization using CHARMM.27 The minimization is performed on the ligand in a rigid protein structure for 1,000,000 steps using the adopted basis Newton-Raphson method. Minimization did not radically alter any of the ligand conformations, with the RMSD between the initial and minimized structures varying between 0.24 Å and 1.16 Å. The exact details of these two energy functions can again be seen in Table I. These calculations provided a predicted binding free energy for each known binder and non-binder in both the unbound and the bound state as well as some molecules that have not previously been reported. These predictions were then compared with experiment to assess the enrichment power of the method.
Table I.
The four energy levels used in the design process and the terms from which they are comprised. For the proteins, van der Waals parameters, atomic radii and torsional parameters were taken from the CHARMM22 force field.27 For the small molecules, van der Waals parameters, atomic radii and torsional parameters were taken from the CHARMm22 force field.38 For all electrostatic calculations, the proteins were assigned PARSE charges34 and the heme group and all small molecules were assigned partial charges using a RESP fit.32,33 All energy minimization was performed using CHARMM.27 The surface area term is calculated as a constant value of 0.005 kcal/mol multiplied by the change in surface area upon binding in Å2. The internal deformation on binding comprises electrostatic, van der Waals, and torsional contributions.
| Calculation | van der Waals |
Continuum Electrostatic Interaction |
Continuum Electrostatic Ligand Desolvation |
Continuum Electrostatic Protein Desolvation |
Surface Area Term |
Internal Deformation On Binding |
|---|---|---|---|---|---|---|
|
Low Resolution |
Grid Based |
Grid Based | Grid Based | Constant | No | None |
|
Medium Resolution |
Explicit | Grid Based | Delphi Calculation |
Constant | No | None |
|
High Resolution |
Explicit | Delphi Calculation |
Delphi Calculation |
Delphi Calculation |
Yes | None |
|
Energy Minimization |
Explicit | Delphi Calculation |
Delphi Calculation |
Delphi Calculation |
Yes | Bound - Unbound |
Results and Discussion
The aim of this work is to assess the ability of the design methodology to accurately separate binders from non-binders. We used a guaranteed discrete search method to systematically examine poses and conformations of a selected set of scaffolds and combined these combinatorially with a selected set of side groups to compute a binding free energy for all the known binders and non-binders plus a new set of untested compounds. The analysis presented here evaluates the ability of the method to accurately predict the structure of the complexes and the ability to discriminate binders from non-binders. After analysis with the four scoring functions, the results of all the compounds were compiled and the predicted binding free energies are given for known binders in Table II and non-binders in Table III.
Table II.
Predicted binding free energies of the known binders from the design.a
| Compound ID |
High Resolution Score 2ANZ (kcal/mol) |
Energy Minimized Score 2ANZ (kcal/mol) |
Energy Minimized Score Apo (kcal/mol) |
RMSD (Å) | Similarity (Å) |
|---|---|---|---|---|---|
| B1 | −22.16 | −23.25 | −21.91 | 1.91 (1AEO) | 1.09 |
| B2 | −23.54 | −24.75 | −22.09 | 0.44 (1AEN) | 0.26 |
| B3 | −21.66 | −23.18 | −21.98 | 1.65 (2AQD) | 0.85 |
| B4 | −21.01 | −23.45 | −20.28 | 0.16 (2ANZ) | 0.09 |
| B5 | −17.61 | −25.08 | −25.62 | 0.95 (2EUP) | 0.47 |
| B6 | −22.41 | −24.19 | −21.42 | 0.19 (2EUN) | 0.15 |
| B7 | −18.73 | −23.52 | −23.17 | 0.61 (2EUT) | 0.34 |
| B8 | −18.99 | −21.90 | −20.60 | NA | NA |
| B9* | −14.24 | −22.86 | −22.99 | 1.10 (1AEK) | 0.57 |
| B10 | −24.02 | −26.71 | −26.42 | NA | NA |
| B11 | −21.87 | −22.89 | −20.01 | 0.76 (1AEG) | 0.38 |
| B12 | −21.09 | −22.72 | −21.57 | 3.08 (1AEH) | 2.00 |
| B13 | −23.48 | −25.60 | −22.44 | 0.29 (1CMP) | 0.19 |
| B14 | −23.80 | −27.63 | −25.20 | 0.52 (2AS2) | 0.29 |
| B15 | −13.03 | −19.03 | −18.00 | 1.56 (2AS1) | 0.97 |
| B16 | −19.82 | −20.99 | −19.54 | NA | NA |
| B17 | −20.95 | −22.54 | −23.20 | 0.44 (1AEQ) | 0.28 |
| B18 | −20.36 | −21.55 | −21.08 | 2.82 (2EUU) | 1.90 |
| B19 | −19.22 | −20.00 | −19.69 | 0.82 (1AEJ) | 0.41 |
| B20 | −17.43 | −24.66 | −26.61 | NA | NA |
| B21 | −18.43 | −20.27 | −20.44 | 0.60 (1AEU) | 0.32 |
| B22 | −24.27 | −26.57 | −23.67 | 1.22 (2EUR) | 0.64 |
| B23 | −22.72 | −24.44 | −21.55 | 0.57 (1AEE) | 0.32 |
| B24 | −17.10 | −17.39 | −15.26 | 1.48 (2AS3) | 0.66 |
| B25 | −23.97 | −25.55 | −22.79 | 1.78 (2EUQ) | 1.08 |
| B26 | −21.27 | −22.56 | −19.89 | NA | NA |
| B27 | −17.02 | −18.30 | −17.10 | 2.09 (2AS4) | 1.28 |
| B28 | −20.95 | −22.51 | −20.36 | NA | NA |
| B29 | −21.62 | −21.94 | −21.64 | NA | NA |
| B30 | −23.30 | −25.70 | −22.34 | 0.61 (2AS6) | 0.30 |
| B31 | −17.91 | −22.55 | −21.68 | 2.93 (1AC4) | 1.72 |
| B32 | −21.33 | −21.80 | −21.12 | 0.42 (1AET) | 0.21 |
| B33 | −15.58 | −21.96 | −22.82 | 0.63 (1AC8) | 0.36 |
| B34 | −20.71 | −21.50 | −20.15 | 0.18 (1AEB) | 0.19 |
| B35 | −22.88 | −23.90 | −21.72 | 0.52 (1AED) | 0.34 |
| B36 | −16.43 | −16.53 | −17.52 | 1.05 (1AES) | 0.44 |
| B37 | −24.18 | −26.82 | −25.50 | 0.38 (2EUS) | 0.25 |
| B38 | −20.45 | −23.06 | −21.52 | 0.22 (2EUO) | 0.15 |
| B39 | −9.92 | −16.98 | −18.35 | 1.38 (1AEM) | 0.80 |
| B40 | −17.41 | −21.01 | −18.90 | 0.56 (1RYC) | 0.52 |
| B41 | None | None | None | NA | NA |
| B42 | −21.55 | −22.62 | −19.99 | 1.91 (1AEF) | 0.88 |
| B43 | −18.91 | −19.06 | −16.64 | 2.49 (1AEV) | 1.45 |
The high resolution energy score and the energy minimized score are given in kcal/mol, along with the approximate RMSD in Å. Indoline (B9*) was studied using a translational interval of 0.1 Å. In the case of the RMSD, the PDB ID of the crystal structure is given below each result. The similarity metric is defined in the text. NA indicates that no crystal structure was available for comparison.
Table III.
Predicted binding free energies for known non-binders.a
| Compound ID |
High Resolution Score 2ANZ (kcal/mol) |
Energy Minimized Score 2ANZ (kcal/mol) |
Energy Minimized Score Apo (kcal/mol) |
|---|---|---|---|
| N1 | −8.34 | −12.45 | −11.80 |
| N2 | −16.10 | −18.19 | −17.08 |
| N3 | −22.76 | −26.24 | −23.57 |
| N4 | −11.49 | −13.15 | −11.27 |
| N5 | None | None | None |
| N6 | −11.30 | −14.91 | −14.45 |
| N7 | −11.95 | −12.03 | −10.34 |
| N8 | −6.87 | −13.99 | −16.01 |
| N9 | −15.58 | −16.50 | −14.03 |
| N10 | −14.24 | −15.92 | −14.43 |
| N11 | −11.04 | −11.48 | −11.05 |
| N12 | −10.77 | −11.12 | −14.89 |
| N13 | −4.36 | −9.66 | −12.17 |
| N14 | None | None | None |
| N15 | −9.98 | −9.70 | −9.70 |
| N16* | −18.64 | −19.59 | −19.16 |
| N17* | −14.67 | −15.05 | −14.90 |
The high resolution energy score and the energy minimized score are shown. dimethylamine (N16*) and methylamine (N17*) were studied using a translational interval of 0.5 Å.
Results Overview
The calculated relative binding free energies of all the predictions were between 0 and -30 kcal/mol. These are not absolute binding free energy values due to neglect of some factors, such as translational and rotational entropy. Forty-one of the forty-three known binders had a predicted binding free energy better than -15 kcal/mol using the energy minimization scheme in both the bound and unbound state structures. In both cases, the compound indoline (B9) was removed from consideration during the scaffold placement stage because its predicted binding free energy was greater than 0.0 kcal/mol. Repeating the design for indoline with a translational interval of 0.1 Å and rotational interval of 0.5 Å caused the scaffold to be retained and the minimization scheme predicted a binding free energy of -22.9 kcal/mol using the bound structure. For the compound quinoline (B41), no favorable placements were found in either case, even with a translational interval of 0.1 Å and a rotational interval of 0.25 Å. This molecule is the largest of the known binders and does not fit within either of the sites tested using tractable searches with this method. Unfortunately, the crystal structure with quinoline is unavailable for study. We made one deviation from the protocol described above. The small molecules dimethylamine (N16) and methylamine (N17) dominated the initial designs in the bound structure, with over 120,000 placements for dimethylamine and over 90,000 placements for methylamine. This compares with approximately 13,000 placements for the next most prevalent scaffold. This dominated the design without providing significant new information about the algorithm; these two compounds were thus analyzed separately with a translational interval of 0.5 Å.
As expected, the minimized energies were uniformly lower than the unminimized high resolution energies. The mean difference is 2.5 kcal/mol, but differs by as much as 8.6 kcal/mol in the case of indoline. This is a highly significant difference in this context and suggests that the minimization scheme may be important to properly rank potential binders. This is shown in Table IV and discussed later in this section. To illustrate the ability of the method to place molecules correctly, Figure 5 shows the predicted and experimental positions of 2,4-diaminopyridine (B6) bound within the site. The hydrogen bonding interactions are well predicted and the search and energy function clearly are able to identify good interactions. This undoubtedly contributes to the high scoring of the true binders.
Table IV.
Eight compounds whose score is improved significantly with minimization.a
| Compound ID |
Low Resolution Score (kcal/mol) |
Medium Resolution Score (kcal/mol) |
High Resolution Score (kcal/mol) |
Energy Minimized Score (kcal/mol) |
Low Resolution Score (0.25 Å Interval) |
|---|---|---|---|---|---|
| B3 | −0.08 | −3.21 | −4.24 | −21.86 | −20.39 |
| B9 | None | None | None | None | None |
| B15 | −2.02 | −3.31 | −4.30 | −19.03 | −11.92 |
| B20 | 1.81 | 1.49 | −0.11 | −23.06 | −17.78 |
| B33 | −6.03 | −7.45 | −9.10 | −21.94 | −12.76 |
| B39 | −1.61 | −2.70 | −3.84 | −17.01 | −8.35 |
| B40 | −4.62 | −5.20 | −6.49 | −20.99 | −15.71 |
| B41 | None | None | None | None | None |
These designs were carried out with a translational interval of 0.5 Å and a rotational interval of 1.0 Å. The binding energies are reported in kcal/mol at the four levels of the scoring hierarchy, along with the low-resolution energy when using a finer level of sampling. The computed affinity of the lowest energy pose is reported.
Figure 5.

The compound 2,4-diaminopyridine (B6) bound with the CCP mutant, showing the important binding site residues named in black and interactions in green. The crystallographic ligand is displayed as thin yellow sticks and the predicted ligand and active site water oxygen are displayed as atom colored sticks.
Enrichment for Binders
These results will now be analyzed to determine the ability of the algorithm to discriminate binders from non-binders. This property is known as enrichment and is a highly desirable ability for any design approach. Recent work suggests that a good way to examine enrichment is with a receiver operating characteristic (ROC) curve plot.40 A ROC curve is calculated by first ranking all the predicted compounds in order of increasing binding free energy. Compounds are then selected in order from this list and the fraction of true positives is plotted against the fraction of false positives. Figure 6 shows ROC curves for all four scoring functions for the design in the bound structure. We chose to look at the bound structure as this reflects how our inverse design method would usually be used. However, the results for the unbound structure are very similar. The minimized high resolution scoring is the best, but selects the non-binder 4-aminosorcinol (N3) very early, causing worse enrichment scores of intermediate compounds. 4-aminosorcinol is discussed later in this section. Despite this, the minimization scheme is best able to partition the data into binders and non-binders. Using a cutoff of -16.5 kcal/mol, the predicted set of binders contains forty-two binders and only three non-binders, which is very good enrichment and compares favorably with previous studies.22 However, also consistent with other studies was an inability to reproduce the experimentally determined binding affinities. The set of known binders has been experimentally tested24,26 and covers a narrow range of affinities (Kd0.006 mM to 4.1 mM). Unfortunately, currently used scoring functions yield predicted affinities that do not correlate well with experimental affinity41 and this is also the case here. It is interesting to note that the energies predicted using the unbound structure of the CCP mutant (1CMQ) yield very similar results to the bound structure (2ANZ). The R2 correlation between the predictions is 0.895. In this case there are no major conformational changes upon binding and relatively little induced fit in the great majority of complexes. However, it is important that the design methodology is not sensitive to slight differences in structure.
Figure 6.

A ROC curve plot of the false positive rate against the true positive rate for the selection of binders and non-binders. The low, medium and high resolution energy functions are colored red, yellow and green respectively. The minimization scheme is colored blue. The diagonal dotted black line represents a random selection.
We also assessed the importance of the SASA and desolvation terms by calculating ROC curves for the set of predicted binders and non-binders with lowest total energy excluding first the SASA term and then the desolvation term (data not shown). The enrichment without the SASA terms yields an identical ROC curve and the enrichment without the desolvation term slightly alters the order of some binders and non-binders but essentially has the same enrichment power. This is an interesting result as it suggests that these terms may be unnecessary in this particular case. However, it is expected that both SASA and desolvation terms would be significantly more important in analyzing molecules of differing sizes and charge distributions and thus must be included in this scoring function.
Electrostatics vs. van der Waals Interactions
Previous computational protein design work employing a similar set of energy functions found that the predicted electrostatic contribution to binding affinity correlated better with the experimental binding free energies than did the predicted total interaction.15 The van der Waals contribution was actually misleading, enriching for bulkier groups at the expense of smaller but more electrostatically optimal groups. We evaluated whether this finding also applies in this case by plotting the enrichment using only the predicted electrostatic binding free energy (data not shown). However, in this case the total binding free energy provides a slightly better enrichment, although the electrostatic contribution alone is nearly as good. This may reflect the difference between analyses at large, solvated protein interfaces and within small, buried binding sites. Figure 7 shows a plot of the total electrostatic portion of the binding free energy against the total non-electrostatic portion. It is interesting to note that the total electrostatics free energy shows excellent discrimination between binders and non-binders. This finding contributes to an ongoing discussion about the relative importance of terms within physical energy functions, such as the one employed here. The question is still open, and requires experimental evidence and computational analysis to inform the debate.
Figure 7.

The sum of the electrostatic interaction and desolvation terms plotted against the sum of all the non-electrostatic terms for every binder in green and non-binder in red. The line of constant total energy for the highest scoring compound (-27.63 kcal/mol) is shown as a constant black line and the line of constant energy for the cutoff (-16.50 kcal/mol) is shown as a black dotted line. Four non-binders are highlighted by black circles and named in red.
Accuracy of Structural Predictions
We also tested the ability of the method to correctly predict the pose of each ligand in the binding site, by comparison of the energy minimized structure with the actual crystal structure. We chose to use two metrics for this purpose. The first is the root mean squared deviation (RMSD) of the heavy atom positions for the predicted and crystal structure atom positions. In all but one case (2ANZ), the crystal complexes are not the same as the structures used to generate the results. We thus aligned each structure with the test structure using the McLachlan algorithm42 as implemented in the program ProFit (http://www.bioinf.org.uk/software/profit/). The alignment was performed on only protein backbone atoms, but the entire protein and all heteroatoms, including the crystallographic ligands, were rotated. The rotated ligands could then be used as a reference to compare with the predictions made by the design method. The RMSD of the protein backbone atoms had an average of 0.26 Å with a maximum of 0.87 Å. We also used another metric which is perhaps more applicable to the methodology. We termed this the distance matrix similarity. This value was calculated by taking the crystal structure and flagging all contacts between protein and ligand atoms that are below a defined distance (5.0 Å in this case). The same pair distances were then measured for the predicted protein-ligand complex. The similarity was defined as the RMSD of these inter-atomic distances for all contacts. This metric assesses the similarity of the contacts made by the ligands and helps to avoid the problem of comparing predictions in non-native structures. Both metrics are given in Table II. The metrics are highly correlated, with a regression coefficient of 0.964, but there are a few deviations. The most significant is the case of benzimidazole (B40), where the similarity metric is lower than expected. Analysis shows that this is due to a major loop repositioning that accommodates the large ligand. A similar rearrangement may also be important in allowing quinoline (B41) to bind. The alignment of predicted structures and crystal structures for all thirty-five compounds with available data are shown in Figure 8. The majority of compounds were predicted well, with RMSD values below 2.0 Å. The RMSD results from inverse design were very similar to those obtained by docking in a previous study.22 However, in that case each ligand was docked into its own crystal structure, which is likely to improve results.
Figure 8.

Predicted positions for the known binders (thick wire) and the actual crystal structure positions (thin wire). The molecule number and PDB ID are given in each case.
Sampling Resolution
To examine the effect of sampling, we repeated the design with an increased translational interval of 0.5 Å. This led to a reduced run time for the algorithm but the results highlighted a problem. Unsurprisingly, indoline and quinoline were again removed at the scaffold placement stage; additionally, six known binders were present within the initial results but with poor energies (compounds B3, B15, B20, B33, B39, and B40 in Table IV). The predicted binding free energies were also predicted to be poor at both medium and high resolution. However, using the energy minimization scheme, these compounds recover improved interactions and then eventually score very well. Within a normal design, compounds predicted to be so poor at medium resolution may be eliminated and not be analyzed at the high resolution of detail. These six compounds could thus have been lost. This is again due to the large size of these molecules and thus difficulty in placing them within the binding site. Finer sampling of conformational space, while computationally more expensive, produces better recovery of known binders and is expected to provide better coverage in new discovery projects.
Structural Orientation Recovery
Despite the successes using the inverse design method, there are a common set of problems that led to less accurate structural predictions. These include ring flips that interchange carbon atoms with heteroatoms and neglect of structural waters that are relevant for some ligands. Compounds B12, B15, B25, and B31 illustrate the recovery of a ring-flipped version of the correct structure (Figure 8). Examination of these cases shows that the correct orientation is always a viable structure but commonly has a computed affinity that is 2-3 kcal/mol worse than the incorrect orientation. These energy differences arise mainly from van der Waals interactions. Analysis of these results suggests that sampling is not the problem and that it is likely the van der Waals potential, particularly involving sulfur, is responsible.
Structural Water
The structures for compounds B18 and B43 were both not well predicted due to the presence of structural water molecules observed in their co-crystal structure that were absent in the designs. Figure 9 shows the crystal structure and predicted positions for 1H-imidazol-2-ylmethanol (B18). The actual pose has three good hydrogen bonds, one with a structural water molecule. Our calculations did not include this water and the molecule makes one good and two poor hydrogen bonds, one which is made by the water in the true structure. The effect of structural water molecules on predicted ligand binding geometry has been recognized as an important issue in molecular design, along with the role of induced fit and binding site relaxation. We have recently developed a method for placing structural water molecules during the design process.43 When this methodology was applied to this case, the algorithm was able to find the correct placement for the ligand and the water molecule, as shown on the right of Figure 9. The predicted binding free energy is -22.8 kcal/mol compared to -21.5 kcal/mol when using the normal design scheme. The RMSD of the ligand is 0.55 Å compared to 2.82 Å with the normal design scheme. This shows that structural discrepancies can result not from a problem with the sampling scheme or scoring function directly, but due to a neglect of structural waters. This is not an uncommon problem, but one that can be solved with inverse design methods as shown here, albeit at some computational cost.
Figure 9.

The compound 1H-imidazol-2-ylmethanol (B18) bound with the CCP mutant in the 2ANZ crystal structure with the lowest energy predicted position using the standard design scheme (left) and the lowest energy predicted position using the new structural water design (right). The important binding site residues and interactions are shown. The true water molecule is shown as a red dot in both figures, although it only exists in the crystal structure. The predicted water molecule is shown as a green dot in the right picture.
False Positives
Having analyzed the results for how well the algorithm is able to discriminate binders from non-binders, it is useful to look at the cases when it makes errors. In each case, the lowest energy minimized score is taken as the prediction of the binding free energy. There are four non-binders we will analyze in this way. The molecules methylamine and dimethylamine are both predicted to bind very well using this method, due to favorable van der Waals and electrostatic interactions. The issue here is likely an inadequate desolvation penalty. Both molecules are highly charged and may well form strong hydrogen bonds with the solvent. The continuum electrostatic treatment used to compute the ligand electrostatic desolvation penalty may not accurately treat this effect. The errors for methylamine and dimethylamine could also be attributable to these relatively small molecules not adequately filling the active site and thus leaving vacuous space when bound. One other issue that arises is with the molecule toluene (N2), which is a known non-binder but is grouped with the binders based on its computed affinity of -18.2 kcal/mol. In this case the difficulty may be an assumption of the model, that binding takes the ligand from a fully solvated state to a bound state. Toluene is only very sparingly soluble in water (approximately 0.53 g/L) and is unlikely to be dissolved and dispersed in water. The prediction that toluene has a better interaction with the protein than with the solvent may well be correct, but it is still not a true binder and may adopt an incompletely solvated unbound state. The most problematic compound is the non-binder 4-aminosorcinol (N3). In its protonated form it is predicted to have a binding free energy of -26.2 kcal/mol. This is only 3 kcal/mol worse than the compound with the lowest predicted energy. The experimental binding affinities in the original study were determined at pH 4.5 and pKacalculations with Jaguar suggest that the nitrogen atom will be protonated below pH 6.1. However, we performed calculations on the unprotonated version of 4-aminosorcinol as a test. The predicted binding free energy in this case is -17.5 kcal/mol, still placing it in the category of predicted binders. This compound also appeared to cause consternation when it was first tested and was predicted then as a binder.26 A likely explanation for the problem with 4-aminosorcinol is a poorly predicted desolvation penalty. It is known that atomic charges for amines calculated by commonly employed quantum mechanical (QM) methods44,45 can lead to estimations for hydration free energies that vary as much as 5.0 kcal/mol from experiment37 or by as much as 8.4 kcal/mol for charged amines and anilinium ions.46 One of the three incorrectly predicted non-binders in this test set contains a charged amine group and one contains an anilinium ion and two phenol groups. Predictions of hydration free energies are also poor for phenols37. Recently reparameterised force-fields such as OPLS-AA47 and GROMOS48,49 have proven more effective at dealing with solvation calculations for neutral amines. We thus made predictions of the electrostatic portion of the desolvation energy for ammonium (NH4+), methylammonium (MMA+), dimethylammonium (DMA+), trimethylammonium (TMA+), anilinium, and phenol using partial atomic charges from Gaussian,36 PARSE,34 and OPLS-AA.47 The calculations were performed using one solvated calculation and one vacuum calculation with a salt concentration of 0.145 M. The experimental desolvation energies were taken from a previous study.50 The desolvation cavity terms were calculated by multiplying the molecular surface area calculated using CHARMM by the empirical constant 0.005 kcal/mol/Å2.51 The results in Table V show that the Gaussian scheme used in this work (highlighted in italics) is not especially accurate at predicting the solvation energies for phenol or charged amines, and this is particularly true for anilinium. These problems are compounded for the molecule 4-aminosorcinol, which might be construed as consisting of two phenols and one anilinium and could thus be underpredicted by over 13 kcal/mol. The OPLS-AA charges perform better than the Gaussian charges but are still inaccurate for the anilinium ion. The PARSE charges do poorly at dielectric 4 but very well at dielectric 2, though they were parameterized at dielectric 2. The Gaussian scheme also performs better at dielectric 2. This result is initially promising but unfortunately does not solve the problem. When the calculations on 4-aminosorcinol were repeated using a dielectric value of 2, the results predict very similar binding free energies (-26.2 kcal/mol compared with -27.2 kcal/mol at dielectric 4) due to the balance between desolvation penalty and the electrostatic interaction.
Table V.
Calculations of the electrostatic solvation free energy for a variety of compounds.a
| Scheme | Gaussian (kcal/mol) |
PARSE (kcal/mol) |
OPLS-AA (kcal/mol) |
Experimental (kcal/mol) | |||
|---|---|---|---|---|---|---|---|
| Dielectric | 4 | 2 | 4 | 2 | 4 | 2 | |
| NH4+ | −83.26 | −84.04 | −82.82 | −83.28 | −83.43 | −82.90 | −82.71 |
| MMA+ | −72.07 | −73.04 | −73.11 | −74.53 | −74.07 | −72.81 | −74.96 |
| DMA+ | −64.99 | −66.16 | −65.68 | −67.15 | −66.69 | −65.36 | −68.16 |
| TMA+ | −59.95 | −61.17 | −59.86 | −60.99 | −60.84 | −59.75 | −61.36 |
| Anilinium | −62.95 | −66.53 | −67.57 | −71.82 | −75.68 | −70.40 | −70.32 |
| Phenol | −5.86 | −8.81 | −3.92 | −8.80 | −8.15 | −5.42 | −8.83 |
| NH4+ Error | 0.55 | 1.33 | 0.11 | 0.57 | 0.72 | 0.19 | |
| MMA+ Error | −2.89 | −1.92 | −1.85 | −0.43 | −0.89 | −2.15 | |
| DMA+ Error | −3.17 | −2.00 | −2.48 | −1.01 | −1.47 | −2.80 | |
| TMA+ Error | −1.41 | −0.19 | −1.50 | −0.37 | −0.52 | −1.62 | |
| Anilinium Error | −7.37 | −3.79 | −2.75 | 1.50 | 5.36 | 0.08 | |
| Phenol Error | −2.97 | −0.02 | −4.91 | −0.03 | −0.68 | −3.41 | |
| RMS Error | 3.74 | 2.00 | 2.69 | 0.81 | 2.34 | 2.11 | |
| Error A+2P | −13.32 | −3.84 | −12.56 | 1.45 | 3.99 | −6.75 | |
All values are given in kcal/mol. The original PARSE calculations were performed without salt, but these calculations include salt. The calculations agree slightly better with experiment without salt. The actual electrostatic portion of the solvation was calculated by subtracting the cavity term from the total experimental solvation energy. The RMS error is calculated for all six compounds. The error A+2P is a sum of one error for anilinium and two errors for phenol.
A number of difficulties clearly remain with the design methodology, as four false positives are predicted amongst the set of binders. The issue of solubility can be addressed relatively easily by estimating the water solubility of each predicted binder. There are many accurate techniques designed for this purpose.52 This issue of correctly predicting desolvation penalties for phenols, charges amines and anilinium ions is more problematic and cannot be easily solved with our current methodology. In future studies, it would be beneficial to flag such troublesome groups and fix the problem with a more empirical method. However, that is a non-physical solution and this study again highlights the need for more accurate modeling of these species, for improved scoring functions and greater enrichment in drug discovery.
New Predicted Binders
Despite problems with a few individual compounds, the majority of predictions are excellent. It is thus useful to look at the compounds designed for which experimental data is not present. Defining the cutoff for binding as -16.5 kcal/mol, there are 17 new compounds predicted (Table VI). Many of these predictions seem sensible, in that they exhibit similarity with known binders. Compounds K and N contain three and four nonmethyl rotatable bonds, which might decrease the affinity of these compounds. Cyclopentane (Q) is also predicted as a binder due to favorable van der Waals and hydrophobic interactions. However, like toluene, it may have solubility issues that diminish its binding in water. Compound P contains two phenol groups and based on what we have learned in this study, we might perform further analysis on this molecule before fully classifying it as a predicted binder. Compounds H, L, and M are all 2-thiolimidazole derivatives and are unlikely to be protonated at pH 4.5 and are thus likely to be non-binders, like their parent compound. This highlights the importance of pKa values and pH of binding assays. This is another problem that can be addressed relatively easily by analyzing the suggested binders using post-processing techniques to predict protonation states.52,53 However, care must be taken when making these predictions, as protonation states are known to change upon binding54 and this may markedly affect affinity. Despite these issues, the remaining eleven compounds contain no protonated amines, phenol groups, or anilinium groups, which have been problematic, and are excellent predictions for true binders. This analysis highlights some of the lessons we have learned in this study and how they can be used to eliminate false positives.
Table VI.
The seventeen compounds predicted to bind to the CCP W191G mutant that are not present in the original set.a
| ID | Compound | Energy Minimized Score 2ANZ (kcal/mol) |
ID | Compound | Energy Minimized Score 2ANZ (kcal/mol) |
|---|---|---|---|---|---|
| A |

|
-28.96 | J |

|
-23.71 |
| B |
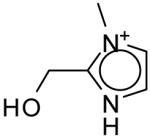
|
-26.20 | K |
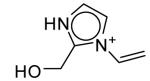
|
-23.17 |
| C |

|
-26.16 | L |

|
-22.51 |
| D |

|
-25.63 | M |

|
-21.47 |
| E |

|
-24.43 | N |
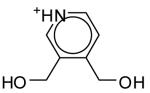
|
-20.91 |
| F |

|
-24.39 | O |

|
-19.48 |
| G |

|
-24.30 | P |

|
-18.34 |
| H |

|
-23.88 | Q |

|
-17.77 |
| I |
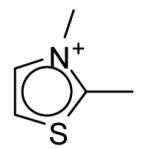
|
-23.78 |
Conclusion
We have recently developed a molecular design approach that employs the DEE and the A* algorithms to design potential inhibitors for drug discovery. The aim of this work was to investigate the performance of the algorithm by assessing its ability to score and rank a set of known binders and non-binders. The extensive experimental data available for this system allowed us to identify cases where the algorithm performed well and cases where it performed less well, with the aim of making further improvements. The study highlighted a number of issues with the process of separating binders from non-binders.
The first issue is with sampling. It is clear that to capture compounds that bind well, they must be placed favorably within the binding site. The number of true positives increased with increased sampling and to capture all the known binders required a translational interval of 0.25 Å. In cases such as dimethylamine and methylamine where this generated too many placements to feasibly search, new techniques will be required to prune the solutions found to a reasonable size, whilst retaining enough to ensure good coverage of the space.
The second issue involves subtleties with the scoring function used. The low, medium, and high resolution functions all do a good job of predicting binding proclivity, but minimization is often able to find significantly better poses in many cases. Our results show that a combination of a fine level of sampling and a hierarchical energy function can yield excellent results. For the work here, the minimization scheme led to further improvement. Using this, we were able to select a set of the top scoring compounds, which included forty-two of forty-three binders and only three non-binders. This is an excellent enrichment.
The third issue is with the scoring of charged amines, anilinium ions, and phenols. Previous studies have shown that it is difficult to correctly model the solvation of these molecules and to predict their affinity for this site. Most analyses conclude that the problem is due to incorrectly estimated partial charges and that this is a result of the failure of commonly used QM methods in this particular case. Calculations have shown that the errors in solvation can be miscalculated by up to 8.4 kcal/mol for charged amines. This is a large enough error to account for the misclassification of dimethylamine and 4-aminosorcinol as binders.
The study also highlights the importance of two other issues that have been identified by others previously. Firstly, it may be important to make an estimate of the solubility for any predictions made. A compound may have a good predicted binding energy and truly fit the steric and electrostatic requirements of the site but be too insoluble in water to actually qualify as a binder. In this case, toluene (N2) may be misclassified for this reason. Secondly, it is important to ensure that molecules are assigned the correct protonation states. The binding free energy of a neutral molecule and its charged state may be markedly different. This is shown here computationally by the difference between predicted binding energies for 4-aminosorcinol (-17.5 kcal/mol) and its protonated state (-26.2 kcal/mol). The problem is also highlighted by the prediction of protonated analogues of 2-thiolimidazole as binders. 2-thiolimidazole is not protonated and is a non-binder. However the design creates it by combining imidazole, which is protonated, with a thiol side chain.
The design method detailed in this paper also performs well when compared to other methods tested using this site. Direct comparison of enrichment is not possible due to differences in approach, but the enrichment is very good, as it was in the previous study26. Recovery of the crystal structure pose yields predictions which are very similar to previous studies, with an average RMSD of 1.09 Å compared with 1.04 Å25,26 and 1.06 Å.26 However, it should be noted that the approach used here uses a discrete rather than continuous search and is tailored for enrichment rather than structural recovery.
From the results of this study, it can be concluded that the approach used for searching conformational space and for compound scoring is generally very good and can provide excellent enrichment, despite problems with a few individual compounds. It is encouraging that inverse design methods can perform as well as forward design methods in enriching for true binders and recapitulating known binding modes.
Supplementary Material
Acknowledgements
We thank Brian Shoichet for making the experimental data freely available and Catherine Drennan for helpful discussions. The work was partially supported by the National Institutes of Health (GM065418 and GM066524).
Abbreviations
- DEE
dead-end elimination
- CCP
cytochrome c peroxidase
- RMSD
root mean square deviation
- QM
quantum mechanics
- ROC
receiver operating characteristic
References
- 1.Campbell SJ, Gold ND, Jackson RM, Westhead DR. Ligand binding: Functional site location, similarity and docking. Current Opinion in Structural Biology. 2003;13:389–395. doi: 10.1016/s0959-440x(03)00075-7. [DOI] [PubMed] [Google Scholar]
- 2.Macchiarulo A, Nobeli I, Thornton JM. Ligand selectivity and competition between enzymes in silico. Nat Biotechnol. 2004;22(8):1039–1045. doi: 10.1038/nbt999. [DOI] [PubMed] [Google Scholar]
- 3.Hermann JC, Marti-Arbona R, Fedorov AA, Fedorov E, Almo SC, Shoichet BK, Raushel FM. Structure-based activity prediction for an enzyme of unknown function. Nature. 2007;448(7155):775–779. doi: 10.1038/nature05981. [DOI] [PMC free article] [PubMed] [Google Scholar]
- 4.Warren GL, Andrews CW, Capelli AM, Clarke B, LaLonde J, Lambert MH, Lindvall M, Nevins N, Semus SF, Senger S, Tedesco G, Wall ID, Woolven JM, Peishoff CE, Head MS. A critical assessment of docking programs and scoring functions. J Med Chem. 2006;49(20):5912–5931. doi: 10.1021/jm050362n. [DOI] [PubMed] [Google Scholar]
- 5.Altman MD, Ali A, Reddy GS Kumar, Nalam MN, Anjum SG, Cao H, Chellappan S, Kairys V, Fernandes MX, Gilson MK, Schiffer CA, Rana TM, Tidor B. HIV-1 protease inhibitors from inverse design in the substrate envelope exhibit subnanomolar binding to drug-resistant variants. J Am Chem Soc. 2008;130(19):6099–6113. doi: 10.1021/ja076558p. [DOI] [PMC free article] [PubMed] [Google Scholar]
- 6.Drexler KE. Molecular engineering: An approach to the development of general capabilities for molecular manipulation. Proc Natl Acad Sci U S A. 1981;78(9):5275–5278. doi: 10.1073/pnas.78.9.5275. [DOI] [PMC free article] [PubMed] [Google Scholar]
- 7.Pabo C. Molecular technology. Designing proteins and peptides. Nature. 1983;301(5897):200. doi: 10.1038/301200a0. [DOI] [PubMed] [Google Scholar]
- 8.Desmet J, Demaeyer M, Hazes B, Lasters I. The dead-end elimination theorem and its use in protein side-chain positioning. Nature. 1992;356(6369):539–542. doi: 10.1038/356539a0. [DOI] [PubMed] [Google Scholar]
- 9.Ponder JW, Richards FM. Tertiary templates for proteins. Use of packing criteria in the enumeration of allowed sequences for different structural classes. J Mol Biol. 1987;193(4):775–791. doi: 10.1016/0022-2836(87)90358-5. [DOI] [PubMed] [Google Scholar]
- 10.Hellinga HW. Rational protein design: combining theory and experiment. Proc Natl Acad Sci U S A. 1997;94(19):10015–10017. doi: 10.1073/pnas.94.19.10015. [DOI] [PMC free article] [PubMed] [Google Scholar]
- 11.Dahiyat BI, Mayo SL. De novo protein design: fully automated sequence selection. Science. 1997;278(5335):82–87. doi: 10.1126/science.278.5335.82. [DOI] [PubMed] [Google Scholar]
- 12.Kuhlman B, Dantas G, Ireton GC, Varani G, Stoddard BL, Baker D. Design of a novel globular protein fold with atomic-level accuracy. Science. 2003;302(5649):1364–1368. doi: 10.1126/science.1089427. [DOI] [PubMed] [Google Scholar]
- 13.Leach AR, Lemon AP. Exploring the conformational space of protein side chains using dead-end elimination and the A* algorithm. Proteins-Structure Function and Genetics. 1998;33(2):227–239. doi: 10.1002/(sici)1097-0134(19981101)33:2<227::aid-prot7>3.0.co;2-f. [DOI] [PubMed] [Google Scholar]
- 14.Lippow SM, Tidor B. Progress in computational protein design. Curr Opin Biotechnol. 2007;18(4):305–311. doi: 10.1016/j.copbio.2007.04.009. [DOI] [PMC free article] [PubMed] [Google Scholar]
- 15.Lippow SM, Wittrup KD, Tidor B. Computational design of antibody-affinity improvement beyond in vivo maturation. Nat Biotechnol. 2007;25(10):1171–1176. doi: 10.1038/nbt1336. [DOI] [PMC free article] [PubMed] [Google Scholar]
- 16.Pierce NA, Spriet JA, Desmet J, Mayo SL. Conformational splitting: A more powerful criterion for dead-end elimination. J Comput Chem. 2000;21(11):999–1009. [Google Scholar]
- 17.Eriksson AE, Baase WA, Zhang XJ, Heinz DW, Blaber M, Baldwin EP, Matthews BW. Response of a protein structure to cavity-creating mutations and its relation to the hydrophobic effect. Science. 1992;255(5041):178–183. doi: 10.1126/science.1553543. [DOI] [PubMed] [Google Scholar]
- 18.Morton A, Baase WA, Matthews BW. Energetic origins of specificity of ligand-binding in an interior nonpolar cavity of T4 lysozyme. Biochemistry. 1995;34(27):8564–8575. doi: 10.1021/bi00027a006. [DOI] [PubMed] [Google Scholar]
- 19.Su AI, Lorber DM, Weston GS, Baase WA, Matthews BW, Shoichet BK. Docking molecules by families to increase the diversity of hits in database screens: computational strategy and experimental evaluation. Proteins-Structure Function and Genetics. 2001;42(2):279–293. doi: 10.1002/1097-0134(20010201)42:2<279::aid-prot150>3.0.co;2-u. [DOI] [PubMed] [Google Scholar]
- 20.Wei BQ, Weaver LH, Ferrari AM, Matthews BW, Shoichet BK. Testing a flexible-receptor docking algorithm in a model binding site. J Mol Biol. 2004;337(5):1161–1182. doi: 10.1016/j.jmb.2004.02.015. [DOI] [PubMed] [Google Scholar]
- 21.Deng YQ, Roux B. Calculation of standard binding free energies: aromatic molecules in the T4 lysozyme L99A mutant. J Chem Theory Comput. 2006;2(5):1255–1273. doi: 10.1021/ct060037v. [DOI] [PubMed] [Google Scholar]
- 22.Wei BQQ, Baase WA, Weaver LH, Matthews BW, Shoichet BK. A model binding site for testing scoring functions in molecular docking. J Mol Biol. 2002;322(2):339–355. doi: 10.1016/s0022-2836(02)00777-5. [DOI] [PubMed] [Google Scholar]
- 23.Fitzgerald MM, Churchill MJ, McRee DE, Goodin DB. Small-molecule binding to an artificially created cavity at the active-site of cytochrome-c peroxidase. Biochemistry. 1994;33(13):3807–3818. [PubMed] [Google Scholar]
- 24.Musah RA, Jensen GM, Bunte SW, Rosenfeld RJ, Goodin DB. Artificial protein cavities as specific ligand-binding templates: characterization of an engineered heterocyclic cation-binding site that preserves the evolved specificity of the parent protein. J Mol Biol. 2002;315(4):845–857. doi: 10.1006/jmbi.2001.5287. [DOI] [PubMed] [Google Scholar]
- 25.Rosenfeld RJ, Goodsell DS, Musah RA, Morris GM, Goodin DB, Olson AJ. Automated docking of ligands to an artificial active site: augmenting crystallographic analysis with computer modeling. J Comput-Aided Mol Des. 2003;17(8):525–536. doi: 10.1023/b:jcam.0000004604.87558.02. [DOI] [PubMed] [Google Scholar]
- 26.Brenk R, Vetter SW, Boyce SE, Goodin DB, Shoichet BK. Probing molecular docking in a charged model binding site. J Mol Biol. 2006;357(5):1449–1470. doi: 10.1016/j.jmb.2006.01.034. [DOI] [PMC free article] [PubMed] [Google Scholar]
- 27.Brooks BR, Bruccoleri RE, Olafson BD, States DJ, Swaminathan S, Karplus M. CHARMM: A program for macromolecular energy, minimization, and dynamics calculations. J Comput Chem. 1983;4(2):187–217. [Google Scholar]
- 28.Weichenberger CX, Sippl MJ. NQ-Flipper: validation and correction of asparagine/glutamine amide rotamers in protein crystal structures. Bioinformatics. 2006;22(11):1397–1398. doi: 10.1093/bioinformatics/btl128. [DOI] [PubMed] [Google Scholar]
- 29.Frisch AEDR, Keith TA, Nielsen AB, Holder AJ. GaussView, Rev. 3.9. Pittsburg Gaussian Inc.; 2003. [Google Scholar]
- 30.Friesner RA. Solution of the Hartree-Fock Equations for Polyatomic-Molecules by a Pseudospectral Method. J Chem Phys. 1987;86(6):3522–3531. [Google Scholar]
- 31.Schrödinger Inc. Jaguar 4.1. Portland, OR: 1991-2000. [Google Scholar]
- 32.Bayly CI, Cieplak P, Cornell WD, Kollman PA. A well-behaved electrostatic potential based method using charge restraints for deriving atomic charges - the RESP model. J Phys Chem. 1993;97(40):10269–10280. [Google Scholar]
- 33.Cornell WD, Cieplak P, Bayly CI, Kollman PA. Application of RESP charges to calculate conformational energies, hydrogen-bond energies, and free-energies of solvation. J Am Chem Soc. 1993;115(21):9620–9631. [Google Scholar]
- 34.Sitkoff D, Sharp KA, Honig B. Accurate calculation of hydration free-energies using macroscopic solvent models. J Phys Chem. 1994;98(7):1978–1988. [Google Scholar]
- 35.Gilson MK, Honig B. Calculation of the total electrostatic energy of a macromolecular system - solvation energies, binding-energies, and conformational-analysis. Proteins-Structure Function and Genetics. 1988;4(1):7–18. doi: 10.1002/prot.340040104. [DOI] [PubMed] [Google Scholar]
- 36.Frisch MJT,GW, Schlegel HB, Scuseria GE, Robb MA, Cheeseman JR, Montgomery JA, Jr., Vreven T, Kudin KN, Burant JC, Millam JM, Iyengar SS, Tomasi J, Barone V, Mennucci B, Cossi M, Scalmani G, Rega N, Petersson GA, Nakatsuji H, Hada M, Ehara M, Toyota K, Fukuda R, Hasegawa J, Ishida M, Nakajima T, Honda Y, Kitao O, Nakai H, Klene M, Li X, Knox JE, Hratchian HP, Cross JB, Bakken V, Adamo C, Jaramillo J, Gomperts R, Stratmann RE, Yazyev O, Austin AJ, Cammi R, Pomelli C, Ochterski JW, Ayala PY, Morokuma K, Voth GA, Salvador P, Dannenberg JJ, Zakrzewski VG, Dapprich S, Daniels AD, Strain MC, Farkas O, Malick DK, Rabuck AD, Raghavachari K, Foresman JB, Ortiz JV, Cui Q, Baboul AG, Clifford S, Cioslowski J, Stefanov BB, Liu G, Liashenko A, Piskorz P, Komaromi I, Martin RL, Fox DJ, Keith T, Al-Laham MA, Peng CY, Nanayakkara A, Challacombe M, Gill PMW, Johnson B, Chen W, Wong MW, Gonzalez C, Pople JA. Gaussian 03, Revision C.02. 2004.
- 37.Green DF, Tidor B. Evaluation of ab initio charge determination methods for use in continuum solvation calculations. J Phys Chem B. 2003;107(37):10261–10273. [Google Scholar]
- 38.Momany FA, Rone R. Validation of the General-Purpose Quanta(R)3.2/Charmm(R) Force-Field. J Comput Chem. 1992;13(7):888–900. [Google Scholar]
- 39.Kangas E, Tidor B. Optimizing electrostatic affinity in ligand-receptor binding: Theory, computation, and ligand properties. J Chem Phys. 1998;109(17):7522–7545. [Google Scholar]
- 40.Jain AN, Nicholls A. Recommendations for evaluation of computational methods. J Comput-Aided Mol Des. 2008;22(3-4):133–139. doi: 10.1007/s10822-008-9196-5. [DOI] [PMC free article] [PubMed] [Google Scholar]
- 41.Wang R, Lu Y, Wang S. Comparative evaluation of 11 scoring functions for molecular docking. J Med Chem. 2003;46(12):2287–2303. doi: 10.1021/jm0203783. [DOI] [PubMed] [Google Scholar]
- 42.McLachlan AD. Rapid comparison of protein structures. Acta Crystallographica Section D-Biological Crystallography. 1982;38:871–873. [Google Scholar]
- 43.Huggins DJ, Tidor B.Systematic placement of structural water molecules for improved scoring of protein-ligand interactions. To Be Submitted 2008 [DOI] [PMC free article] [PubMed]
- 44.Morgantini PY, Kollman PA. Solvation free-energies of amides and amines -disagreement between free-energy calculations and experiment. J Am Chem Soc. 1995;117(22):6057–6063. [Google Scholar]
- 45.Ding YB, Bernardo DN, Kroghjespersen K, Levy RM. Solvation Free-Energies of Small Amides and Amines from Molecular-Dynamics Free-Energy Perturbation Simulations Using Pairwise Additive and Many-Body Polarizable Potentials. J Phys Chem. 1995;99(29):11575–11583. [Google Scholar]
- 46.Gallicchio E, Zhang LY, Levy RM. The SGB/NP hydration free energy model based on the surface generalized born solvent reaction field and novel nonpolar hydration free energy estimators. J Comput Chem. 2002;23(5):517–529. doi: 10.1002/jcc.10045. [DOI] [PubMed] [Google Scholar]
- 47.Rizzo RC, Jorgensen WL. OPLS all-atom model for amines: Resolution of the amine hydration problem. J Am Chem Soc. 1999;121(20):4827–4836. [Google Scholar]
- 48.Oostenbrink C, Juchli D, van Gunsteren WF. Amine hydration: A united-atom force-field solution. ChemPhysChem. 2005;6(9):1800–1804. doi: 10.1002/cphc.200400542. [DOI] [PubMed] [Google Scholar]
- 49.Oostenbrink C, Villa A, Mark AE, Van Gunsteren WF. A biomolecular force field based on the free enthalpy of hydration and solvation: The GROMOS force-field parameter sets 53A5 and 53A6. J Comput Chem. 2004;25(13):1656–1676. doi: 10.1002/jcc.20090. [DOI] [PubMed] [Google Scholar]
- 50.Rizzo RC, Aynechi T, Case DA, Kuntz ID. Estimation of absolute free energies of hydration using continuum methods: accuracy of partial, charge models and optimization of nonpolar contributions. J Chem Theory Comput. 2006;2(1):128–139. doi: 10.1021/ct050097l. [DOI] [PubMed] [Google Scholar]
- 51.Tannor DJ, Marten B, Murphy R, Friesner RA, Sitkoff D, Nicholls A, Ringnalda M, Goddard WA, Honig B. Accurate first principles calculation of molecular charge-distributions and solvation energies from ab-initio quantum-mechanics and continuum dielectric theory. J Am Chem Soc. 1994;116(26):11875–11882. [Google Scholar]
- 52.van de Waterbeemd H, Gifford E. ADMET in silico modelling: Towards prediction paradise? Nat Rev Drug Discovery. 2003;2(3):192–204. doi: 10.1038/nrd1032. [DOI] [PubMed] [Google Scholar]
- 53.Li H, Robertson AD, Jensen JH. Very fast empirical prediction and rationalization of protein pK(a) values. Proteins-Structure Function and Bioinformatics. 2005;61(4):704–721. doi: 10.1002/prot.20660. [DOI] [PubMed] [Google Scholar]
- 54.Czodrowski P, Sotriffer CA, Klebe G. Protonation changes upon ligand binding to trypsin and thrombin: Structural interpretation based on pKa calculations and ITC experiments. J Mol Biol. 2007;367(5):1347–1356. doi: 10.1016/j.jmb.2007.01.022. [DOI] [PubMed] [Google Scholar]
Associated Data
This section collects any data citations, data availability statements, or supplementary materials included in this article.