Abstract
Oxidative stress is implicated in the etiology of many diseases, including alcoholic liver disease (ALD). Peroxiredoxin 6 is a cytosolic peroxidase that has been demonstrated to protect various tissues, such as skin, lung, and cardiac muscle, against acute oxidative insults. Consequently, peroxiredoxin 6 was hypothesized to also protect the liver from oxidative stress generated during the process of chronic ethanol ingestion. To test this, wild-type peroxiredoxin 6 knockout mice (KO), and transgenic peroxiredoxin 6 overexpressing mice (TG) were fed an ethanol-containing diet. Various biomarkers of ALD were assessed, along with the effects of chronic ethanol consumption on the antioxidant defenses. After 9 weeks of ethanol consumption, all backgrounds exhibited elevations of plasma alanine aminotransferase activity, hepatosteatosis, CYP2E1 induction, and lipid peroxidation; however, hepatic triglyceride accumulation seemed to be exacerbated in ethanol-fed TG mice. Differences in antioxidant protein expression and activity in response to chronic ethanol consumption were also observed. Examples include significant inductions of catalase and glutathione transferase activity in ethanol-fed KO and TG mice, along with elevated levels of glutathione peroxidase activity. These alterations in antioxidant defenses could be attributed to either compensatory responses due to the genetic manipulations or ethanol-mediated responses. In conclusion, both ethanol-fed KO and ethanol-fed TG mice developed early stage ALD and peroxiredoxin 6 may play a role in ethanol-mediated hepatic lipid accumulation.
Alcoholic liver disease (ALD) is a complex disease state that progresses through a series of defined stages. The earliest and most benign stage is fatty liver, also termed steatosis. This stage is most common and affects approximately 90 to 100% of long-term heavy drinkers (Arteel et al., 2003). Liver disease can then progress to an inflammatory stage, steatohepatitis, characterized by inflammatory cell infiltration along with fat accumulation. The end, cirrhotic stage consists of a massive wound-healing response resulting in significant fibrosis and capillarization of the sinusoids (Poli, 2000; Arteel et al., 2003). The etiology of ALD is multifactorial, and oxidative stress is a widely accepted etiological factor involved in disease initiation and progression. Oxidative stress can be attributed to the direct metabolism of ethanol by alcohol dehydrogenase, aldehyde dehydrogenase, and CYP2E1; mitochondrial dysfunction; activation of Kupffer cells and other invading inflammatory cells; and decreased antioxidant defenses (Arteel et al., 2003; Lieber, 2004; Dey and Cederbaum, 2006).
Peroxiredoxins are a class of thiol-specific antioxidant proteins that have received a significant amount of attention in recent years. These proteins exert their antioxidant role by exhibiting peroxidase activity, allowing them to reduce a variety of peroxides (Wood et al., 2003). Peroxiredoxins are organized into two classes, 1-Cys and 2-Cys, based on the number of redox-active cysteines involved in the reduction of peroxides. The members of the 2-Cys class include peroxiredoxins 1 to 4, whereas peroxiredoxin 6 is the sole member of the 1-Cys class. All peroxiredoxins have conserved cysteine residue Cys47 that oxidizes to a sulfenic acid upon reaction with the peroxide substrate. Two-Cys peroxiredoxins contain a second cysteine residue, resolving cysteine, which forms a disulfide with the newly generated cysteine sulfenic acid. This newly formed disulfide is then reduced by the thioredoxin/thioredoxin reductase system, effectively recycling the enzyme. Peroxiredoxin 6 does not use a resolving cysteine; therefore, a thiol-containing electron donor must be used to reduce the protein back to its active form (Rhee et al., 2001; Wood et al., 2003). Glutathione has been suggested to be the physiological agent; however, this assertion remains controversial (Kang et al., 1998; Fisher et al., 1999; Peshenko et al., 2001).
The 1-Cys peroxiredoxin, peroxiredoxin (Prx) 6, is a cytosolic protein that is ubiquitously expressed, and elevated levels of this protein can be found in certain epithelial cell types, such as type II pneumocytes and hepatocytes (Kim et al., 2003; Gallagher and Phelan, 2007). Prx6 is unique compared with the other peroxiredoxins because of its ability to reduce phospholipid hydroperoxides (Fisher et al., 1999). In addition, Prx6 has been shown to protect cells from acute oxidative stress using a variety of disease models, such as cardiac ischemia-reperfusion, hyperoxic lung injury, paraquat-induced lung and liver injury, epidermal wound healing, and cataract development (Wang et al., 2003, 2004, 2006; Kümin et al., 2006; Nagy et al., 2006; Kubo et al., 2008).
Using rodent models of chronic ethanol consumption, our laboratory has demonstrated previously that Prx6 is both down-regulated by chronic ethanol consumption and modified by 4-hydroxynonenal (Roede et al., 2008a). Using Prx6 knockout (KO) mice and transgenic (TG) Prx6 overexpressing mice, we sought to evaluate any mechanistic consequences that chronic ethanol consumption would have on these mice. After a 9-week ethanol-feeding protocol, we observed ethanol-mediated ALT elevations, steatosis, and oxidative stress in both ethanol-fed Prx6 knockout mice and the transgenic Prx6 overexpressing mice. In addition, we also observed genotype- and treatment-related alterations in antioxidant protein expression and activity.
Materials and Methods
Animal Model. All procedures involving animals were approved by the Institutional Animal Care and Use Committee of the University of Colorado and were performed in accordance with published National Institutes of Health Guidelines. Male C57/BL6 mice (eight/group), Prx6(-/-) knockout mice (eight/group), and Prx6 transgenic overexpressing mice (eight/group) were used in this study, and details regarding the generation of the knockout and transgenic mice have been described previously (Phelan et al., 2003; Wang et al., 2003). In brief, these mice were fed a modified Lieber-DeCarli diet (Bio-Serv, Frenchtown, NJ) for 9 weeks that consisted of 45% fat-derived calories and 16% protein-derived calories, and the balance of the calories was composed of varying concentrations of carbohydrate-derived and ethanol-derived calories. Animals began the study on a diet containing 2% ethanol (v/v), and the amount of ethanol was increased each week until the diet contained 5% ethanol (v/v). The animals were maintained on the 5% (v/v) ethanol-containing diet for the duration of the study. Each ethanol-fed animal was pair-fed with a control animal that was provided a similar diet in which the ethanol content was substituted by carbohydrates. Food consumption was measured and recorded daily, and body weights were measured at weekly cage changes. Upon completion of the feeding regimen, the animals were anesthetized by an intraperitoneal injection of sodium pentobarbital and euthanized by exsanguination. Blood samples were collected from the inferior vena cava for determination of plasma ALT activity using an assay kit from Diagnostic Chemicals Limited (Oxford, CT). Livers were removed, weighed, and homogenized, and subcellular fractions were prepared as described previously (Carbone et al., 2004).
Biochemical Analysis. Liver triglycerides were measured from chloroform/methanol (2:1) extracts of liver homogenates using a kit from Diagnostic Chemicals Limited. A TransAM NF-κB p65 activation assay from Active Motif Inc. (Carlsbad, CA) was used to assess NF-κB activation in control and ethanol-treated mice. Whole cell extracts were used in the assessment of NF-κB activation, and these samples were prepared using a nuclear extract kit from Active Motif Inc. CYP2E1 activity was assessed by measuring the rate of oxidation of p-nitrophenol to p-nitrocatechol as described previously (Bai and Cederbaum, 2006). Glutathione peroxidase, catalase, superoxide dismutase, and glutathione reductase activity was measured using specific kits from Cayman Chemical (Ann Arbor, MI). Glutathione transferase activity was assessed by monitoring an increase in absorbance at 340 nm using 1-chloro-2,4-dinitrobenzene as a substrate (Luckey and Petersen, 2001). Thiobarbituric acid-reactive substances (TBARS) were measured by adding thiobarbituric acid reagent containing 15% trichloroacetic acid, 0.375% 2-thiobarbituric acid, and 0.25 N HCl to whole liver homogenate samples. The samples were then incubated at 100°C for 15 min. The samples were allowed to cool to room temperature, and protein was pelleted via centrifugation. The absorbance of the supernatant was then read at 535 nm. Protein concentrations were measured using either a bicinchoninic acid protein assay from Pierce Chemical (Rockford, IL) or a protein assay (Bio-Rad Laboratories, Hercules, CA).
Western Blotting. Whole liver extracts or subcellular fractions were separated on a polyacrylamide gel via standard SDS-polyacrylamide gel electrophoresis procedures and then transferred to Hybond-P transfer membrane (GE Healthcare, Chalfont St. Giles, Buckinghamshire, UK). The membrane was then blocked in a solution of 5% nonfat milk in Tris-buffered saline/Tween 20. The membrane was probed with primary antibodies against CYP2E1 (Calbiochem, San Diego, CA); Prx1, Prx2, and Prx3 (Abcam Inc., Cambridge, MA); glutamate-cysteine ligase (GCLC) (a generous gift from Dr. Terry Kavanaugh, University of Washington), heme oxygenase (HO)-1 (Stratagene, La Jolla, CA); and glutathione transferase (GST)-π (Millipore Bioscience Research Reagents, Billerica, MA). A horseradish peroxidase-conjugated secondary antibody was then applied. The membrane was developed using ECL-Plus reagent from GE Healthcare. The chemiluminescence was visualized using a Storm 860 scanner from GE Healthcare. The membrane was then stripped and reprobed with a primary antibody against β-actin (Sigma-Aldrich, St. Louis, MO) to ensure equal protein loading.
Histology and Immunohistochemistry. After the livers were excised from the study animals, a small portion of the tissue was placed into a vial containing 10% neutral-buffered formalin. The tissue samples were then processed and paraffin-embedded, and sections were cut and mounted on slides by Colorado Histoprep (Ft. Collins, CO). One set of slides was stained with hematoxylin and eosin for histological examination of pathology, and the remainder of the slides were deparaffinized and processed for immunohistochemical analysis. The sections were stained with primary antibodies against CYP2E1 (Calbiochem), Prx6 (Abcam Inc.), and 4HNE-keyhole limpet hemocyanin (Synpep, Dublin, CA) and were developed using VECTASTAIN ABC Elite kit (Vector Laboratories, Burlingame, CA) and counterstained with hematoxylin. Positive staining for 4HNE was quantified using a method by Sampey et al. (2007).
Steatosis Scoring. To quantify the number of fat containing cells in each zone of the hepatic lobule, two independent investigators evaluated three slides per group per genotype. The slides were blinded and randomized, and three random fields per zone per slide were evaluated. Both the number of cells possessing significant cytoplasmic clearing/lipid vesicles and normal/lipid absent cells were counted in each zone of the hepatic lobule. The results of this analysis are represented as a mean percentage of cells containing lipid vesicles ± S.E.M. in a given zone of the liver lobule when examined at 400× magnification.
Statistical Analysis. Statistical analysis of the data was performed using the software package SPSS version 16.0 from SPSS Inc. (Chicago, IL). Data are represented as the mean ± S.E.M., and differences due to genotype, treatment, and treatment-genotype interaction were analyzed via two-way analysis of variance. Differences between groups were analyzed via unpaired Student's t test. Differences were considered to be significant if p < 0.05.
Results
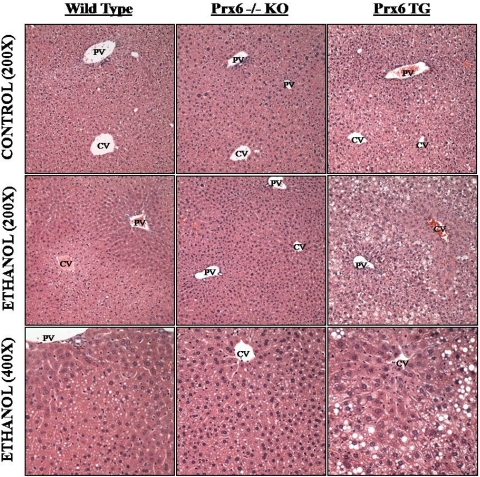
Chronic Ethanol Consumption Results in Increased Liver Injury and Hepatic Triglycerides. It has been demonstrated previously that the ethanol-feeding regimen used in this study results in steatosis in wild-type mice (Roede et al., 2008b); therefore, the same protocol was used in assessing the effect of chronic ethanol on the livers of Prx6(-/-)KO and TG mice. Data in Table 1 describe the results of liver histology scoring and hepatic lipid accumulation. Histological scoring data show that, independently of genetic background, hepatocytes in zone 2 of the hepatic lobule are most affected by chronic ethanol ingestion, whereas hepatocytes in zones 1 and 3 accumulate lesser but similar amounts of lipid. These scoring data also indicate that KO mice are protected from lipid accumulation in all zones of the hepatic lobule. Statistical analysis of the histological scoring data via two-way analysis of variance revealed significant differences in all three zones of the hepatic lobule due to both treatment and genotype. Table 1 further demonstrates that all genetic stocks ingesting ethanol display increased ALT activity compared with their respective pair-fed controls; however, the data do indicate a protective effect of the absence of Prx6 in ethanol-fed mice. Because of extensive variation among the groups, a statistically significant increase in plasma ALT activity was achieved only in the ethanol-fed wild-type mice. Two-way analysis of variance revealed significant differences in plasma ALT activity due to genotype (p = 0.020). All ethanol-fed mice exhibited significant increases in hepatic triglycerides compared with wild-type controls. Further evaluation of triglyceride measurements indicated that livers of ethanol-fed TG mice accumulated the largest amount of triglyceride, followed by ethanol-fed KO and WT mice, respectively. Subsequent statistical analysis revealed that the increases in triglycerides were influenced by both genotype (p < 0.0001) and treatment (p < 0.0001). All ethanol-fed mice displayed significantly increased liver weight to body weight ratios (data not shown). These changes in liver size, as indicated in the liver weight-to-body weight ratio, also displayed both genotype effect (p < 0.0001) and treatment effect (p < 0.0001).
TABLE 1.
Liver histology scoring, hepatic triglyceride measurements, and plasma ALT levels of control and ethanol-fed wild-type, Prx6 KO, and Prx6 TG mice Histological scoring data are represented as mean percentage of cells containing lipid vesicles ± S.E.M. in a given zone of a liver lobule when examined at 400× magnification.
|
Sample |
Liver Histology
Scoringa |
Triglycerideb |
ALTc |
||
|---|---|---|---|---|---|
| Zone 1 | Zone 2 | Zone 3 | |||
| WT control | 60.3 ± 10.6 | 63.7 ± 7.9 | 44.6 ± 4.1 | 0.076 ± 0.021 | 22.5 ± 6.5 |
| KO control | 37.4 ± 2.4 | 50.7 ± 3.1 | 35.1 ± 16.9 | 0.092 ± 0.037 | 11.1 ± 8.5 |
| TG control | 69.1 ± 9.8† | 72.4 ± 6.6 | 47.0 ± 2.1 | 0.129 ± 0.054* | 16.6 ± 5.1 |
| WT ethanol | 80.8 ± 1.1* | 94.8 ± 0.6*** | 87.4 ± 3.3*** | 0.103 ± 0.028 | 27.5 ± 7.3* |
| KO ethanol | 56.7 ± 2.3 | 75.1 ± 1.7 | 46.4 ± 4.0 | 0.131 ± 0.015***,† | 14.5 ± 2.7 |
| TG ethanol | 87.0 ± 2.7**,#,% | 90.9 ± 3.3**,†,‡ | 79.3 ± 4.4**,‡,$ | 0.192 ± 0.018***,‡ | 29.2 ± 23.4 |
p < 0.05 (vs. WT control)
p < 0.01 (vs. WT control)
p < 0.001 (vs. WT control)
p < 0.05 (vs. KO control)
p < 0.001 (vs. KO control)
p < 0.05 (vs. TG control)
p < 0.01 (vs. TG control)
Histology scoring results (see Materials and Methods)
Hepatic triglycerides (micromoles per milligram of tissue)
Plasma ALT activity (units per liter)
Consistent with the elevated hepatic triglycerides and histological scoring, all ethanol-fed mice developed steatosis (Fig. 1), predominantly in zone 2 of the hepatic lobule. The steatosis consisted primarily of small lipid vesicles with few very large (larger than a normal hepatocyte nucleus in diameter) lipid droplets. Last, a blind analysis of control and ethanol-fed tissue sections from all backgrounds did not reveal any significant observations of tissue necrosis, inflammation, or abnormal cellular infiltration. Taken together, these data demonstrate that all mice studied develop steatosis and mild liver injury in response to chronic ethanol feeding and that Prx6 might be involved in hepatic lipid accumulation.
Fig. 1.
Chronic ethanol feeding results in steatosis. All ethanol-fed animals developed steatosis primarily in the midzonal and centrilobular regions of the hepatic lobule. Hematoxylin- and eosin-stained tissue sections. CV, central vein; PV, portal vein.
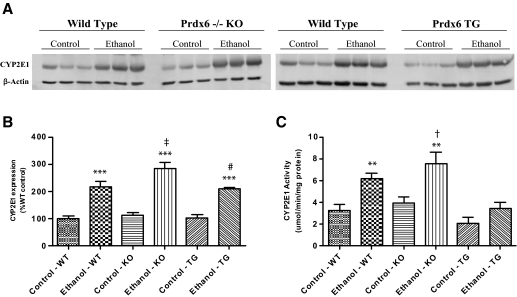
Chronic Ethanol Feeding Results in a Significant Induction of CYP2E1 and Lipid Peroxidation. After 9 weeks of ethanol ingestion, all genetic backgrounds displayed induced levels of CYP2E1 protein. This was illustrated via immunohistochemistry (data not shown) and immunoblotting (Fig. 2A). Consistent with the lobular distribution of cytochromes P450, immunohistochemistry showed a dramatic induction of CYP2E1 in the centrilobular region, with staining radiating from the central vein to the midzonal region. Ethanol-fed KO mice displayed more intense staining for CYP2E1 compared with the ethanol-fed wild-type and TG mice, which was confirmed via Western blot (Fig. 2, A and B). The changes in expression were found to be influenced significantly by genotype (p = 0.050) and treatment (p < 0.0001). Measurements of CYP2E1 activity (Fig. 2C) confirmed the expression data with significant genotype effects (p < 0.0001) and treatment effects (p < 0.0001).
Fig. 2.
Chronic ethanol feeding results in CYP2E1 induction observed in Western blot (A and B) and activity measurements (C). n = 8, mean ± S.E.M. **, p < 0.01 (versus WT control); ***, p < 0.001 (versus WT control); †, p < 0.05 (versus KO control); ‡, p < 0.01 (versus KO control); #, p < 0.01 (versus TG control).
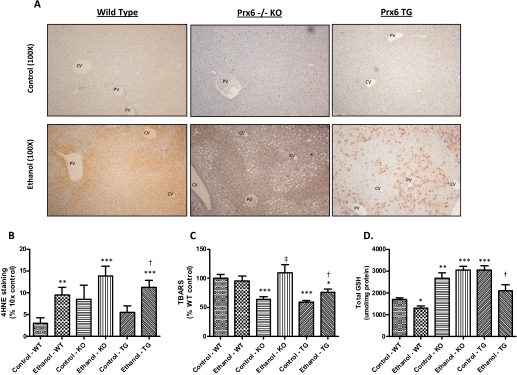
Chronic ethanol treatment also resulted in increased oxidative stress as evidenced by the measurements of two indices of increased lipid peroxidation. Lipid peroxidation was visualized via immunohistochemical detection of 4HNE-modified proteins in control and ethanol-fed wild-type, KO, and TG mice presented in Fig. 3A. Significant increases in 4HNE-modified proteins occurred in both WT and TG mice (Fig. 3B), with positive staining predominating in the periportal region. Statistical analysis also revealed that the significant increase in 4HNE-modified proteins was only due to treatment (p = 0.0008). In Fig. 3C, the measurement of TBARS in liver homogenates illustrates a significant increase in lipid peroxidation in the KO and TG ethanol-fed mice due to genotype (p = 0.009) and treatment (p = 0.011) as well as an interaction between treatment and genotype (p = 0.0265). Although both ethanol-fed KO and TG mice displayed increased TBARS values compared with their respective controls, the KO background increased TBARS to a greater extent than TG mice, and this increase trended toward significance (p = 0.077). Additional evidence of oxidative stress is presented in Fig. 3D, which shows a statistically significant decrease in total glutathione concentrations in wild-type and TG mice ingesting ethanol, although a significant interaction was detected because of the significant increase in constitutive levels of hepatic GSH in the TG background. It is curious that an increase in glutathione was observed in the ethanol-fed KO mice. Collectively, these data indicate that all genetic backgrounds display elevated indices of oxidative stress and lack a global protective response to chronic ethanol ingestion.
Fig. 3.
Chronic ethanol feeding causes lipid peroxidation and alterations in total GSH. Increased lipid peroxidation was visualized by staining for 4HNE-modified proteins (A and B) and TBARS assessment (C). Total GSH (D) was also measured in all animals. CV, central vein; PV, portal vein. n = 8, mean ± S.E.M. *, p < 0.05 (versus WT control); **, p < 0.01 (versus WT control); ***, p < 0.001 (versus WT control); †, p < 0.05 (versus TG control); ‡, p < 0.01 (versus KO control).
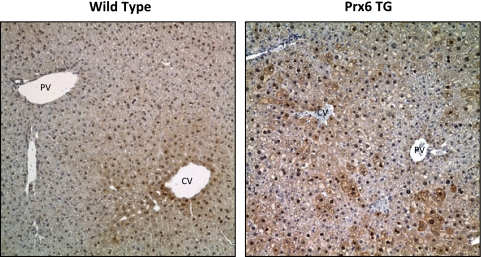
Chronic Ethanol Consumption Down-Regulates Peroxiredoxin 6 but Has Only Minimal Effects on 2-Cys Peroxiredoxins. The overexpression of Prx6 was not consistent throughout the liver section, and there was no clear pattern of distribution (Fig. 4). As expected, liver sections from KO mice were void of Prx6 staining, indicating the absence of the protein (data not shown). Positive staining for Prx6 was also observed in the nucleus of both wild-type and TG mice, and this staining was restricted to only hepatocyte nuclei, as reported previously by our laboratory (Roede et al., 2008b). Ethanol-mediated decreases in Prx6 expression was observed via immunohistochemistry and Western blots, and this effect was observed in both ethanol-fed wild-type and TG mice (data not shown).
Fig. 4.
Immunohistochemical analysis of Prx6 expression in wild-type, KO, and TG mice. Note the positive nuclear staining in both wild-type and TG mice. Also note the mosaic pattern of positive staining in the TG mice. CV, central vein; PV, portal vein. Magnification, 200×.
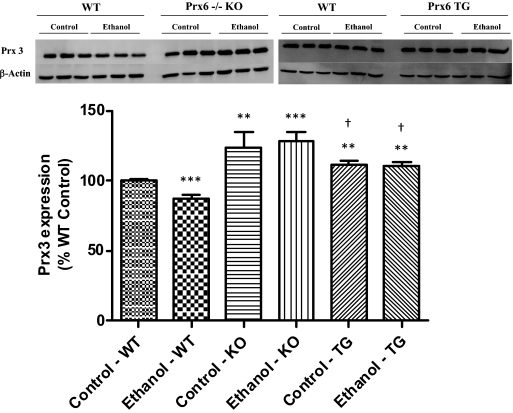
To evaluate the possibility of compensatory responses of other classes of peroxiredoxins, the effect of chronic ethanol on the expression of 2-Cys peroxiredoxins was also evaluated in wild-type, KO, and TG mice. The expression of cytosolic, 2-Cys peroxiredoxin isoforms Prx1 and Prx2 was unchanged by both ethanol treatment and genotype (data not shown). However, as shown in Fig. 5, expression of Prx3, the mitochondrial isoform, was significantly decreased in ethanol-fed wild-type mice. It is of interest to note that both control and ethanol-fed KO mice exhibited significantly elevated Prx3 expression compared with wild-type controls. Levels of Prx3 in the TG mice were also slightly elevated compared with the wild-type controls but not to the magnitude of the KO mice. The changes in Prx3 expression were found to be only significant due to a genotype effect (p < 0.0001). These data show that only Prx3 and Prx6 expression were affected by ethanol in wild-type mice, whereas the KO and TG strains possess basally elevated Prx3 levels.
Fig. 5.
Expression of Prx3 is basally elevated in KO mice compared with wild type. n = 3, mean ± S.E.M. **, p < 0.01 (versus WT control); ***, p < 0.001 (versus WT control); †, p < 0.05 (versus KO ethanol).
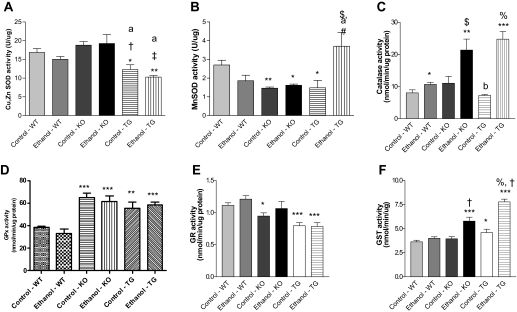
Effect of Ethanol and Genotype on the Antioxidant Defenses. The activity of various antioxidant proteins was also measured to determine whether treatment or genotypic differences in Prx6 were reflected in the response of several key antioxidant enzymes due to chronic ethanol ingestion. Figure 6A shows significantly decreased copper/zinc SOD activity in both TG control and TG ethanol-fed animals compared with wild-type controls. Two-way analysis of variance revealed only a genotype effect on copper/zinc SOD activity (p < 0.0001). In addition, activity of manganese SOD was significantly decreased in KO control and ethanol-fed mice along with TG control mice compared with wild-type controls (Fig. 6B), with additional significant differences due to genotype (p = 0.034). Manganese SOD activity also displayed a significant interaction (p = 0.001), which was due to the significantly decreased levels observed in the KO mice and the dramatic ethanol-mediated increase in the TG mice. In addition, ethanol feeding resulted in a decrease of manganese SOD activity in wild-type background, a response that was not observed in the KO and TG background. All genetic backgrounds displayed a significant induction of catalase activity when treated chronically with ethanol; however, marked, 2- to 4-fold ethanol-mediated increases in catalase activity were observed in KO and TG mice, respectively (Fig. 6C). Analysis of these data indicated significant effects due to genotype (p < 0.0001), treatment (p < 0.0001), and an interaction (p = 0.02). Glutathione peroxidase (GPx) activity was not dramatically affected by ethanol treatment, although KO and TG mice had significantly elevated GPx activity compared with wild-type mice (p < 0.0001) (Fig. 6D). A minor induction of glutathione reductase activity was observed in ethanol-fed wild-type and ethanol-fed KO mice, but the activity was mainly affected by the genotype (p < 0.0001) (Fig. 6E). Last, measurements of GST activity revealed significant ethanol-mediated inductions of activity in the KO and TG background (Fig. 6F). The effects of genotype and treatment on GST activity were both found to be significant (p < 0.0001) as was the interaction due to the elevated control levels of activity in the TG and KO mice and ethanol-mediated increases in activity in the TG and KO mice. Collectively these data show some ethanol-mediated effects on the activity of various antioxidant proteins; however, compensation or down-regulation due to the gene knockout or overexpression was not observed.
Fig. 6.
Effect of chronic ethanol and genotype on the activity of copper/zinc SOD (A), manganese SOD (B), catalase (C), glutathione peroxidase (D), glutathione reductase (E), and glutathione transferase (F). n = 4 to 8, mean ± S.E.M. *, p < 0.05 (versus WT control); **, p < 0.01 (versus WT control); ***, p < 0.001 (versus WT control); $, p < 0.05 (versus KO control); †, p < 0.01 (versus KO control); ‡, p < 0.001 (versus KO control); #, p < 0.05 (versus TG control); %, p < 0.001 (versus TG control); a, p < 0.05 (versus KO ethanol); b, p < 0.001 (versus KO ethanol).
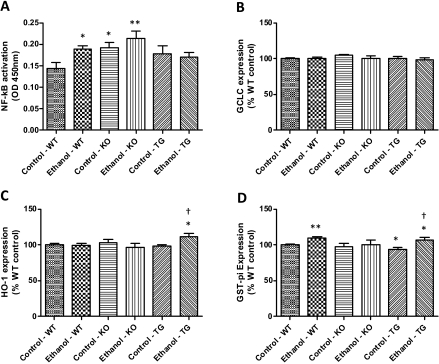
Assessment of NF-κB Activation and Nrf2-Regulated Gene Expression Due to Chronic Ethanol Consumption. Inflammation is commonly observed during the initiation and progression of ALD (Arteel, 2003; Arteel et al., 2003), and NF-κB activation is involved in the inflammatory mechanism; therefore, we measured the effect of chronic ethanol on NF-κB activation. Using a TransAM enzyme-linked immunosorbent assay, we measured p65 DNA binding and confirmed a significant genotype effect (p = 0.027) and significant activation in ethanol-fed wild-type mice (Fig. 7A). Interestingly, both KO and TG backgrounds had elevated basal NF-κB activation compared with wild-type controls; however, only control and ethanol-fed KO mice were found to be significantly elevated compared with wild-type controls.
Fig. 7.
Effect of chronic ethanol on NF-κB activation (A) and Nrf2-regulated gene expression (B–D). n = 3, mean ± S.E.M. *, p < 0.05 (versus WT control); **, p < 0.01 (versus WT control); †, p < 0.05 (versus TG control).
Nrf2, a redox-sensitive transcription factor activated by oxidative stress/electrophiles, mediates transcription of various genes involved in drug metabolism and antioxidant defense (Ishii et al., 2000; Kobayashi and Yamamoto, 2006). We evaluated the expression of three genes, GCLC, HO-1, and GST-π, known to be under the control of the Nrf2 transcription factor, by using Western blot analysis (Fig. 7, B–D). Results show no change in expression of GCLC in response to chronic ethanol in all genetic backgrounds (Fig. 7B). HO-1 expression was also largely unchanged; however, ethanol-fed TG mice displayed a significant induction compared with wild-type control and TG control mice (Fig. 7C). Last, Fig. 7D shows that chronic ethanol feeding resulted in a significant increase in GST-π expression in both wild-type and TG mice.
Discussion
The etiology of alcoholic liver disease is multifactorial and includes oxidative stress as one of the many factors contributing to hepatic injury (Arteel, 2003; Arteel et al., 2003; Dey and Cederbaum, 2006; Albano, 2008). Common hepatic responses to chronic ethanol consumption include elevated plasma ALT activity, elevated liver weight-to-body weight ratio, and elevated hepatic triglycerides. The data presented in Table 1 illustrate that both the KO mice and TG mice displayed indices of early stage ALD. All of these common metrics of early stage ALD were elevated due to chronic ethanol treatment and were found to be statistically significant genotype and diet effects, with the exception of ALT activity. Collectively, Table 1 demonstrates chronic ethanol treatment will result in early stage ALD in the KO and TG mice.
Another hallmark of ALD is the development of steatosis, which is the most predominant metabolic marker of alcohol abuse, with 90 to 100% of alcoholics developing fatty liver (Arteel et al., 2003). Histological scoring and photomicrographs of control and ethanol-treated mice presented in Fig. 1 demonstrate development of steatosis in mice of all three backgrounds studied. Midzonal (zone 2) microvesicular steatosis was the primary observation in all of the sections from livers of ethanol-fed animals. The data presented in Table 1 and Fig. 1 suggest that overexpression of Prx6 does not seem to protect the liver from triglyceride accumulation and may actually exacerbate this process.
Induction of CYP2E1, a common component of ALD, is known to contribute to hepatic oxidative stress due to chronic ethanol ingestion. In this context, previous studies have noted that microsomes from ethanol-fed mice were 2- to 3-fold more active in generating superoxide and hydrogen peroxide than their pair-fed counterparts and chow-fed controls (Wu and Cederbaum, 2003). Investigation of CYP2E1 expression revealed that, independently of Prx6 genotype, all ethanol-treated mice experienced at least a 2-fold induction in protein, along with a 2-fold induction in activity. It is interesting to note that TG animals exhibited lower CYP2E1 activity levels compared with both wild-type and KO mice, and it is unclear why the activity was not induced to the same magnitude as the protein level in ethanol-fed TG mice. Taken together, the data presented here indicated that Prx6 genotype is not involved in the responses of hepatic CYP2E1 to chronic ethanol ingestion.
To further characterize the KO and TG animal model, we investigated potential antioxidant compensation or down-regulation due to the absence or overexpression of Prx6, respectively. Ethanol-mediated decreases in GSH were observed in the wild-type and TG backgrounds. Total GSH levels were also observed to be constitutively increased in the KO and TG background. The elevated GSH levels observed in the KO and TG mice could be due to alterations in the GSH biosynthesis. Increased γ-glutamyl transpeptidase activity in these backgrounds would provide increased recycling of GSH and GSH conjugates. Differences in cellular transporters could also exist. Down-regulation of transporters such organic anion transporting polypeptide 1, organic anion transporting polypeptide 2, multidrug-resistance protein 1, and multidrug-resistance protein 2, which are the major GSH-trafficking transporters, would result in higher cellular GSH concentrations (Ballatori et al., 2005).
Prx6 is reported to reduce phospholipid hydroperoxides, thereby preventing or attenuating lipid peroxidation (Fisher et al., 1999; Manevich and Fisher, 2005). Therefore, we anticipated that the KO mice would display enhanced oxidative stress associated with chronic ethanol ingestion. However, increased oxidative stress, indicated by increased TBARS- and 4HNE-modified proteins and decreased GSH, was observed in ethanol-fed mice of all genetic backgrounds. It was noted that immunostaining for 4HNE-modified proteins in control KO mice was less than the corresponding WT and TG controls. The apparent absence of adducts in the KO may be associated with increased GPx4 activity (Fig. 6E), whose substrates are also phospholipid hydroperoxides (Brigelius-Flohé, 2006). It is noteworthy that this same genetic stock displayed elevated hepatic glutathione levels that could provide additional antioxidant protection. In addition, the overexpression of Prx6 did not prevent or attenuate ethanol-mediated lipid peroxidation. Protein adducts were not predicted to occur in the ethanol-fed TG mice, due to previous data indicating that Prx6 overexpression can reduce intracellular hydrogen peroxide levels and phospholipid peroxidation-mediated membrane damage (Manevich et al., 2002; Phelan et al., 2003; Kümin et al., 2006). A potential explanation for the presence of 4HNE protein adducts is the irregular mosaic distribution of hepatic Prx6 expression. Figure 4 shows this mosaic pattern where various cells possess dark staining for Prx6, whereas others are devoid of staining. In addition to the irregular expression of Prx6, decreased CYP2E1 activity in the TG mice may contribute to lower ROS production and less lipid peroxidation.
We also chose to measure the expression of 2-Cys peroxiredoxins and activity of various other antioxidant proteins. A brief characterization of the response of the KO mouse to paraquat-induced oxidative stress has been performed previously (Wang et al., 2003); however, the authors only measured mRNA expression and not protein or activity level. Analysis of 2-Cys peroxiredoxin expression revealed virtually no change in the expression of Prx1 and Prx2. Expression of Prx3 was found to be altered in the KO mice compared with both wild-type and TG mice. Using a model of hepatic ischemia/reperfusion injury Eismann et al. (2009) demonstrated increased mitochondrial oxidative stress in KO mice; therefore, increased expression of Prx3 in the mitochondria of KO mice could be a compensatory response due to the absence of Prx6.
The effect of genotype on antioxidant activity proved to be an interesting observation. The control activity of all of the proteins studied displayed genotype-specific differences. For example, the GPx activity of both KO and TG mice was significantly higher than the wild type. The increase in GPx activity in KO mice could be due to a compensatory mechanism due to the absence of Prx6, which possesses GPx activity. TG mice exhibit an approximately 2.5-fold overexpression of Prx6 compared with the wild type, and this increase in protein could account for the increased GPx activity observed in these animals. Glutathione reductase activity of the KO and TG mice was less than that of the wild type. Ethanol-mediated changes in enzyme activity were also more exaggerated due to genotype. For example, major increases in catalase, manganese SOD and GST activity were observed in the ethanol-fed TG mice and resulted in statistically significant interactions. KO mice also exhibited large ethanol-mediated increases in catalase and GST activity, which resulted in statistically significant interactions. Even though ethanol-mediated increases in activity were observed for both the KO and TG mice, this compensation did not prevent lipid peroxidation or steatosis.
While investigating potential antioxidant compensation responses, we evaluated activation of the redox transcription factor Nrf2 by analyzing the expression of proteins known to be transcriptionally regulated by Nrf2. Nrf2 is a redox-sensitive transcription factor that is involved in the expression of many antioxidant proteins and phase II detoxification enzymes (Zhang, 2006). The data presented in Fig. 7, B to D, showed very small changes in all proteins analyzed. Data from TG mice did indicate some changes, such as increased GST-π expression, pan GST activity, and HO-1 expression in response to ethanol, which may signal increased Nrf2 activation. Dramatic changes in Nrf2-regulated genes such as HO-1 were not observed, and this might be due to the nature of the oxidative stress involved in ALD. ALD is characterized by chronic, low levels of oxidative stress that, over time, can overwhelm protective responses and alter cellular homeostasis. Therefore, dramatic inductions of Nrf2-regulated genes may not be observed due to mild, constitutive activation.
In summary, these data indicate that wild-type, KO, and TG mice display comparable susceptibilities to ethanol-mediated liver damage due to chronic ethanol feeding. All backgrounds exhibited increased plasma ALT activity, increased hepatic triglycerides, steatosis, and oxidative stress. Although ethanol-fed KO mice displayed increased liver weight-to-body weight ratios and increased indices of lipid peroxidation compared with the WT and TG backgrounds, suggesting increased sensitivity to ethanol, it can be concluded that the down-regulation and aldehyde modification of Prx6 observed previously (Roede et al., 2008a,b) is not intimately involved in the mechanism of disease initiation and progression and that KO mice may be protected from triglyceride accumulation. It is noteworthy that the overexpression of Prx6 was not associated with significant protection from ethanol-mediated liver injury but may have exacerbated hepatic lipid accumulation, suggesting that the antioxidant function of Prx6 does not seem to be involved in the initiation and/or progression of ALD and that Prx6 may possess other functions that have yet to be studied. It should be noted that this is the first attempt to investigate the importance of Prx6 in a model of chronic oxidative stress. All previously published studies investigating the role of Prx6 involved acute oxidative challenges that demonstrated cytoprotective properties of Prx6 in these circumstances. Therefore, this novel study indicates that the antioxidant properties of Prx6 are not great enough to prevent or attenuate the tissue damage in a model of chronic oxidative stress and that Prx6 may have unknown function(s) in the area of lipid metabolism.
Acknowledgments
We thank Dr. Richard Radcliffe for help with the statistical analysis.
The work was supported in part by the National Institutes of Health National Institute of Alcohol Abuse and Alcoholism [Grants R37-AA09300, F31-AA016710] (to D.R.P., and to J.R.R., respectively); and by the National Institutes of Health National Institute of Diabetes and Digestive and Kidney Diseases [Grant 074487] (to D.R.P.).
Article, publication date, and citation information can be found at http://jpet.aspetjournals.org.
doi:10.1124/jpet.109.152983.
ABBREVIATIONS: ALD, alcoholic liver disease; Prx, peroxiredoxin; KO, Prx6(-/-) knockout mice; TG, Prx6 transgenic mice; ALT, alanine aminotransferase; NF-κB, nuclear factor-κB; GCLC, glutamate-cysteine ligase catalytic; GST, glutathione transferase; TBARS, thiobarbituric acid-reactive substances; HO, heme oxygenase; 4HNE, 4-hydroxynonenal; GSH, glutathione; SOD, superoxide dismutase; GPx, glutathione peroxidase; Nrf, NF-E2-related factor; WT, wild type.
References
- Albano E (2008) Oxidative mechanisms in the pathogenesis of alcoholic liver disease. Mol Aspects Med 299 -16. [DOI] [PubMed] [Google Scholar]
- Arteel GE (2003) Oxidants and antioxidants in alcohol-induced liver disease. Gastroenterology 124778 -790. [DOI] [PubMed] [Google Scholar]
- Arteel G, Marsano L, Mendez C, Bentley F, and McClain CJ (2003) Advances in alcoholic liver disease. Best Pract Res Clin Gastroenterol 17625 -647. [DOI] [PubMed] [Google Scholar]
- Bai J and Cederbaum AI (2006) Adenovirus-mediated expression of CYP2E1 produces liver toxicity in mice. Toxicol Sci 91365 -371. [DOI] [PubMed] [Google Scholar]
- Ballatori N, Hammond CL, Cunningham JB, Krance SM, and Marchan R (2005) Molecular mechanisms of reduced glutathione transport: role of the MRP/CFTR/ABCC and OATP/SLC21A families of membrane proteins. Toxicol Appl Pharmacol 204238 -255. [DOI] [PubMed] [Google Scholar]
- Brigelius-Flohé R (2006) Glutathione peroxidases and redox-regulated transcription factors. Biol Chem 3871329 -1335. [DOI] [PubMed] [Google Scholar]
- Carbone DL, Doorn JA, Kiebler Z, Sampey BP, and Petersen DR (2004) Inhibition of Hsp72-mediated protein refolding by 4-hydroxy-2-nonenal. Chem Res Toxicol 171459 -1467. [DOI] [PMC free article] [PubMed] [Google Scholar]
- Dey A and Cederbaum AI (2006) Alcohol and oxidative liver injury. Hepatology 43S63 -S74. [DOI] [PubMed] [Google Scholar]
- Eismann T, Huber N, Shin T, Kuboki S, Galloway E, Wyder M, Edwards MJ, Greis KD, Shertzer HG, Fisher AB, et al. (2009) Peroxiredoxin-6 protects against mitochondrial dysfunction and liver injury during ischemia-reperfusion in mice. Am J Physiol Gastrointest Liver Physiol 296G266 -G274. [DOI] [PMC free article] [PubMed] [Google Scholar]
- Fisher AB, Dodia C, Manevich Y, Chen JW, and Feinstein SI (1999) Phospholipid hydroperoxides are substrates for non-selenium glutathione peroxidase. J Biol Chem 27421326 -21334. [DOI] [PubMed] [Google Scholar]
- Gallagher BM and Phelan SA (2007) Investigating transcriptional regulation of Prdx6 in mouse liver cells. Free Radic Biol Med 421270 -1277. [DOI] [PubMed] [Google Scholar]
- Ishii T, Itoh K, Takahashi S, Sato H, Yanagawa T, Katoh Y, Bannai S, and Yamamoto M (2000) Transcription factor Nrf2 coordinately regulates a group of oxidative stress-inducible genes in macrophages. J Biol Chem 27516023 -16029. [DOI] [PubMed] [Google Scholar]
- Kang SW, Baines IC, and Rhee SG (1998) Characterization of a mammalian peroxiredoxin that contains one conserved cysteine. J Biol Chem 2736303 -6311. [DOI] [PubMed] [Google Scholar]
- Kim HS, Manevich Y, Feinstein SI, Pak JH, Ho YS, and Fisher AB (2003) Induction of 1-cys peroxiredoxin expression by oxidative stress in lung epithelial cells. Am J Physiol Lung Cell Mol Physiol 285L363 -L369. [DOI] [PubMed] [Google Scholar]
- Kobayashi M and Yamamoto M (2006) Nrf2-Keap1 regulation of cellular defense mechanisms against electrophiles and reactive oxygen species. Adv Enzyme Regul 46113 -140. [DOI] [PubMed] [Google Scholar]
- Kubo E, Fatma N, Akagi Y, Beier DR, Singh SP, and Singh DP (2008) TAT-mediated PRDX6 protein transduction protects against eye lens epithelial cell death and delays lens opacity. Am J Physiol Cell Physiol 294C842 -C855. [DOI] [PubMed] [Google Scholar]
- Kümin A, Huber C, Rülicke T, Wolf E, and Werner S (2006) Peroxiredoxin 6 is a potent cytoprotective enzyme in the epidermis. Am J Pathol 1691194 -1205. [DOI] [PMC free article] [PubMed] [Google Scholar]
- Lieber CS (2004) Alcoholic fatty liver: its pathogenesis and mechanism of progression to inflammation and fibrosis. Alcohol 349 -19. [DOI] [PubMed] [Google Scholar]
- Luckey SW and Petersen DR (2001) Metabolism of 4-hydroxynonenal by rat Kupffer cells. Arch Biochem Biophys 38977 -83. [DOI] [PubMed] [Google Scholar]
- Manevich Y and Fisher AB (2005) Peroxiredoxin 6, a 1-Cys peroxiredoxin, functions in antioxidant defense and lung phospholipid metabolism. Free Radic Biol Med 381422 -1432. [DOI] [PubMed] [Google Scholar]
- Manevich Y, Sweitzer T, Pak JH, Feinstein SI, Muzykantov V, and Fisher AB (2002) 1-Cys peroxiredoxin overexpression protects cells against phospholipid peroxidation-mediated membrane damage. Proc Natl Acad Sci U S A 9911599 -11604. [DOI] [PMC free article] [PubMed] [Google Scholar]
- Nagy N, Malik G, Fisher AB, and Das DK (2006) Targeted disruption of peroxiredoxin 6 gene renders the heart vulnerable to ischemia-reperfusion injury. Am J Physiol Heart Circ Physiol 291H2636 -H2640. [DOI] [PubMed] [Google Scholar]
- Peshenko IV, Singh AK, and Shichi H (2001) Bovine eye 1-Cys peroxiredoxin: expression in E. coli and antioxidant properties. J Ocul Pharmacol Ther 17 93-99. [DOI] [PubMed] [Google Scholar]
- Phelan SA, Wang X, Wallbrandt P, Forsman-Semb K, and Paigen B (2003) Overexpression of Prdx6 reduces H2O2 but does not prevent diet-induced atherosclerosis in the aortic root. Free Radic Biol Med 351110 -1120. [DOI] [PubMed] [Google Scholar]
- Poli G (2000) Pathogenesis of liver fibrosis: role of oxidative stress. Mol Aspects Med 21 49-98. [DOI] [PubMed] [Google Scholar]
- Rhee SG, Kang SW, Chang TS, Jeong W, and Kim K (2001) Peroxiredoxin, a novel family of peroxidases. IUBMB Life 5235 -41. [DOI] [PubMed] [Google Scholar]
- Roede JR, Carbone DL, Doorn JA, Kirichenko OV, Reigan P and Petersen DR (2008a) In vitro and in silico characterization of peroxiredoxin 6 modified by 4-hydroxynonenal and 4-oxononenal. Chem Res Toxicol DOI: 10.1021/tx800244u. [DOI] [PubMed]
- Roede JR, Stewart BJ, and Petersen DR (2008b) Decreased expression of peroxiredoxin 6 in a mouse model of ethanol consumption. Free Radic Biol Med 451551 -1558. [DOI] [PubMed] [Google Scholar]
- Sampey BP, Stewart BJ, and Petersen DR (2007) Ethanol-induced modulation of hepatocellular extracellular signal-regulated kinase-1/2 activity via 4-hydroxynonenal. J Biol Chem 2821925 -1937. [DOI] [PMC free article] [PubMed] [Google Scholar]
- Wang X, Phelan SA, Forsman-Semb K, Taylor EF, Petros C, Brown A, Lerner CP, and Paigen B (2003) Mice with targeted mutation of peroxiredoxin 6 develop normally but are susceptible to oxidative stress. J Biol Chem 27825179 -25190. [DOI] [PubMed] [Google Scholar]
- Wang Y, Feinstein SI, Manevich Y, Ho YS, and Fisher AB (2004) Lung injury and mortality with hyperoxia are increased in peroxiredoxin 6 gene-targeted mice. Free Radic Biol Med 371736 -1743. [DOI] [PubMed] [Google Scholar]
- Wang Y, Feinstein SI, Manevich Y, Ho YS, and Fisher AB (2006) Peroxiredoxin 6 gene-targeted mice show increased lung injury with paraquat-induced oxidative stress. Antioxid Redox Signal 8229 -237. [DOI] [PubMed] [Google Scholar]
- Wood ZA, Schröder E, Robin Harris J, and Poole LB (2003) Structure, mechanism and regulation of peroxiredoxins. Trends Biochem Sci 2832 -40. [DOI] [PubMed] [Google Scholar]
- Wu D and Cederbaum AI (2003) Alcohol, oxidative stress, and free radical damage. Alcohol Res Health 27277 -284. [PMC free article] [PubMed] [Google Scholar]
- Zhang DD (2006) Mechanistic studies of the Nrf2-Keap1 signaling pathway. Drug Metab Rev 38769 -789. [DOI] [PubMed] [Google Scholar]


