Abstract
The glycine receptor (GlyR) is a ligand-gated ion channel and member of the nicotinic acetylcholine receptor superfamily. Acting as allosteric modulators of receptor function, drugs such as alcohol and volatile anesthetics enhance the function of GlyRs. The actions of these drugs at inhibitory receptors in the brain and spinal cord are thought to produce many of the physiological effects associated with their use. The actions of ethanol on the GlyR have been well studied on the macroscopic, whole cell level. We examined the effects of 3 μM glycine ± 50 or 200 mM ethanol on outside-out patches pulled from Xenopus laevis oocytes expressing wild-type α1 GlyR, to determine the effects of alcohol at the single-channel level. Alcohol enhanced GlyR function in a very specific manner. It had minimal effects on open and closed dwell times and likelihood. Instead, ethanol potentiated GlyR function almost exclusively by increasing burst durations and increasing the number of channel openings per burst, without affecting the percentage of open time within bursts. Kinetic modeling suggests that ethanol increases burst durations by decreasing the rate of glycine unbinding.
Glycine receptors (GlyRs) constitute the major inhibitory neurotransmitter receptor system in the brainstem and spinal cord but are also found in significant numbers in higher brain regions, such as the olfactory bulb, midbrain, cerebellum, and cerebral cortex (Betz, 1991). Along with the GABAA, GABAC, nicotinic acetylcholine, and serotonin-3 receptors, the GlyR is a member of a large receptor superfamily of subunits, sharing several structural features: an extracellular N-terminal region that contains neurotransmitter-binding domains, four transmembrane (TM) domains, and a large intracellular loop between the third and fourth TM domains. Receptors in this superfamily contain an integral ion channel that selectively conducts anions in the case of GABA and glycine receptors, and each receptor is composed of five subunits. There are two classes of glycine receptor subunits: the α subunits, of which there are four subtypes, and one β subunit (Lynch, 2004). Most native GlyRs in adult animals consist of heteromeric α1β subunits, although homomeric α2 subunits are the predominant form found prenatally (Rajendra and Schofield, 1995). The glycine α, but not β, subunits can form homomeric receptors that express well in a variety of receptor expression systems.
Volatile anesthetics, propofol, and alcohols enhance GlyR-mediated currents (Mascia et al., 1996a,b). Electrophysiological studies show that ethanol (EtOH) enhances GlyR function in mouse and chick embryonic spinal neurons in a concentration-dependent manner (Celentano et al., 1988; Aguayo and Pancetti, 1994). The glycine EC50 value is decreased by 100 mM EtOH, with no effect on the maximal glycinergic currents (Aguayo et al., 1996), i.e., EtOH left-shifts glycine concentration-response curves. Furthermore, concentrations of EtOH that enhance GlyR function in mouse spinal cord neurons (10–200 mM) have no effects on membrane lipid order (Tapia et al., 1998), suggesting a protein site of action. Studies using dissociated ventral tegmental area neurons also demonstrate EtOH enhancement of glycine receptor function (Ye et al., 2001). Finally, EtOH increases glycine-mediated chloride uptake into rat brain synaptoneurosomes (Engblom and Akerman, 1991).
Structure-function studies involving amino acid mutations in GlyR subunits were conducted in an attempt to eliminate the actions of alcohols and thereby infer a site of ethanol action. Our initial studies (Mihic et al., 1997, Wick et al., 1998) suggested that amino acids in TM regions 2 and 3 of these receptor subunits play a critical role in alcohol modulation of channel function, although TM1 and TM4 residues have also been implicated (Lobo et al., 2004, 2006, 2008). These data support the hypothesis that a water-filled cavity exists among the TM regions in which alcohols can act. Altering the sizes of amino acids lining this cavity also affected the size of alcohol that could fit and affect GlyR function (Wick et al., 1998). In addition, Crawford et al. (2007) implicated an amino acid in the extracellular N-terminal domain as also constituting part of this alcohol binding pocket, concluding that different amino acids within the pocket are responsible for enhancing and inhibiting effects of ethanol on GlyR function. Application of alcohol-like thiol compounds such as propyl methanethiosulfonate to glycine receptors mutated to cysteine at critical residues identified which specific amino acids are important for this alcohol inhibition and potentiation (Mascia et al., 2000; Lobo et al., 2006; Crawford et al., 2007).
That EtOH potentiates glycinergic currents is well established, but the mechanisms by which this occurs remain poorly understood. We report on a series of studies we conducted on human α1 homomeric GlyR expressed in Xenopus laevis oocytes, investigating a variety of single-channel parameters for their sensitivities to modulation by intoxicating and anesthetizing concentrations of EtOH. We examined channel conductance, and open and closed dwell times, as well as a variety of channel burst properties, determining that EtOH exerts its enhancing effects primarily by increasing burst durations. Kinetic modeling suggests that these increases in burst duration arise due to an EtOH-induced antagonism of glycine unbinding.
Materials and Methods
Materials. All chemicals were obtained from Sigma-Aldrich (St. Louis, MO). We purchased X. laevis from Xenopus Express (Homosassa, FL).
Oocyte Isolation, cDNA Nuclear Injection, and Preparation for Patch Recording. Oocytes were surgically removed from X. laevis housed at 19°C on a 12-h light/dark cycle. Stage V and VI oocytes were manually isolated and placed in isolation media containing 108 mM NaCl, 1 mM EDTA, 2 mM KCl, and 10 mM HEPES, in which the thecal and epithelial layers were manually removed using forceps. A 10-min exposure to 0.5 mg/ml Sigma type 1A collagenase in buffer containing 83 mM NaCl, 2 mM MgCl2, and 5 mM HEPES was used to remove the follicular layer of oocytes. A 30-nl sample of the glycine α1 receptor subunit cDNA (1.5 ng/30 nl) in a modified pBK-cytomegalovirus vector (Mihic et al., 1997) was injected into the animal poles of oocytes by the “blind” method of Colman (1984), using a digital microdispenser loaded with a micropipette with a 10- to 15-μm tip size. Oocytes were stored in 96-well plates in the dark at 19°C in modified Barth's saline (MBS) [88 mM NaCl, 1 mM KCl, 2.4 mM NaHCO3, 10 mM HEPES, 0.82 mM MgSO4·7H2O, 0.33 mM Ca(NO3)2, and 0.91 mM CaCl2, pH 7.5] plus 2 mM sodium pyruvate, 0.5 mM theophylline, 10 U/ml penicillin, 10 mg/l streptomycin, and 50 mg/l gentamicin, sterilized by passage through a 0.22-μm filter. Oocytes expressed GlyR within 24 h, and all electrophysiological measurements were made within 5 days of cDNA injection. Before outside-out patches were pulled, the oocyte vitelline membrane was removed with forceps after placing the oocyte in a high-osmolarity solution containing 200 mM sodium methyl sulfate, 20 mM KCl, 10 mM HEPES, and 1 mM MgCl2. The oocyte was then transferred to a bath containing MBS for patches to be pulled.
Patch-Clamp Electrophysiology. Outside-out patches were held at -80 mV, and recordings were made according to standard methods (Hamill et al., 1981). Thick-walled borosilicate glass (WPI, Sarasota, FL) was pulled to form patch pipettes, which were then coated with Sylgard 184 (Dow Corning, Midland, MI) and fire-polished to obtain tip resistances of 8 to 15 MΩ. The pipette internal solution contained 88 mM CsCl, 10 mM HEPES, 0.82 mM MgSO4·7H2O, 10 mM EGTA, and 0.91 mM CaCl2, pH 7.4. Glycine and EtOH were prepared in MBS before being perfused over outside-out patches using an SF-77B Perfusion Fast Step apparatus (Warner Instruments, Hamden, CT).
Data Acquisition and Analysis. Single-channel data were acquired using an Axopatch 200B amplifier attached to a computer running pClamp version 9 software (Molecular Devices, Sunnyvale, CA). Data were digitized at 50 kHz, low-pass filtered at 7 kHz, and stored on a PC hard drive to be analyzed using the single-channel analysis programs in QuB (Qin et al., 2000a,b); version 1.4.0.125 was used for preprocessing, open/closed dwell-time analysis, burst duration analysis, and kinetic modeling. Tracings were first baseline-corrected, and bursts containing multiple openings (when present) were removed. The tracings were then idealized using the segmental-k-means algorithm (Qin et al., 2000a,b). Data were initially idealized with a simple two-state C↔O model. This initial idealization was then fit with multiple exponentials added sequentially to a star model (closed state as the center) using the maximum interval likelihood (MIL) method after imposing a dead time resolution of 60 μS. Once the appropriate numbers of open and closed components (determined by log likelihood) were present, the data were reidealized and used for dwell-time analyses. Dwell-time distributions were constructed and fit with a mixture of exponential components again using the MIL function, after the data had been binned using a log-time abscissa and a square-root count/total ordinate. Bursts of openings were defined as being separated by closed time durations equal to or greater than a critical time (τcrit) that separated groups of openings. For each patch a τcrit was determined such that an equal number of short and long closed time intervals were misclassified as falling inside and outside bursts (Magleby and Pallotta, 1983) according to the equation Amp1 × e-τcrit/τ1 = Amp2 × (1 - e-τcrit/τ2).
Once data were chopped into bursts, a new file containing only the idealized burst lengths was created and used for subsequent burst analyses. Burst durations were plotted like the dwell-time histograms described above and fit with multiple exponential components using the MIL function. Statistical analyses were performed using SigmaStat (SPSS Inc., Chicago, IL), using one- and two-way ANOVAs as well as Student's t test, as indicated.
Results
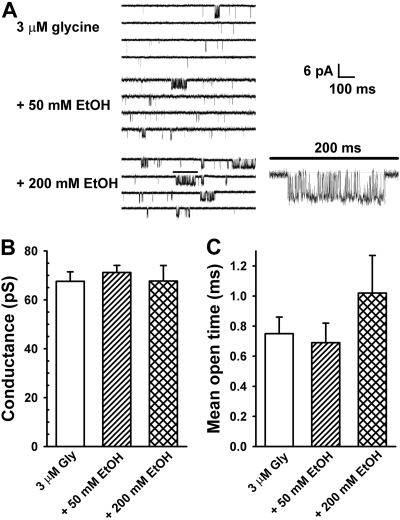
Conductance and Mean Open Time. We conducted a series of single-channel experiments on outside-out patches pulled from X. laevis oocytes expressing homomeric α1 GlyR. In these experiments, intoxicating (50 mM) and anesthetic (200 mM) concentrations of EtOH were applied with 3 μM glycine, and their effects on channel function were compared with those produced by 3 μM glycine applied alone. This low concentration of glycine was chosen to minimize the likelihood that multiple channels would open concurrently. Glycine applied on its own, or coapplied with EtOH, produces clearly defined channel opening events as shown in the sample tracings in Fig. 1A. The conductance observed in the presence of 3 μM glycine alone is 68 ± 4pS(n = 5), and this is not affected by coadministration of EtOH [F(2,13) = 0.13; p > 0.87] (Fig. 1B). A mean open time of 0.75 ± 0.11 ms (n = 5) is observed when 3 μM glycine is applied alone. Ethanol has no effects on the channel mean open time at a concentration of 50 mM and slightly, but not significantly, increases it at 200 mM [F(2,13) = 1.03; p > 0.39] (Fig. 1C).
Fig. 1.
A, representative tracings of single-channel homomeric α1 GlyR responses to 3 μM glycine (top), 3 μM glycine + 50 mM ethanol (middle), and 3 μM glycine + 200 mM ethanol (bottom). In the 200 mM ethanol tracing, the burst directly underneath the horizontal line is magnified to the right. B, ethanol does not affect GlyR conductance, which was approximately 70 pS for full openings under all experimental conditions. C, addition of ethanol does not significantly affect mean channel open time.
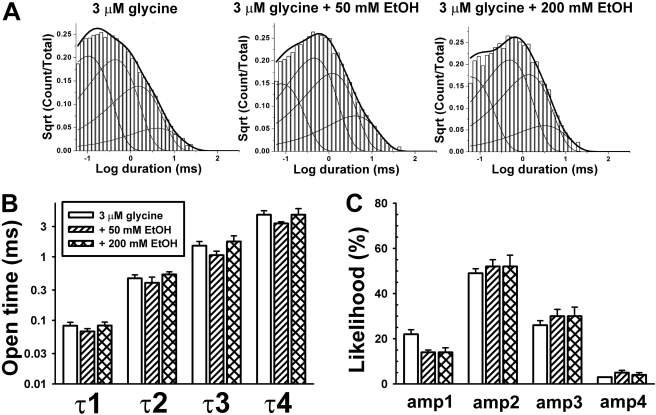
Open and Closed Dwell-Time Analyses. Open dwell-time data are adequately described using four exponential components. Sample open dwell-time histograms obtained from single patches, under all three experimental conditions, show the four separate components (τ values, thin lines) and overall fit (thick line) of the data in Fig. 2A. Although there are clear and expected differences in mean channel open lifetimes (τ values) among the four components [F(3,55) = 69; p < 0.001], EtOH does not significantly affect the average durations of open dwell times [F(2,55) = 2.16; p > 0.12] (Fig. 2B). Ethanol also does not significantly affect the likelihood of openings to the four components [F(2,55) = 0.005; p > 0.99] (Fig. 2C).
Fig. 2.
A, representative histograms demonstrating the fits for the open-dwell times. Each condition was fit using four open time components (τ values). The four thinner lines in each histogram describe the individual open dwell-time exponential functions, whereas the thicker line is a fit of all the data. B, addition of ethanol has no effect on open dwell times. C, ethanol does not affect the likelihood of opening to any particular open time component.
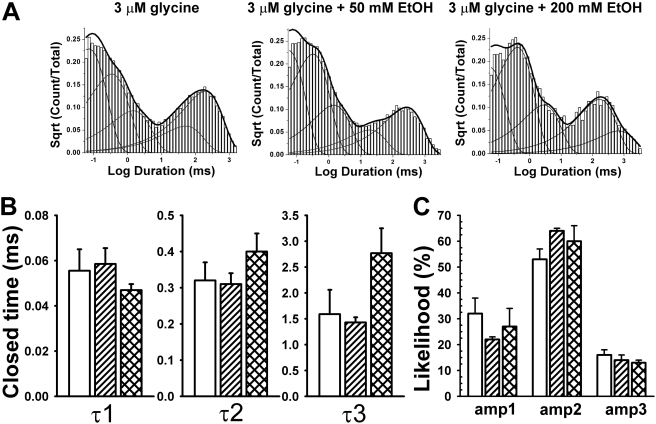
A clear temporal separation between the first three (shorter) components and the fourth and fifth (longest) components (Fig. 3A) is seen in the closed dwell-time sample histograms. Ethanol significantly affects the three shortest closed time durations [F(2,41) = 3.81; p < 0.033] (Fig. 3B) but does not affect the likelihood of observing the three shortest closed dwell times [F(2,41) = 0.52; p > 0.59] (Fig. 3C). In addition, a two-way ANOVA indicates an interaction between τ and ethanol [F(4,41) = 3.2; p < 0.025], reflecting an ethanol-induced increase primarily in τ3. The longest closed dwell-time components (τ4 and τ5) vary considerably from patch to patch (e.g., for glycine alone, τ4 = 109 ± 67 ms and τ5 = 642 ± 404 ms; n = 5), reflective of varying numbers of channels in each patch. Because of the greater interpatch variability of τ4 and τ5 compared with τ1 to 3, we believe that the first three time constants reflect closing events within bursts, whereas τ4 and τ5 describe interburst closing events.
Fig. 3.
A, representative histograms demonstrating the fits for the closed dwell times. Each condition was fit using five closed time components (τ values). τcrit was chosen individually for each file to minimize the area between the tails of the overlapping components, corresponding closely to the valley between closed durations 3 and 4. τ1, τ2, and τ3 are considered to represent intraburst closed durations, whereas τ4 and τ5 lie outside of bursts. B, closed time durations are increased by ethanol; the three intraburst closed times are illustrated for the glycine alone condition (hollow bars) and in the presence of 50 mM EtOH (diagonal bars) or 200 mM EtOH (cross-hatched bars). There was also a statistically significant interaction between τ and ethanol concentration. C, likelihoods of occurrence of each of the three shortest closed time components are not affected by ethanol. The likelihoods are expressed as a percentage of closings of only the first three shut time components.
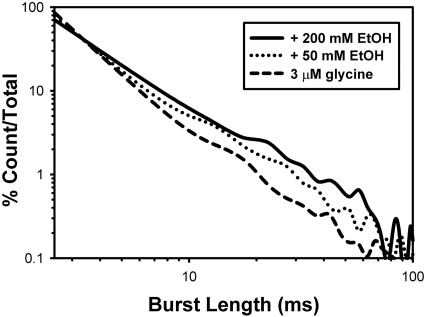
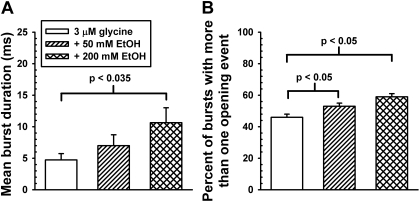
Burst Analyses. Closed dwell-time data were used in the selection of an appropriate τcrit to chop opening events into bursts. Figure 4 shows the results of combining burst data obtained from all patches (using τcrit values determined in each patch) and specifically that EtOH increases burst durations. On average, the τcrit values used were 4.6 ± 0.9 ms (n = 5) for the 3 μM glycine condition, 4.6 ± 0.3 ms (n = 5) for the 50 mM EtOH condition, and 6.9 ± 1.3 ms (n = 4) for the 200 mM EtOH condition. Longer lived bursts (>50 ms in duration) are rarely seen when 3 μM glycine is applied alone (1.5% bursts) but become more prevalent in the presence of 50 mM (3.1%) and 200 mM EtOH (4.9%) (Fig. 4). Burst data are summarized in Fig. 5A, showing that 200 mM EtOH significantly increases burst durations [t(7) = 2.7, p < 0.035] (Fig. 5B). Ethanol increases the percentages of bursts containing two or more opening events [F(2,13) = 11.1; p < 0.002], indicating that it favors the occurrence of opening events being grouped together rather than occurring singly (Fig. 5B).
Fig. 4.
Ethanol increases the durations of bursts. Bursts lengths were combined from all patches for each experimental condition, binned, and counted, and those counts were normalized to generate the numbers on the ordinate. Burst lengths greater than 50 ms are more frequent in the presence of either 50 or 200 mM ethanol. The abscissa represents burst length, whereas the ordinate represents the percentage of bursts seen at each duration. For example, 86% of bursts were between 0 and 5 ms in duration in the glycine alone condition.
Fig. 5.
A, ethanol increases mean burst duration. Mean burst duration increases from 4.7 ms in the presence of 3 μM glycine applied alone to 7.0 ms in the presence of glycine plus 50 mM ethanol and to 10.6 ms when 200 mM ethanol is coapplied. B, ethanol increases the percentage of bursts consisting of multiple opening events. In the presence of glycine alone, 54% bursts consisted of single opening events, whereas 46% consisted of multiple opening events. In the presence of ethanol, more than half of bursts displayed multiple openings.
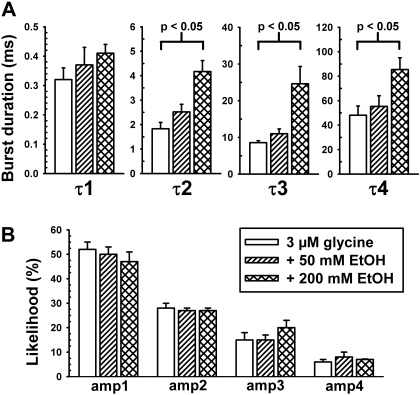
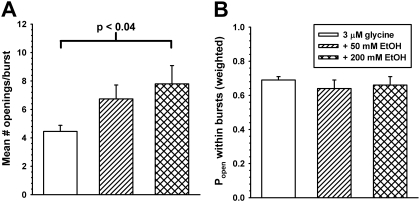
The burst length distributions from every patch in each condition can be described by four exponential functions as summarized in Fig. 6. Ethanol has no enhancing effects on the shortest burst duration (τ1). This is not surprising because these largely consist of single opening events that we showed previously to be insensitive to EtOH. Ethanol increases the durations of longer bursts [F(2,54) = 8.51; p < 0.001] (Figs. 4 and 6A) without affecting the likelihood of entering any particular burst states [F(2,54) = 0.05; p > 0.95] (Fig. 6B). This increase in burst duration is accompanied by an increased number of openings per burst in the presence of EtOH (Fig. 7A) [t(7) = 2.71, p < 0.035 comparing 0 and 200 mM EtOH]. However, the weighted probability of opening within bursts (Popen) is not significantly affected [F(2,13) = 0.4; p > 0.68] by EtOH (Fig. 7B). The weighted Popen is determined by dividing total open time in a patch by the sum of burst lengths.
Fig. 6.
A, ethanol increases burst durations by increasing burst time constants. Ethanol seems to act primarily by increasing the durations of the longer lived burst states (τ2–τ4). B, percentage of likelihood of entering any particular burst state is unchanged by EtOH.
Fig. 7.
A, mean number of opening events per burst was obtained for each patch by dividing the number of opening events by the number of bursts. EtOH at a concentration of 200 mM significantly increases the number of openings per burst. B, ethanol does not affect intraburst Popen. The weighted average of the probability of the channel being found in the open state during a burst was determined by dividing the total open time by the total burst duration for each patch. That this parameter of channel function was not changed in the presence of ethanol suggests that ethanol does not markedly affect intraburst properties as was expected due to the minor effects of ethanol on open and closed dwell times.
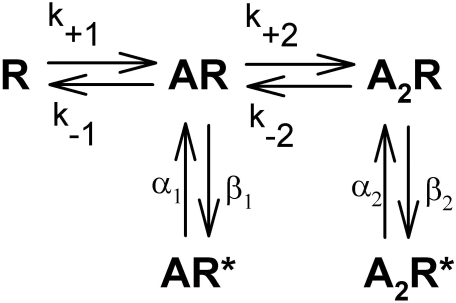
Kinetic Modeling and Simulation. To provide a mechanistic understanding of our results, modeling was done using QuB with a kinetic scheme (Scheme 1) similar to that proposed in Beato et al. (2004).
Scheme 1.
Kinetic scheme illustrating glycine receptor activation after the binding of one or two glycine molecules.
In this model, R represents the GlyR in the closed channel state with no glycine molecules bound. AR represents the GlyR with a single glycine molecule bound, whereas A2R represents the receptor after binding two glycine molecules. AR* and A2R* are open channel states, and k, α, and β represent transition rates between states as indicated by arrows in the kinetic model shown in Scheme 1. The rates of entry into, and departure from, bursts are described by k+1 and k-1, respectively. The other rates describe intraburst transitions. Beato et al. (2002) showed that at low concentrations of glycine (∼1 μM), the occupancy of a triliganded GlyR was less than 5%, and in agreement with these findings, most of our patches could not be fit to a model containing a triliganded state. Once each patch was individually fit to the model shown above, all the rates were identified for each patch, and these are summarized in Table 1. One-way ANOVA was used to test for significant effects of alcohol on each rate, and only in the case of k-1 was a significant effect found [F(2,13) = 4.26; p < 0.045]. The 200 mM ethanol condition k-1 rate was significantly lower than that of the glycine control. The 50 mM ethanol condition k-1 value, which fell between those of the other two conditions, did not differ significantly from either. The rates of the binding and unbinding of the second glycine molecule, as described by K2 values, were not affected by ethanol [F(2,13) = 1.22; p > 0.33] nor were the two efficacies of opening [E1, F(2,13) = 0.45; p > 0.6; E2, F(2,13) = 0.23; p > 0.79]. We next conducted simulations to determine whether changes in k-1 are sufficient to account for the altered GlyR responses in the presence of ethanol. As starting values, this model used the average rates shown in Table 1 for the 3 μM glycine alone condition. The resulting simulation quite accurately reproduced data matching the measured 3 μM glycine control condition in both mean open time (0.75 ms actual versus 0.66 ms simulated) and mean burst duration (4.7 ms actual versus 4.0 ms simulated). The simulation was then re-run with only the k-1 rate decreased 2.33-fold, from 770 s-1 in the 3 μM glycine simulation to 330 s-1 in the glycine + 200 mM EtOH simulation, in accordance with our observed data (Table 1). This change in k-1 did not affect mean open time (0.64 ms), yet it markedly increased the mean burst duration (to 8.3 ms). The increase in simulated burst duration from 4.0 to 8.3 ms (a 108% increase) is almost identical to the increase we observed in the presence of 200 mM ethanol (4.7 to 10.6 ms, a 124% increase). Changing other rates, such as those governing the transitions between the monoliganded and diliganded closed states (k+2 and k-2) or those between closed and open channel states either produced minimal effects on burst durations and/or markedly affected lifetimes or likelihoods of entering particular open states, which ethanol does not do to a significant extent.
TABLE 1.
Fit of single-channel data to a mechanistic scheme Rates were obtained for a reasonable kinetic model consisting of three closed states and two open states as described under Results. The k+1 and k+2 rate constants are described in units of molar–1 second–1, whereas the k–1, k–2, and α and β rates are expressed in units of seconds–1. These rates were calculated separately for each patch, and the mean ± S.E.M. of four to five patches is provided. The coefficient of variation was determined by dividing the S.D. for each experimental condition by the mean and expressing that value as a percentage. The K2 value was determined by averaging the k–2/k+2 rates of individual patches. K1 was not determined (N.D.) because the k+1 values, which describe rates of departure from long-lived closed states into burst states, vary with the number of channels per patch (Beato et al., 2002). E1 and E2 are agonist efficacy values obtained from β/α.
| Condition (n) | Rate | Mean ± S.E.M. | Coefficient of Variation | |
|---|---|---|---|---|
| % | ||||
| 3 μM glycine (n = 5) | k+1 | 6.5 × 10⁶ ± 3.7 × 10⁶ | 127 | N.D. |
| k–1 | 767 ± 115 | 34 | ||
| k+2 | 4.8 × 10⁷ ± 8.4 × 10⁶ | 39 | K2 = 1.5 × 10⁻⁵ | |
| k–2 | 752 ± 160 | 48 | ||
| α1 | 4691 ± 801 | 38 | E1 = 0.28 | |
| β1 | 1153 ± 322 | 62 | ||
| α2 | 1207 ± 190 | 35 | E2 = 5.6 | |
| β2 | 6034 ± 277 | 10 | ||
| 3 μM glycine + 50 mM EtOH (n = 5) | k+1 | 2.7 × 10⁶ ± 1.5 × 10⁶ | 126 | N.D. |
| k–1 | 540 ± 118 | 49 | ||
| k+2 | 4.5 × 10⁷ ± 6.9 × 10⁶ | 34 | K2 = 1.3 × 10⁻⁵ | |
| k–2 | 562 ± 89 | 35 | ||
| α1 | 4650 ± 692 | 33 | E1 = 0.31 | |
| β1 | 1295 ± 85 | 15 | ||
| α2 | 1527 ± 204 | 30 | E2 = 4.9 | |
| β2 | 6721 ± 393 | 13 | ||
| 3 μM glycine + 200 mM EtOH (n = 4) | k+1 | 2.5 × 10⁶ ± 1.2 × 10⁶ | 93 | N.D. |
| k–1 | 329 ± 29 | 18 | ||
| k+2 | 5.4 × 10⁷ ± 1.5 × 10⁷ | 57 | K2 = 1.2 × 10⁻⁵ | |
| k–2 | 620 ± 177 | 57 | ||
| α1 | 3258 ± 273 | 17 | E1 = 0.22 | |
| β1 | 740 ± 145 | 39 | ||
| α2 | 1058 ± 149 | 28 | E2 = 6.4 | |
| β2 | 5957 ± 54 | 54 |
Discussion
Ethanol produces a variety of behavioral effects depending on the blood ethanol concentration (BEC). We defined 50 mM EtOH (235 mg/dl) as intoxicating and 200 mM EtOH as anesthetizing. C57BL/6J mice recover from the hypnotic effects of ethanol at a BEC of 370 mg/dl (Sharko and Hodge, 2008), and mice are able to remain on a Rotorod at a BEC of 207 mg/dl (Deitrich et al., 2000). Furthermore, binge-drinking college students celebrating their 21st birthdays achieve BECs averaging 220 mg/dl (R. R. Wetherill and K. Fromme, submitted for publication). The anesthetizing brain concentrations of ethanol in Sprague-Dawley rats were assessed by failure to respond to a painful tail pinch and were found to be 151 mM in adults and 282 mM in 6- to 7-day-old animals (Fang et al., 1997).
Enhancement of GlyR function is consistent with the actions of EtOH observed in vivo. Ethanol-induced loss of righting reflex in mice is augmented by the intracerebroventricular administration of glycine (Williams et al., 1995). The hypnotic effects of EtOH are altered in “spastic” and “spasmodic” mice bearing dysfunctional GlyR (Quinlan et al., 2002). Furthermore, studies using knock-in mice bearing a point mutation at amino acid serine-267, rendering the receptors less sensitive to EtOH, support the hypothesis that GlyRs are important targets for the motor-incoordinating and anesthetic properties of EtOH (Findlay et al., 2002). Perhaps most interesting and relevant to alcoholism is the evidence that GlyR in the nucleus accumbens play a role in the voluntary drinking of EtOH. Microdialysis of glycine into the nucleus accumbens increases extracellular accumbal dopamine levels and is accompanied by a decrease in EtOH consumption by alcohol-preferring Wistar rats; in contrast, strychnine has the opposite effects (Molander et al., 2005). Strychnine, applied via microdialysis, also prevents increases of accumbal dopamine levels after either local or systemic alcohol administration (Molander and Söderpalm, 2005). In line with these findings, the glycine reuptake inhibitor Org 25935 decreases EtOH but not water intake, as well as EtOH preference (Molander et al., 2007).
Ethanol enhances GlyR function only at low glycine concentrations, decreasing the glycine EC50 value, with no effect on maximal glycinergic currents (Aguayo et al., 1996). Mascia et al. (1996b) demonstrated EtOH enhancement of the function of GlyR of defined composition expressed in X. laevis oocytes. Concentrations as low as 10 mM EtOH were effective, especially when lower concentrations of glycine were tested. At the molecular level, investigations into the actions of ethanol on native α1β GlyRs in excised patches from rat hypoglossal motoneurons revealed that 100 mM EtOH increased the numbers of open channels without affecting channel conductance (Eggers and Berger, 2004). EtOH decreases the glycinergic response rise time, as well as increasing the current decay time. Eggers and Berger (2004) concluded that EtOH acts to increase glycine affinity by enhancing glycine association with the GlyR (kon) as well as antagonizing dissociation (koff).
We compared our findings with those reported by Beato et al. (2002), who also performed outside-out patch single-channel analysis of α1 homomeric GlyR but expressed in human embryonic kidney 293 cells instead of X. laevis oocytes. Like the data of Beato et al. (2002), our data were free-fit with four open components and three intraburst shut components, and the τ and likelihood values we report are similar to theirs. Also in common are the four burst components both studies found. In addition, our mean burst duration seen in the presence of 3 μM glycine (4.7 ms) was between the values reported by Beato et al. (2002) for 1 and 10 μM glycine (2.5 and 7.1 ms, respectively). They chopped their data into bursts using τcrit values of 4.6 ms for 1 μM glycine and 5.8 ms for 10 μM glycine; in comparison, the τcrit value we used for chopping 3 μM glycine data averaged 4.6 ms.
In our study, we determined that the primary effect of EtOH on GlyR function seems to be its enhancement of burst durations. Longer bursts (τ values) are seen in the presence of EtOH, thus resulting in an increased incidence of longer bursts (e.g., >50 ms). A reasonable kinetic scheme for the activation of GlyR such as that proposed by Beato et al. (2004), and shown here under Results, can be useful to illustrate how we believe EtOH is acting to enhance GlyR function. In this scheme, a total of eight rates (k, α, and β) are used to describe transitions between states. The results we obtained using this model are in agreement with those made by others previously as well as showing consistency with expectations. For example, the open lifetimes (1/α) of receptors in the monoliganded state are shorter than in the diliganded state (213 versus 829 μs in the 3 μM glycine condition) and quite similar to those shown by Beato et al. (2004), who found the two shortest channel open times to be 256 and 794 μs in duration using a model similar to ours. In addition, efficacy (E1 versus E2) increases with ligation, a feature common to ligand-gated ion channels. Both our results and those of Beato et al. (2004) indicate that the efficacy increase from monoliganded to diliganded receptors (E2/E1) is 20.
One can use a mechanistic model such as this to ask which rates might be changed by EtOH to explain our findings. Open dwell times are determined solely by α. Because we saw no significant effects of EtOH on open dwell times (Fig. 2B), it is not exerting its effects via α. Changing β could affect burst durations but would also be expected to affect open and closed state likelihoods, which we did not see (Figs. 2C and 3C). An ethanol-induced increase in k+2 or decrease in k-2 could increase the mean burst durations; however this would be accompanied by marked changes in the likelihood of entering the open states, which EtOH does not produce. Our data suggest that EtOH enhances burst durations (Figs. 4 and 5A) by increasing the numbers of openings per burst (Fig. 7A) but without affecting Popen within bursts (Fig. 7B). Thus, bursts seem qualitatively unchanged in the presence of EtOH except that they are longer, and the increased number of openings per burst in the presence of EtOH reflects that. The k+1 and k-1 rate constants govern the rates of entering and leaving burst states, respectively. Increasing k+1 would be expected to have no effects on either mean open time or mean burst duration, although it would decrease extraburst closed times, i.e., increasing k+1 would increase the number of bursts seen per unit time. However, decreasing k-1 would increase burst durations by retarding the termination of bursts. In addition, changing k-1 would not affect open and closed lifetimes and durations, except perhaps increasing the lifetime of the AR closed state, assuming all other rates from AR remain unaffected. Interestingly, we observed that EtOH increased the longest lived intraburst closed time (Fig,. 3B), consistent with this interpretation.
EtOH seems to slightly, but not significantly, increase mean open time at a concentration of 200 mM. Changes in the k-1 rate are unable to explain this minor effect of EtOH, and fairly small changes of one or more of the other rates must be responsible for these effects. Our findings thus seem to be at odds with the molecular dynamics simulation performed by Cheng et al. (2008), who concluded that EtOH stabilizes open channel states of the GlyR. In contrast, our data suggest that EtOH, at intoxicating concentrations at least, does not stabilize the open state of the receptor at all. Furthermore, we saw minimal effects of either concentration of ethanol on efficacy (β/α) in our study.
No single mechanism can explain how allosteric modulators affect channel function. For example, barbiturates and neurosteroids enhance GABAA receptor function primarily by increasing the mean channel open time; thus, they act to stabilize an open state of the receptor (Steinbach and Akk, 2001; Akk et al., 2008). Zinc is a positive modulator of GlyR function at low micromolar concentrations. Single-channel studies of zinc effects on the GlyR show many similarities to how EtOH acts: an enhancement of burst durations and individual burst τ values and an increase in the numbers of opening events per burst, but no effects on mean channel open times and no effects on conductance (Laube et al., 2000). In addition, it was concluded that zinc enhances GlyR function primarily by antagonizing glycine dissociation.
In summary, we have determined that EtOH exerts its enhancing effects on GlyR function primarily by increasing burst durations. It does not seem to significantly stabilize open states, nor does it affect conductance. The primary mechanism of alcohol action seems to be its antagonism of glycine unbinding from the GlyR. This would have the effect of prolonging the duration of GlyR activation at the synapse, and this is consistent with ethanol producing leftward shifts of glycine concentration-response curves. The effect of ethanol on select parameters of channel function is similar to the specificity exhibited by other modulators such as zinc (Laube et al., 2000) or neurosteroids (Akk et al., 2008) that interact with receptors at defined binding sites.
Supplementary Material
Acknowledgments
We thank Drs. Adron Harris, Rick Aldrich, and Weiyan Li, as well as Anthony Auerbach and the members of his laboratory, for many helpful discussions.
This work was supported by the National Institutes of Health National Institute on Alcohol Abuse and Alcoholism [Grants R01-AA11525, T32-AA007471]; and by a Bruce/Jones Predoctoral Fellowship.
Article, publication date, and citation information can be found at http://jpet.aspetjournals.org.
doi:10.1124/jpet.109.154344.
ABBREVIATIONS: GlyR, glycine receptor; TM, transmembrane; EtOH, ethanol; MBS, modified Barth's saline; MIL, maximal interval likelihood; ANOVA, analysis of variance; Popen, probability of channel being open; AR, GlyR with a single glycine molecule bound; BEC, blood ethanol concentration; Org 25935, cis-N-methyl-N-(6-methoxy-1-phenyl-1,2,3,4-tetrahydronaphthalen-2-yl methyl)amino methylcarboxylic acid.
References
- Aguayo LG and Pancetti FC (1994) Ethanol modulation of the γ-aminobutyric acidA- and glycine-activated Cl- current in cultured mouse neurons. J Pharmacol Exp Ther 270 61-69. [PubMed] [Google Scholar]
- Aguayo LG, Tapia JC, and Pancetti FC (1996) Potentiation of the glycine-activated Cl- current by ethanol in cultured mouse spinal neurons. J Pharmacol Exp Ther 279 1116-1122. [PubMed] [Google Scholar]
- Akk G, Li P, Bracamontes J, Reichert DE, Covey DF, and Steinbach JH (2008) Mutations of the GABAA receptor α1 subunit M1 domain reveal unexpected complexity for modulation by neuroactive steroids. Mol Pharmacol 74 614-627. [DOI] [PMC free article] [PubMed] [Google Scholar]
- Beato M, Groot-Kormelink PJ, Colquhoun D, and Sivilotti LG (2002) Openings of the rat recombinant α1 homomeric glycine receptor as a function of the number of agonist molecules bound. J Gen Physiol 119 443-466. [DOI] [PMC free article] [PubMed] [Google Scholar]
- Beato M, Groot-Kormelink PJ, Colquhoun D, and Sivilotti LG (2004) The activation mechanism of α1 homomeric glycine receptors. J Neurosci 24 895-906. [DOI] [PMC free article] [PubMed] [Google Scholar]
- Betz H (1991) Glycine receptors: heterogeneous and widespread in the mammalian brain. Trends Neurosci 14 458-461. [DOI] [PubMed] [Google Scholar]
- Celentano JJ, Gibbs TT, and Farb DH (1988) Ethanol potentiates GABA and glycine induced currents in chick spinal cord neurons. Brain Res 455 377-380. [DOI] [PubMed] [Google Scholar]
- Colman A (1984) Expression of exogenous DNA in Xenopus oocytes, in Transcription and Translation: A Practical Approach (Hames BD and Higgins SJ eds), pp 49-69, Oxford Press, Washington, DC.
- Cheng MH, Coalson RD, and Cascio M (2008) Molecular dynamics simulations of ethanol binding to the transmembrane domain of the glycine receptor: implications for the channel potentiation mechanism. Proteins 71 972-981. [DOI] [PubMed] [Google Scholar]
- Crawford DK, Trudell JR, Bertaccini EJ, Li K, Davies DL, and Alkana RL (2007) Evidence that ethanol acts on a target in Loop 2 of the extracellular domain of α1 glycine receptors. J Neurochem 102 2097-2109. [DOI] [PubMed] [Google Scholar]
- Deitrich RA, Bludeau P, and Erwin VG (2000) Phenotypic and genotypic relationships between ethanol tolerance and sensitivity in mice selectively bred for initial sensitivity to ethanol (SS and LS) or development of acute tolerance (HAFT and LAFT). Alcohol Clin Exp Res 24 594-604. [PubMed] [Google Scholar]
- Eggers ED and Berger AJ (2004) Mechanisms for the modulation of native glycine receptor channels by ethanol. J Neurophysiol 91 2685-2695. [DOI] [PubMed] [Google Scholar]
- Engblom AC and Akerman KE (1991) Effect of ethanol on γ-aminobutyric acid and glycine receptor-coupled fluxes in rat brain synaptoneurosomes. J Neurochem 57 384-390. [DOI] [PubMed] [Google Scholar]
- Fang Z, Gong D, Ionescu P, Laster MJ, Eger EI 2nd, and Kendig J (1997) Maturation decreases ethanol minimum alveolar anesthetic concentration (MAC) more than desflurane MAC in rats. Anesth Analg 84 852-858. [DOI] [PubMed] [Google Scholar]
- Findlay GS, Wick MJ, Mascia MP, Wallace D, Miller GW, Harris RA, and Blednov YA (2002) Transgenic expression of a mutant glycine receptor decreases alcohol sensitivity of mice. J Pharmacol Exp Ther 300 526-534. [DOI] [PubMed] [Google Scholar]
- Hamill OP, Marty A, Neher E, Sakmann B, and Sigworth FJ (1981) Improved patch-clamp techniques for high-resolution current recording from cells and cell-free membrane patches. Pflugers Arch 391 85-100. [DOI] [PubMed] [Google Scholar]
- Laube B, Kuhse J, and Betz H (2000) Kinetic and mutational analysis of Zn2+ modulation of recombinant human inhibitory glycine receptors. J Physiol 522 215-230. [DOI] [PMC free article] [PubMed] [Google Scholar]
- Lobo IA, Mascia MP, Trudell JR, and Harris RA (2004) Channel gating of the glycine receptor changes accessibility to residues implicated in receptor potentiation by alcohols and anesthetics. J Biol Chem 279 33919-33927. [DOI] [PubMed] [Google Scholar]
- Lobo IA, Trudell JR, and Harris RA (2006) Accessibility to residues in transmembrane segment four of the glycine receptor. Neuropharmacology 50 174-181. [DOI] [PubMed] [Google Scholar]
- Lobo IA, Harris RA, and Trudell JR (2008) Cross-linking of sites involved with alcohol action between transmembrane segments 1 and 3 of the glycine receptor following activation. J Neurochem 104 1649-1662. [DOI] [PMC free article] [PubMed] [Google Scholar]
- Lynch JW (2004) Molecular structure and function of the glycine receptor chloride channel. Physiol Rev 84 1051-1095. [DOI] [PubMed] [Google Scholar]
- Magleby KL and Pallotta BS (1983) Burst kinetics of single calcium-activated potassium channels in cultured rat muscle. J Physiol 344 605-623. [DOI] [PMC free article] [PubMed] [Google Scholar]
- Mascia MP, Machu TK, and Harris RA (1996a) Enhancement of homomeric glycine receptor function by long-chain alcohols and anaesthetics. Br J Pharmacol 119 1331-1336. [DOI] [PMC free article] [PubMed] [Google Scholar]
- Mascia MP, Mihic SJ, Valenzuela CF, Schofield PR, and Harris RA (1996b) A single amino acid determines differences in ethanol actions on strychnine-sensitive glycine receptors. Mol Pharmacol 50 402-406. [PubMed] [Google Scholar]
- Mascia MP, Trudell JR, and Harris RA (2000) Specific binding sites for alcohols and anesthetics on ligand-gated ion channels. Proc Natl Acad Sci U S A 97 9305-9310. [DOI] [PMC free article] [PubMed] [Google Scholar]
- Mihic SJ, Ye Q, Wick MJ, Koltchine VV, Krasowski MD, Finn SE, Mascia MP, Valenzuela CF, Hanson KK, Greenblatt EP, et al. (1997) Sites of alcohol and volatile anaesthetic action on GABAA and glycine receptors. Nature 389 385-389. [DOI] [PubMed] [Google Scholar]
- Molander A and Söderpalm B (2005) Accumbal strychnine-sensitive glycine receptors: an access point for ethanol to the brain reward system. Alcohol Clin Exp Res 29 27-37. [DOI] [PubMed] [Google Scholar]
- Molander A, Löf E, Stomberg R, Ericson M, and Söderpalm B (2005) Involvement of accumbal glycine receptors in the regulation of voluntary ethanol intake in the rat. Alcohol Clin Exp Res 29 38-45. [DOI] [PubMed] [Google Scholar]
- Molander A, Lidö HH, Löf E, Ericson M, and Söderpalm B (2007) The glycine reuptake inhibitor Org 25935 decreases ethanol intake and preference in male Wistar rats. Alcohol Alcohol 42 11-18. [DOI] [PubMed] [Google Scholar]
- Qin F, Auerbach A, and Sachs F (2000a) A direct optimization approach to hidden Markov modeling for single channel kinetics. Biophys J 79 1915-1927. [DOI] [PMC free article] [PubMed] [Google Scholar]
- Qin F, Auerbach A, and Sachs F (2000b) Hidden Markov modeling for single channel kinetics with filtering and correlated noise. Biophys J 79 1928-1944. [DOI] [PMC free article] [PubMed] [Google Scholar]
- Quinlan JJ, Ferguson C, Jester K, Firestone LL, and Homanics GE (2002) Mice with glycine receptor subunit mutations are both sensitive and resistant to volatile anesthetics. Anesth Analg 95 578-582, table of contents. [DOI] [PubMed] [Google Scholar]
- Rajendra S and Schofield PR (1995) Molecular mechanism of inherited startle disorders. Trends Neurosci 18 80-82. [PubMed] [Google Scholar]
- Sharko AC and Hodge CW (2008) Differential modulation of ethanol-induced sedation and hypnosis by metabotropic glutamate receptor antagonists in C57BL/6J mice. Alcohol Clin Exp Res 32 67-76. [DOI] [PMC free article] [PubMed] [Google Scholar]
- Steinbach JH and Akk G (2001) Modulation of GABAA receptor channel gating by pentobarbital. J Physiol 537 715-733. [DOI] [PMC free article] [PubMed] [Google Scholar]
- Tapia JC, Aguilar LF, Sotomayor CP, and Aguayo LG (1998) Ethanol affects the function of a neurotransmitter receptor protein without altering the membrane lipid phase. Eur J Pharmacol 354 239-244. [DOI] [PubMed] [Google Scholar]
- Wick MJ, Mihic SJ, Ueno S, Mascia MP, Trudell JR, Brozowski SJ, Ye Q, Harrison NL, and Harris RA (1998) Mutations of gamma-aminobutyric acid and glycine receptors change alcohol cutoff: evidence for an alcohol receptor? Proc Natl Acad Sci U S A 95 6504-6509. [DOI] [PMC free article] [PubMed] [Google Scholar]
- Williams KL, Ferko AP, Barbieri EJ, and DiGregorio GJ (1995) Glycine enhances the central depressant properties of ethanol in mice. Pharmacol Biochem Behav 50 199-205. [DOI] [PubMed] [Google Scholar]
- Ye JH, Tao L, Ren J, Schaefer R, Krnjevic K, Liu PL, Schiller DA, and McArdle JJ (2001) Ethanol potentiation of glycine-induced responses in dissociated neurons of rat ventral tegmental area. J Pharmacol Exp Ther 296 77-83. [PubMed] [Google Scholar]
Associated Data
This section collects any data citations, data availability statements, or supplementary materials included in this article.


