Abstract
The gene GAD2 encoding the glutamic acid decarboxylase enzyme (GAD65) is a positional candidate gene for obesity on Chromosome 10p11–12, a susceptibility locus for morbid obesity in four independent ethnic populations. GAD65 catalyzes the formation of γ-aminobutyric acid (GABA), which interacts with neuropeptide Y in the paraventricular nucleus to contribute to stimulate food intake. A case-control study (575 morbidly obese and 646 control subjects) analyzing GAD2 variants identified both a protective haplotype, including the most frequent alleles of single nucleotide polymorphisms (SNPs) +61450 C>A and +83897 T>A (OR = 0.81, 95% CI [0.681–0.972], p = 0.0049) and an at-risk SNP (−243 A>G) for morbid obesity (OR = 1.3, 95% CI [1.053–1.585], p = 0.014). Furthermore, familial-based analyses confirmed the association with the obesity of SNP +61450 C>A and +83897 T>A haplotype (χ2 = 7.637, p = 0.02). In the murine insulinoma cell line βTC3, the G at-risk allele of SNP −243 A>G increased six times GAD2 promoter activity (p < 0.0001) and induced a 6-fold higher affinity for nuclear extracts. The −243 A>G SNP was associated with higher hunger scores (p = 0.007) and disinhibition scores (p = 0.028), as assessed by the Stunkard Three-Factor Eating Questionnaire. As GAD2 is highly expressed in pancreatic β cells, we analyzed GAD65 antibody level as a marker of β-cell activity and of insulin secretion. In the control group, −243 A>G, +61450 C>A, and +83897 T>A SNPs were associated with lower GAD65 autoantibody levels (p values of 0.003, 0.047, and 0.006, respectively). SNP +83897 T>A was associated with lower fasting insulin and insulin secretion, as assessed by the HOMA-B% homeostasis model of β-cell function (p = 0.009 and 0.01, respectively). These data support the hypothesis of the orexigenic effect of GABA in humans and of a contribution of genes involved in GABA metabolism in the modulation of food intake and in the development of morbid obesity.
A large case-control study, family-based genetic analyses, and functional data suggest that variation in the GAD2 gene affects eating behavior and insulin metabolism
Introduction
The strong evidence for a genetic component to human obesity has been unequivocally established over the past years with the identification of the genetic defects responsible for different monogenic forms, being involved in 4% of cases of human obesity (Clement et al. 2002). However, the role of genetic factors in common obesity is complex, being determined by the interaction of several genes (polygenic), each of which may have relatively small effects (i.e., they are susceptibility genes) and which may work in combination with each other as well as with environmental factors (e.g., nutrient intake and physical activity). The examination of candidate genes for involvement in the susceptibility to common obesity has not yet yielded convincing results (Chagnon et al. 2003). Another approach used for identifying genes underlying common polygenic obesity utilizes genome-wide scans in order to detect chromosomal regions showing linkage with obesity in large collections of nuclear families. The power of this approach was proven in other complex traits (Horikawa et al. 2000; Gretarsdottir et al. 2003). A genome-wide scan performed in 158 multiplex French obese Caucasian families (514 individuals) having at least one subject with a body mass index (BMI) of greater than 40 kg/m2 and at least one further sibling with a BMI of greater than 27 kg/m2 reported significant evidence for linkage of obesity to a Chromosome 10p locus (Hager et al. 1998), with a maximal logarithm of odds (LOD) score (MLS) near the D10S197 marker. Replication studies in both European-American and African-American cohorts confirmed the maximum nonparametric linkage peak at D10S197 for the combined sample set (Price et al. 2001) as well as for a German young obese sib cohort (Saar et al. 2003). All together, these independent linkage studies strengthen the hypothesis of a susceptibility gene for obesity in the Chromosome 10p11–12 locus. Marker D10S197 is located in intron 7 of the GAD2 gene encoding the glutamic acid decarboxylase enzyme (GAD65). GAD65 catalyzes the formation of γ-aminobutyric acid (GABA) from L-glutamic acid and is expressed in both pancreatic islets and brain (Erdo and Wolff 1990). GABA is colocalized in neuropeptide Y (NPY) neurons and is involved in the leptin pathway through the arcuate nucleus in the hypothalamus (Ovesjo et al. 2001). GABA interacts with NPY in the paraventricular nucleus to stimulate food intake (Pu et al. 1999). The bilateral injection of GAD2 antisense oligodeoxynucleotide into rat ventromedial hypothalamus decreased the content of GABA by 50% 24 h after the injection, decreasing food intake, while also enhancing locomotor activity (Bannai et al. 1998).
We here report genetic and functional arguments in favor of the GAD2 gene as a positional candidate gene for obesity on the Chromosome 10p locus.
Results
Fine Mapping of the Chromosome 10p Locus
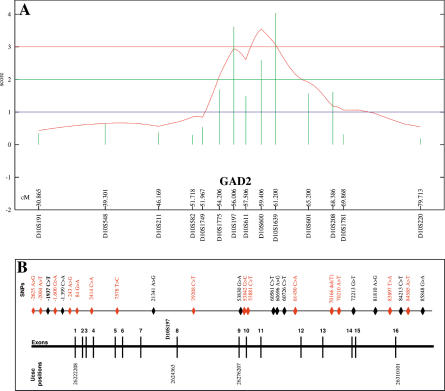
In order to cover the Chromosome 10p linkage region with obesity at a density of one marker every centimorgan, 16 polymorphic markers between D10S191 and D10S220 were further genotyped in 188 nuclear families comprising 620 individuals. Single-point analyses showed a cluster of markers with an MLS higher than 1. D10S1639, D10S197, and D10S600 markers displayed an MLS of 3.4, 3.3, and 2.54, respectively (Figure 1A). Multipoint analysis revealed two peaks, at the D10S197 (MLS = 3.2) and D10S600 (MLS = 3.4) markers, respectively. As D10S197 is located in intron 7 of the GAD2 gene, we sought association of alleles or group of alleles of this marker with obesity. Allele frequencies were compared between obese and control subjects. Empirical p value for the normal statistics was 0.0017 and for the lumped allele (Lall) statistics was 0.01, respectively (data not shown), suggesting that a functional single nucleotide polymorphism (SNP) in partial linkage disequilibrium (LD) with the D10S197 marker may be located nearby.
Figure 1. Mapping of Chromosome 10p and the GAD2 Gene.
(A) Fine mapping of the Chromosome 10p locus between markers D10S548 and D10S220 in 188 nuclear families (620 individuals). Multipoint analysis for obesity phenotype.
(B) SNP map of the GAD2 gene. Positions were assigned according the location to the A of the ATG. The 15 SNPs selected for association studies are indicated in red. See also Table 1.
GAD2 Gene: SNP Map and Association Studies with Obesity
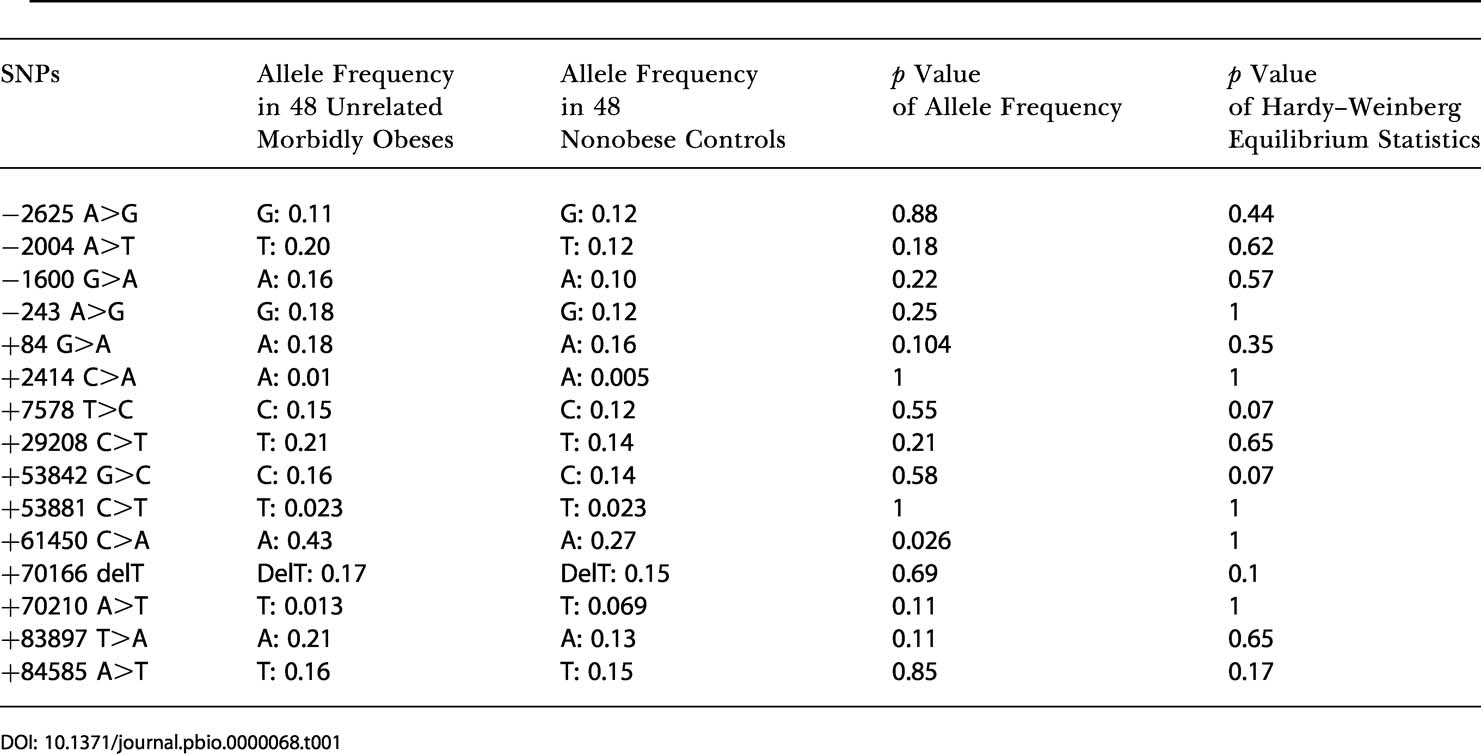
GAD2 coding sequences (introns and exons) 3 kb upstream from the 5′ untranslated region (UTR) and 3 kb downstream from the 3′ UTR were screened for mutations in 24 obese patients from families showing evidence of linkage at the Chromosome 10p locus and in 24 nonobese subjects. In addition, we genotyped previously reported SNPs (Johnson et al. 2002) and those from public databases. On the basis of their frequency and location in a coding or a putative regulating region, 15 SNPs (Figure 1B; Table 1) were then selected for association studies. As families from the genome-wide scan were recruited through a proband with a BMI greater than 40 kg/m2, we postulated that the Chromosome 10p putative susceptibility gene may be primarily associated with morbid obesity, which represents less than 1% of the adult population in France (Charles et al. 2002). Thus, 15 SNPs were genotyped in 48 unrelated morbidly obese patients from families showing evidence of linkage at the Chromosome 10p locus and in 48 nonobese control subjects. For further extensive case-control study, six SNPs −2625 A>G, −243 A>G (5′ flanking region), +84 G>A (intron 1), +61450 C>A (intron 11), +70210 A>T (intron 13), and +83897 T>A (intron 15) were selected, as they were not in complete LD between each other (Δ2) and their frequency was higher than 10% and thus could account for the genetic variability of the GAD2 gene.
Table 1. Allele Frequency and Hardy–Weinberg Equilibrium Statistics for 15 SNPs Selected for Association Studies.
The six SNPs were genotyped in 349 unrelated morbidly obese patients, in 383 unrelated moderately obese subjects, and in 376 unrelated nonobese normoglycemic subjects. We observed a first indication for association (or trend) between morbid obesity and four SNPs at position −243 A>G, +84 G>A, 61450 C>A, and +83897 T>A (0.035 < p < 0.1; 1.27 > odds ratio [OR] > 1.02). No association was observed between any SNP and moderate obesity (0.2 < p < 0.93) (data not shown). As we cannot exclude an effect of uncommon polymorphisms (prevalence, <5%) in the coding regions on morbid obesity, we genotyped SNPs +2414 C>A (Pro153Gln), +53881 C>T (Thr339Thr), and +70210 A>T in this first cohort. No association between these SNPs and obesity was observed (data not shown).
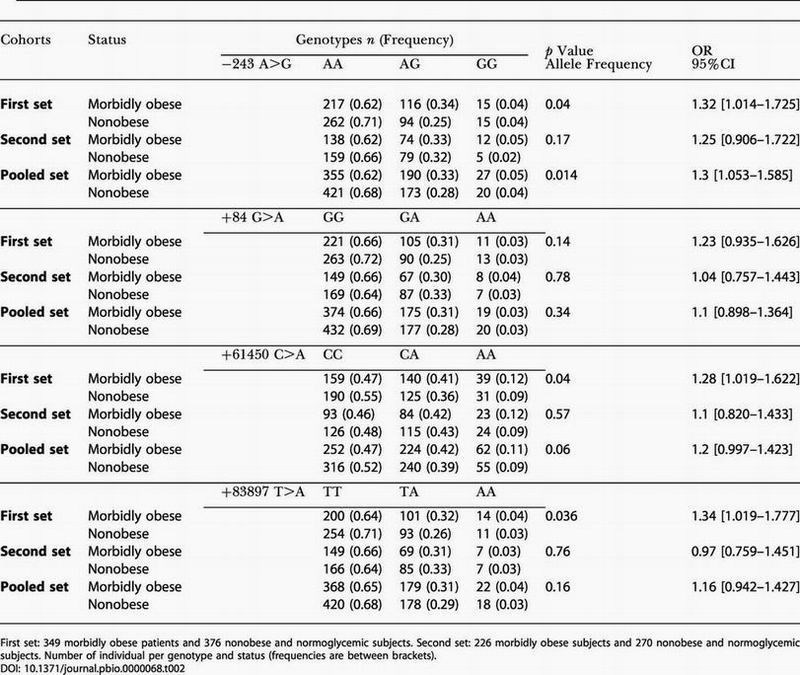
In order to confirm these results, we genotyped −243 A>G, +84 G>A, +61450 C>A, and +83897 T>A SNPs in additional sets of 226 unrelated morbidly obese subjects with familial history of obesity and of 270 nonobese normoglycemic subjects selected from 294 families representative of the general population from northern France. In this replication study, a trend for association between the G allele of the −243 A>G SNP and morbid obesity was found (OR = 1.25 [0.906–1.722], p = 0.17). Analysis of pooled data of both studies confirmed the association between the −243 A>G SNP and morbid obesity (OR = 1.3, 95% confidence interval [CI] [1.053–1.585], p = 0.014; Table 2). A trend toward association was observed for SNP +61450 C>A (OR = 1.2, 95% CI [0.997–1.423], p = 0.06). No association was detected for SNPs +84 G>A and +83897 T>A. The risk alleles were the G and A alleles for SNP −243 A>G and SNP +61450 C>A, respectively.
Table 2. Comparison of Genotypic and Allelic Distribution of the −243 A>G, +84 G>A, +61450 C>A, and +83897 T>A SNPs between the Morbidly Obese and Nonobese Groups.
First set: 349 morbidly obese patients and 376 nonobese and normoglycemic subjects. Second set: 226 morbidly obese subjects and 270 nonobese and normoglycemic subjects. Number of individual per genotype and status (frequencies are between brackets)
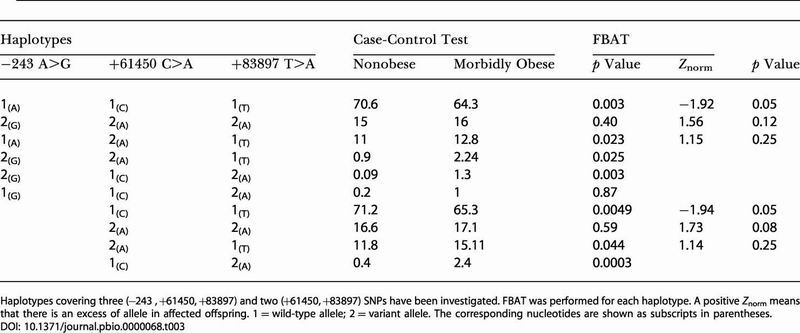
Haplotype analyses of SNPs −243 A>G, +84 G>A, +61450 C>A, and +83897 T>A were then performed by both haplotype trend regression (HTR) and permutation and model-free analysis and estimation haplotype (PM+EH+) methods. Haplotypes including SNP +84 G>A with each of the three remaining SNPs did not improve association with morbid obesity, and indeed association of SNP +84 G>A resulted from its LD with the other three SNPs (data not shown). Thus, SNP +84 G>A was excluded from further haplotype analyses. Haplotype structures, including the three SNPs −243 A>G, +61450 C>A, and +83897 T>A, were then investigated in the 575 unrelated morbidly obese patients with familial history of obesity and in the 646 nonobese subjects. Among the eight possible haplotypes defined by SNPs −243, +61450, and +83897, only six haplotypes displayed a frequency of greater than 1% and their combined prevalence encompassed all but 2% of the haplotypes seen in the population (Table 3).
Table 3. Haplotype Analysis of the Obese Status in 575 Morbidly Obese and 646 Control Subjects.
Haplotypes covering three (−243 , +61450, +83897) and two (+61450, +83897) SNPs have been investigated. FBAT was performed for each haplotype. A positive Znorm means that there is an excess of allele in affected offspring. 1 = wild-type allele; 2 = variant allele. The corresponding nucleotides are shown as subscripts in parentheses
Comparison of haplotype frequencies performed by HTR between cases and controls showed evidence for association with obesity with an empirical p value of 0.0004. This positive result was ascertained by a PM+EH+ analysis (p = 0.0002). Frequencies of haplotypes bearing the wild-type alleles (A–C–T) were significantly higher in nonobese compared to the morbidly obese group (Table 3). It is noteworthy that the risk G allele at SNP −243 A>G was present on several haplotypes with frequencies lower than 1% that cannot be taken into account for the haplotype analysis. SNPs −243, +61450, and +83897 were in strong LD, and the χ2 between these markers ranged from 556 to 1265; thus, p values were <0.00001. In addition, posterior probabilities of haplotype accuracy, as assayed by software for estimating frequencies of large haplotypes of SNPs, SNPHAP, were greater than 0.98 for 98% of the subjects included in the study. For the remaining 2% of subjects, posterior probabilities ranged from 0.88 to 0.98. Moreover, on a background wild-type CC for SNP +61450 C>A or TT for SNP +83897 T>A, association of SNP −243 A>G with morbid obesity remained significant (p = 0.01 and p = 0.03, respectively). The independent effect of −243 A>G was confirmed by haplotype analysis of SNPs +61450 C>A and +83897 T>A that presented a significant association with morbid obesity, overall permutation showing an empirical p < 0.0001. Estimated frequencies of haplotype bearing the wild-type alleles (C–T) remained higher in the nonobese compared to the morbidly obese group (p = 0.0049). Thus, the C–T haplotype displayed a “protective” effect against obesity (OR = 0.81, 95% CI [0.681–0.972]).
Linkage, Familial Association, and Association with the Evidence of Linkage of GAD SNPs
Familial association and association with the evidence of linkage were investigated in the 188 nuclear families (612 individuals). First, as expected in a region of linkage, the SNPs −243 A>G, +61450 C>A, and +83897 T>A showed significant linkage with a binary obese status, displaying an MLS of, respectively, 2.54, 1.86, and 4.54 (data not shown). The SNPs of GAD certainly show linkage with obesity and that they are, therefore, worth investigating for familial-based association tests (FBATs).
The FBAT was used to detect association in our established linkage context. In single SNP analyses, we observed an association and an excess of wild-type alleles in nonaffected offspring for SNPs +61450 C>A and +83897 T>A (Z = −2.17, p = 0.03 and Z = −2.09, p = 0.03, respectively) and a trend toward association and excess of G allele for SNP −243 A>G in affected offspring (Z = 1.87, p = 0.06). For haplotype analysis of SNPs +61450 C>A and +83897 T>A, the global test for association with obesity was significant (χ2 = 7.637, p = 0.02). The protective wild-type (C–T) haplotype was in excess in nonaffected offspring (Z = −1.94, p = 0.05) (Table 3).
A significant association with the evidence of linkage was observed for SNP +61450 C>A. Seventeen nuclear families, with concordant affected sibpairs for the A–A genotype, displayed a LOD score of 4.13, p = 0.02 (as this LOD score was reached 20 times out of 1,000 simulations, assessing a C allele frequency of 0.72, the value in the control cohorts). When considering a C allele frequency of 0.68 (value in the morbidly obese cohorts), a p value of 0.06 was observed. Remaining sibpairs nonconcordant for this genotype displayed a LOD score of 1.75. Thus, it is impossible to exclude that SNP +61450 C>A explains the observed linkage.
LD Analysis of the GAD2 Region
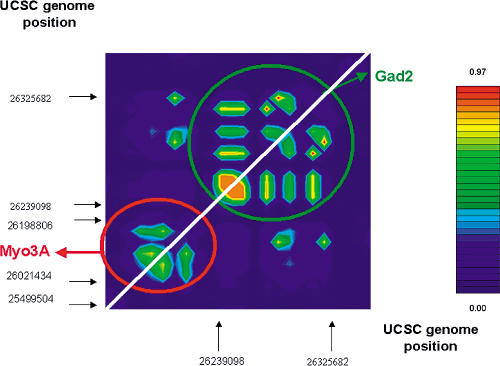
To confirm that the GAD2 gene itself is responsible for the observed LD with obesity around the D10S197 marker, pairwise LD among SNPs in the region was investigated and graphically represented using the GOLD software (http://www.well.ox.ac.uk/asthma/gold). Various studies reported that LD extends between 10 and 30 kb for common alleles (Ardlie et al. 2002a), whereas others showed that it may extend to 60 kb (Reich et al. 2001). Then, LD analysis was performed in a 300 kb region including the GAD2 gene and its only known nearby gene MYO3A, located 4.14 kb downstream the GAD2 gene. MYO3A belongs to the myosin superfamily, and its mutations are responsible for a nonsyndromic progressive hearing loss (Walsh et al. 2002). LD analysis of 28 SNPs covering the 300 kb region including GAD2 and MYO3A genes showed that they belong to distinct blocks of LD (Figure 2). SNPs in the MYO3A gene were not in LD with those of the GAD2 gene. Moreover, none of the MYO3A SNPs was associated with obesity or related phenotypes (data not shown), suggesting that the observed association with morbid obesity is likely to be due to the GAD2 gene itself.
Figure 2. Pairwise LD between SNPs of GAD2 and MYO3 Genes in the French Obese Population.
Pairwise LD between SNPs is measured by triangles (color scale). Regions of high and low LD are represented by red and blue shading, respectively. The graph is not to scale; indeed, the SNPs are equidistant to highlight the detailed pattern of LD.
The G Allele at the SNP −243 A>G Variant Increases the GAD2 Gene Transcription Level
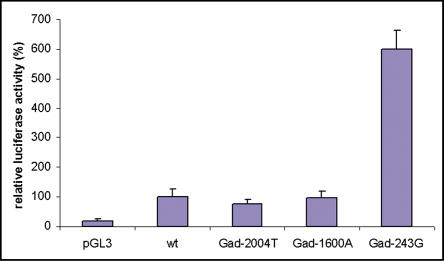
The −243 A>G SNP displayed the highest level of association with massive obesity and is located in the 5′ flanking region. We therefore sought to know whether it was involved in the expression of the GAD2 gene. As the −243 A>G was in strong LD with two promoter SNPs, −1600 G>A (D′ = 0.991), and −2004 A>T (D′ = 0.996) SNPs, we investigated the potential effect of the three individual SNPs on GAD2 transcription. The luciferase reporter gene was used to measure promoter activity. βTC3 cells (murine insulinoma cell line) were transiently cotransfected with the promoter constructs and control vectors. The transcriptional activity of the −243 G/G mutant construct was six times higher compared to the wild-type −243 A/A construct (n = 8, p < 0.0001) (Figure 3). In contrast, the −1600 A/A and −2004 T/T constructs showed, respectively, a similar pattern of transcriptional activity and a decrease of 25% of transcriptional activity compared to wild-type construct.
Figure 3. Effect of the −243 A>G , −1600 G>A, and −2004 A>T SNPs on Transcriptional Activity.
G, A, and T alleles at −243 A>G, −1600 G>A, and −2004 A>T SNPs were generated into the wild-type construct (wt). βTC3 cells were transfected with equivalent amounts of pGL3, wild-type, Gad-2004T, Gad-1600A, and Gad-243G constructs. pRLTK was cotransfected with each construct. Luciferase and Renilla activities were assayed and normalized. Each experiment was performed in duplicate and replicated five times. A 6-fold increase of transcriptional activity was observed for the Gad-243 as compared to the wild-type construct.
To examine the effects of the −243 >G SNP on binding affinity and specificity for transcription, electrophoretic mobility shift assays (EMSAs) were performed using nuclear extracts from βTC3 cells and two pairs of DNA oligonucleotide probes that differed only by the SNP. A shift was observed with the probe containing the −243 A allele, showing that this DNA sequence is able to bind a nuclear protein (Figure 4). Furthermore, comparisons of binding capacity of the probes containing −243 A and −243 G, respectively, showed that βTC3 nuclear proteins have a 6-fold higher affinity for the G allele variant than for the A allele of −243 A>G (Figure 4). Computational analysis of the −243 G/A flanking sequences did not show a putative binding site for tissue-specific (brain, β cells, pancreas) transfactors.
Figure 4. EMSA of the the −243 A>G Polymorphism with βTC3 Nuclear Proteins.
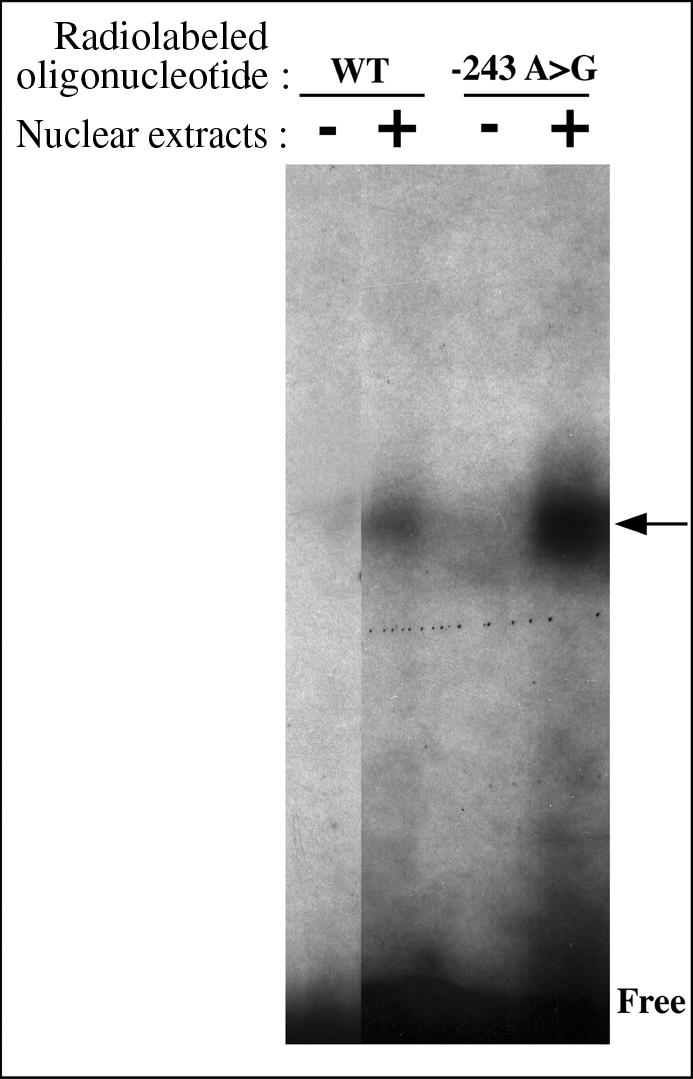
Specific complex formation is indicated by an arrow. Lanes (−) are radiolabeled probes without nuclear extract. βTC3 nuclear proteins have an higher affinity for the G allele variant than for the A allele at SNP −243 A>G.
Association Study between SNP −243 A>G and Scores on the Three Factor Eating Questionnaire (Restraint, Disinhibition, and Hunger)
To further explore the contribution of the GAD2 gene and especially of its functional polymorphism, −243 A>G SNP, in the modulation of food intake, we analyzed data obtained through the Three-Factor Eating Questionnaire (TFEQ) (Stunkard and Messick 1985) in the morbidly obese population. This questionnaire was proposed to evaluate dietary restraint (factor 1), disinhibition (factor 2), and hunger (factor 3) indexes. In morbidly obese subjects, SNP −243 A>G was associated with scores of the TFEQ. The homozygote variant GG for SNP−243 A>G showed higher hunger and disinhibition scores (p = 0.007 and p = 0.028, respectively) (Figure 5). SNPs +61450 C>A and +83897 T>A were also evaluated for these scores, but only SNP +83897 T>A showed significant association with the hunger score (p = 0.04). Association with eating parameters and haplotype including SNPs +61450 C>A and +83897 T>A did not reach significance.
Figure 5. Association Studies of the −243 A>G Variant with Food Intake Behavior Parameters in Morbidly Obese Patients.
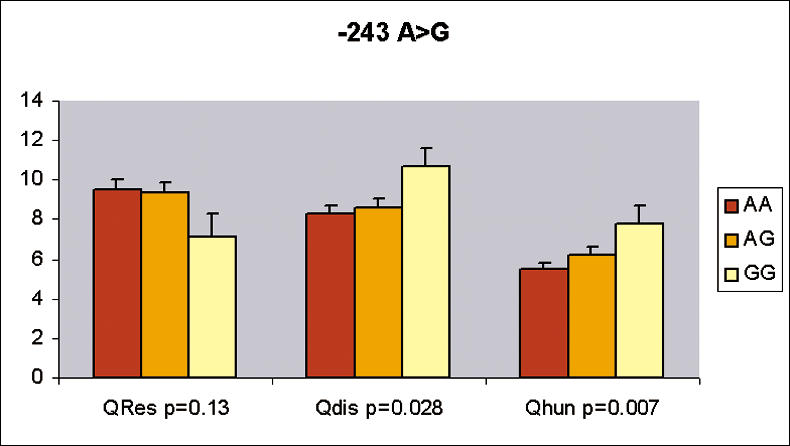
The three stable factors—cognitive restraint of eating, disinibition, and hunger—were assessed in 464 morbidly obese patients to fill in the TFEQ established by Stunkard and Messick (1985). Mean score values ± SD for each genotype are represented.
Haplotype including the wild-type alleles (A–C–T) for SNPs −243 A>G, +61450 C>A, and +83897 T>A was associated with a lower hunger score than haplotype including variant alleles (G–A–A) (p = 0.01 by HTR). A similar nonsignificant trend was observed for the disinhibition score (p = 0.08 by HTR). The TFEQ was not available in nonobese subjects.
Association Study with GAD65 Autoantibodies
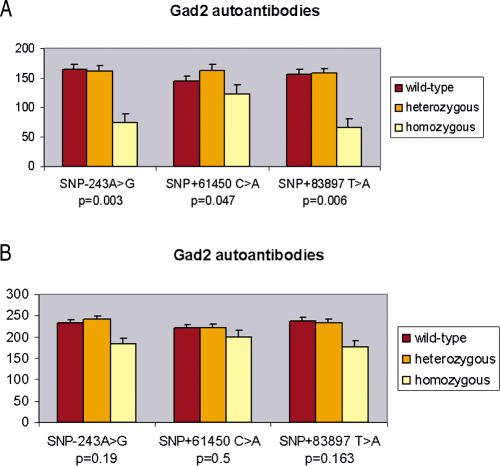
A correlation between GAD65 autoantibody (GAD65Ab) levels and high BMI previously reported in a Swedish population was assumed to be related with the obesity-associated hyperinsulinemia that stimulates the generation of GAD65Ab (Rolandsson et al. 1999). In order to confirm that GAD2 SNPs may indirectly modulate insulin secretion, thus interacting with food intake regulation, we investigated their potential effect on GAD65Ab level. As the distribution of GAD65Ab indexes was not normally distributed, we considered natural logarithm (Ln) GAD65Ab values for further analyses. As hyperinsulinemia is a characteristic of obese patients, mean values of Ln GAD65Ab indexes were higher in the 575 unrelated morbidly obese patients (3.81 ± 0.35) compared to the 376 nonobese normoglycemic subjects (3.71 ± 0.36; p = 0.007 for the Kolmogorov–Smirnov test), in agreement with previous findings (Rolandsson et al. 1999; Weets et al. 2001). In the control group, SNPs −243 A>G, +61450 C>A, and +83897 T>A were associated with Ln GAD65Ab adjusted for age and BMI (Figure 6). Homozygote variant genotypes (GG, AA, AA for SNPs −243 A>G, +61450 C>A, and +83897 T>A) showed lower GAD65Ab levels (p values for the Kruskal–Wallis test: 0.003, 0.047, and 0.006 for SNPs −243 A>G, +61450 C>A, and +83897 T>A, respectively) (Figure 6A). A similar nonsignificant trend for association between GAD2 SNPs and GAD65Ab indexes was observed in the morbidly obese group (Figure 6B). Thus, promoter GAD2 SNPs associated with obesity were associated with lower levels of antibodies in normal weighted subjects, whereas the elevated GAD65Ab levels of obesity-induced hyperinsulinemia in morbidly obese patients should mask this link.
Figure 6. Ln GAD65Ab Levels Adjusted for Age and BMI According to the Genotypes at SNPs −243 A>G, +61450 C>A, and +83897 T>A.
Mean level values ± SD are displayed for each genotype. Wild-type are AA, CC, TT; heterozygous are AG, CA, TA; and homozygous are GG, AA, AA, respectively, for each SNP. (A) Nonobese normoglycemic subjects. (B) Morbidly obese patients.
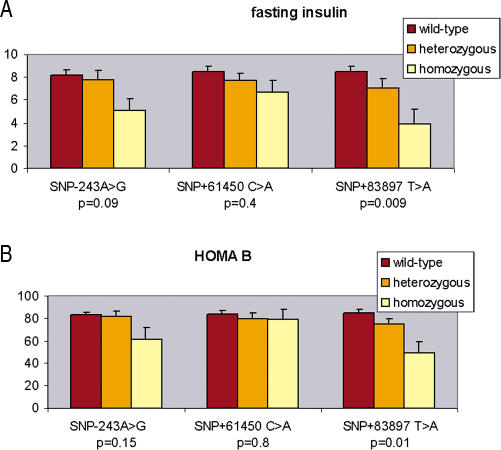
As GABA release from β cells was suggested to strongly inhibit insulin secretion (Shi et al. 2000), we looked in nondiabetic control subjects for a potential effect of GAD2 SNPs on fasting insulin and on the β-cell function assessed with the homeostasis model (HOMA-B%). We found that subjects homozygous (AA) for +83897 T>A showed lower fasting insulin levels and HOMA -B indexes (p values for Kruskal–Wallis test: 0.0091 and 0.01, respectively, for fasting insulin and HOMA-B) (Figure 7), suggesting a deleterious effect of GAD2 SNPs on insulin secretion, probably through an increase of the GABA pool in pancreatic β cells mediated by GAD65 higher enzymatic activity.
Figure 7. Fasting Insulin and HOMA.
Fasting insulin (A) and assessment of HOMA-B% (B) in 376 nonobese normoglycemic subjects according to the genotypes at SNPs −243 A>G, +61450 C>A, and +83897 T>A. Mean level values ± SD are displayed for each genotype. Wild-type are AA, CC, TT; heterozygous are AG, CA, TA; and homozygous are GG, AA, AA, respectively, for each SNP.
Discussion
All together, the identification of a protective effect of the wild-type alleles at SNPs −243 A>G, +61450 C>A, and +83897 T>A supports the hypothesis that the GAD2 gene may modulate the risk of morbid obesity in the French population. Analyses of GAD2 SNP haplotypes allow us to conclude that SNP −243 A>G and an haplotype including SNPs +61450 C>A and +83897 T>A displayed separate effects, as these genetic risk factors have never been encountered on the same haplotype.
These assumptions are primary based on case-control studies in French Caucasian adult patients, a population still protected against massive obesity, as its prevalence is three to five times lower compared to the United States' population. As our initial affected sibpair linkage study only included individuals with adult onset of obesity, few families have parental genotype information. However, to exclude false-positive association (due to population stratification) and to assess the contribution of GAD2 SNPs to the observed linkage on Chromosome 10p12, we performed studies to examine familial association and association with the evidence of linkage in the nuclear families from the original population showing linkage on this locus. We observed a modest but significant evidence of association with obesity and the linkage signal. For SNP +61450 C>A, at-risk homozygous-bearing (A–A) affected sibpairs (17 nuclear families) displayed a significant LOD score of 4.13. Remaining affected sibpairs nonconcordant for this genotype displayed alone a LOD score of 1.75 at this locus. Although this suggests that a unique SNP of the GAD2 gene could explain a significant part of the linkage on Chromosome 10p12 (p = 0.02–0.06), the effect of this SNP, in terms of relative risk, given the prevalence of 1% of morbid obesity and the SNP allelic frequency of 32% in the morbidly obese cohort, is not compatible with such a high MLS. Therefore, it is very likely other SNPs and/or genes located nearby on Chromosome 10p could contribute to the observed linkage.
SNP −243 A>G, although shown to be associated with morbid obesity in case-control cohorts and to modulate the GAD2 promoter activity, did not show significant evidence of familial association with obesity and the linkage signal. To observe a linkage, we need at least one of the risk factors to be heterozygous for parents and transmitted to affected offspring. Indeed, the risk G allele at the −243 locus is less frequent than its counterpart at the +61450 locus (0.21 versus 0.32), and if 17 homozygous-bearing (A–A) affected sibpairs were scored for the +61450 SNP, only three homozygous-bearing (G–G) affected sibpairs were scored for the −243 SNP. Thus, an association with obesity and the linkage signal for the −243 SNP, if it exists, may remain undetected. However, the effect of the gene does not necessarily lie only on one SNP. It is very possible that other variations in the gene, as −243 A>G, may have an effect, although undetected by linkage.
We believe that our case-control data showing association between GAD2 SNPs and morbid obesity do not result from a stratification bias, as there is little allelic heterogeneity in European populations (Ardlie et al. 2002b), and moreover our family-based data support this association. It is noteworthy that only 16% of the obese subjects included in case-control analyses were part of the genome-scanned and fine-mapped families, ruling out that the observed association is specific to this small group. In this respect, results remained qualitatively similar (but less significant, as the number of subjects was lower) when removing these obese probands from the case-control studies (ORs of 1.28, 95% CI [1.04–1.59], p = 0.02; 1.17, 95% CI [0.97–1.41], p = 0.1; and 1.13, 95% CI [0.91–1.41], p = 0.296, respectively, for SNPs −243 A>G, +61450 C>A, and +83897 T>A).
SNPs +61450 C>A and +83897 T>A are located, respectively, in GAD2 intron 11 and 15 and their functional role is not obvious. On the other hand, the hypothesis of a functional effect for SNP −243 A>G is further supported by transcriptional activity studies, clearly showing that the G allele of SNP −243 A>G increased GAD2 promoter activity although two nearby promoter SNPs (−1600 G>A and −2004 A>T) in strong LD with SNP −243 A>G did not modulate promoter activity. As suggested by EMSA, a nuclear protein that remains to be identified could have an higher affinity for the G allele. Furthermore, obese homozygous carriers of the G allele at −243 A>G SNP were characterized with overeating features as evaluated by the TFEQ. They had significantly higher indexes of hunger and disinhibition, which characterize higher sensitivity to the sensorial stimulation of food, leading in certain circumstances to a decreased ability to control their food intake over the time.
The disinhibition score has also been highly associated with binge-eating features (Heartherth and Polivy 1992; Lawson et al. 1995). Eating behavior was shown to be partially heritable (Faith et al. 1997), and several susceptibility loci were suggested from genome-wide scan studies (Steinle et al. 2002). In this regard, Branson et al. (2003) recently reported that binge-eating was a major phenotypic abnormality associated with mutations in the melanocortin 4 receptor (MC4-R), suggesting that MC4-R contributes to modulate eating behavior. A significant linkage on Chromosome 10p was recently identified in bulimia nervosa, a psychiatric disorder characterized by overeating and self-induced vomiting (Bulik et al. 2003). Here, the probability to detect genetic mutations massively increasing BMI is higher. Both our in vitro and genetic findings suggest that GAD2 SNPs may have contributed to the worsening of obesity in this population, possibly though a disability of the rare allele carriers in controlling their food intake. Further clinical investigation in bearers would be needed to validate this hypothesis. At present, we speculate that an increased activity of the GAD2 gene may increase the GABA pool in the hypothalamus, thus enhancing GABA orexigenic effects, resulting in an altered feeding behavior. Several lines of investigation support a role for GABA in regulation of feeding behavior. Investigation in turkeys has demonstrated that intracerebroventricularly injection of varying doses of muscimol, a potent GABA agonist, caused a dose-dependant increase of food intake (Denbow 1991). Transgenic mice ubiquitously overexpressing the GABA transporter exhibited heritable obesity, with increased body weight and fat deposition (Ma et al. 2000). GABA is coexpressed in the subpopulation of NPY neurons in the arcuate nucleus, suggesting that GABA and NPY interact in the paraventricular nucleus to stimulate food intake (Ovesjo et al. 2001). Indeed, the gut-secreted hormone PYY3–36, which potently inhibits food intake in both rodents and in human, acts by inhibiting NPY neurons, thus disinhibiting pro-opiomelanocortinergic (POMC) neurons through a GABA-mediated process (Batterham et al. 2002).
The dopaminergic neurons were previously suggested to be involved in behavioral disorders, such as eating disorders. The low brain dopamine activity found in obese subjects could predispose them to excessive use of food (Wang et al. 2001). Dopamine D2 receptor polymorphisms were reported to be associated with obesity in Pima Indians from Arizona (Jenkinson et al. 2000). The dopaminergic signal promotes the functional differentiation of GABAergic neurons by regulation of expression of GAD65 and GAD67, suggesting interactions between dopamine and GABA pathways in the regulation of food intake (Laprade and Soghomonian 1999).
In addition to the central effects of GAD2, a peripheral contribution might also be suggested. The GAD2 gene is highly expressed in pancreatic β cells and GAD65 is the most important autoantigen in type 1 diabetes. In each β cell, there are 3,000 small GABA-containing neuron-like secretory vesicles, similar to the clear synaptic vesicles in nerve terminals. It has been speculated that GABA-containing microvesicles are released by Ca2+-dependent exocytosis and may have an autocrine/paracrine function within the islet (Gu et al. 1993). GABA released from the β cell accordingly inhibits insulin exocytosis by activation of GABA-B receptors (G protein-coupled receptors) and in the α cell suppresses glucagon release by activation of GABA-A receptor Cl channels (Rorsman et al. 1989; P. Rorsman, personal communication). Given the anorectic role of insulin and of glucagon-related peptides in the CNS, it is also possible that GAD2 SNP-related increase of the GABA pool in pancreatic islets contributes to modulate food intake (Niswender et al. 2003).
In order to be able to test this hypothesis in humans, we analyzed the GAD65Ab level as a marker of β-cell activity and of insulin secretion. Indeed, it was recently shown that in a nondiabetic general population from Sweden, the ORs for subjects in the highest BMI group to exceed the 95th or 99th GAD65Ab percentile were 3.6 and 17.6, respectively (Rolandsson et al. 1999). Previously confirmed among first-degree relatives of type 1 diabetes patients (Weets et al. 2001), this correlation between obesity and GAD65Ab levels was also observed in our French population and may be due to the overstimulation of the β cells associated with obesity. In order to have an indirect confirmation of the GAD2 SNP functional role, we then examined possible associations between the SNPs −243 A>G, +61450 C>A, and +83897 T>A and GAD65Ab and plasma insulin levels. These analyses showed lower GAD65Ab levels (especially in the control group) and lower insulin secretion indexes in homozygous variant carriers at any of these SNPs. This is in agreement with a negative regulation by GABA (generated by GAD65 in the β cells) of the first phase of insulin secretion in response to glucose (Shi et al. 2000). The fact that GAD65Ab and related insulin values are lower in GAD2 carriers of SNP variant alleles but are higher in obese compared to normal-weighted subjects may look like a paradox if one wants to see a direct role of GAD65Ab in the development of obesity. Further, we think that the presence of GAD65Ab is only a marker of hyperinsulinemia and has nothing to do with the molecular mechanisms responsible for obesity. Instead, GAD65Ab levels should be considered as an intermediary phenotype for GAD2 gene higher expression in subjects carrying the at-risk SNPs that in turn may impair insulin secretion, decrease GAD65Ab secretion, and ultimately influence food intake behavior through insulin central effects.
In conclusion, our data point out GAD2 gene as a candidate for morbid obesity. Previous studies in cases with extreme forms of obesity have shown mutations in genes involved in the leptin–melanocortin pathway (Clement et al. 2002), which primarily impair food intake regulation. If confirmed, our results are novel evidence for a role of GABA, which interacts in the NPY and POMC neurons' cross-talk, but also may modulate the anorectic insulin release by the β cells (Schwartz et al. 2003) in the polygenic predisposition to the severe obesity in human.
Materials and Methods
Study Populations
Fine mapping was performed using a set of 188 nuclear families collected through the Department of Nutrition of the Hôtel Dieu Hospital in Paris (46%) or by a multimedia campaign at the Institut Pasteur de Lille (54%) in France. Families were ascertained through a proband with a BMI of greater than 40 kg/m2 and at least one additional sibling with a BMI of greater than 27 kg/m2.
Association studies of the GAD2 gene were performed using a first set of 349 unrelated morbidly obese patients (mean BMI, 47.3 ± 7.4 kg/m2; mean age, 46 ± 12 y; women/men, 280/69). SNPs showing a significant association (or even a trend toward association) were genotyped in an additional group of 226 unrelated morbidly obese subjects (mean BMI, 47.45 ± 7.69 kg/m2; mean age, 47.3 ± 11.7 y; women/men, 165/61) and in a set of 383 unrelated moderately obese subjects (mean BMI, 34.3 ± 4.13 kg/m2; mean age, 51.2 ± 14.8 y; women/men, 201/182), randomly selected from a collection of French patients. Of the morbidly obese, 16% (91/575) were included in the original linkage cohort (Hager et al. 1998).We used as control groups a first set of 376 unrelated nonobese and normoglycemic husbands and wives from type 2 diabetes families (Vionnet et al. 2000) (mean BMI, 22.8 ± 2.44 kg/m2; mean age, 58.3 ± 14.1 y; women/men, 227/149) and a second set of 270 unrelated nonobese and normoglycemic subjects selected from 294 families from a general population recruited on a geographical basis in two towns from Northern France (the so-called Fleurbaix–Laventie study) (mean BMI, 23.3 ± 2.2 kg/m2; mean age, 44.3 ± 3.85 y; women/men, 153/117).
In our population, to assess parameters of food-eating behavior, the subjects filled in the TFEQ established by Stunkard and Messick (1985), which evaluates the cognitive restraint of eating, disinhibition, and hunger. Scores for the TFEQ were available for 464 morbidly obese patients with familial history of obesity and the range of scores for hunger was 1–14; for disinhibition, 1–18; and for restraint, 1–21.
Fasting insulin was measured with standard protocols, and β-cell function (% B) was assessed with HOMA (Matthews et al. 1985).
GAD65Ab Assays
Plasma samples were analyzed for GAD65Ab in radioligand binding assays (Grubin et al. 1994). [35S]Methionine-labeled GAD65 was produced by in vitro coupled transcription/translation with SP6 RNA polymerase and nuclease-treated rabbit reticulocyte lysate (Promega, Madison, Wisconsin, United States) as previously described (Grubin et al. 1994). The in vitro translated proteins were kept at −80°C and used within 2 wk of preparation. The upper level of normal was established by analyzing sera obtained from nondiabetic subjects. The interassay %CV for the positive control sample (WHO standard 97/550 6) was 15% for GAD65Ab. In the third International Combined Autoantibody Workshop (Verge et al. 1998), our assay showed 70% sensitivity and 98% specificity for GAD65Ab.
Fine Mapping
In 188 nuclear families comprising 620 individuals, we genotyped 16 polymorphic markers from D10S548 to D10S220 with a density of one marker every centimorgan. Two-point and multipoint analyses were performed using the GeneHunterPlus software (Kruglyak and Lander 1995). The statistics were the MLS (Risch 1990).
Screening the GAD2 Gene
The 16 exons and UTRs (upstream 5′ UTR and downstream 3′ UTR) were screened in 24 unrelated obese patients (mean BMI, 37.9 ± 5.92 kg/m2; mean age, 48.7 ± 8.5 y; women/men, 16/8) randomly selected among families contributing to the linkage at the Chromosome 10p locus and in 24 unrelated nonobese normoglycemic control subjects (mean BMI, 22.57 ± 1.97 kg/m2; mean age, 61.8 ± 10 y; women/men, 16/8) selected from French pedigrees.
DNA sequencing was performed using an automated ABI Prism 3700 DNA sequencer in combination with the Big Dye Terminator Cycle Sequencing Ready Reaction Kit (Applied Biosystems, Foster City, California, United States). The obtained sequences were compared with the published sequence for the human GAD2 gene.
Sequences of primers used for PCR-direct sequencing are available from the authors.
Genotyping
Fifteen SNPs of the GAD2 gene were genotyped by direct sequencing and/or with the LightCycler™ (Roche Diagnostics, Basel, Switzerland) assay based on hybridization probes labeled with fluorescent dyes that allow fluorescence resonance energy transfer (Blomeke et al. 1999). Sequences of primers pairs, labeled with fluorescein and LC Red 640 (Roche Diagnostics), are available from the authors.
Statistical Analyses
Case-control studies
Comparison of allelic frequencies between cases and controls was achieved through the χ2 test and the p value was empirically computed with the program CLUMP (Sham and Curtis 1995). This method is of special interest when applied to polymorphic markers (D10S197) because of the large number of alleles.
All SNPs were complied with Hardy–Weinberg proportions; then, we presented the OR and the 95%CI for allelic effect. Scores for the TFEQ, GAD65Ab index, fasting insulin, and β-cell function (%B) were compared within 376 unrelated nonobese and normoglycemic and 464 morbidly obese subjects, using the nonparametric Wilcoxon–Kruskal–Wallis test. Haplotype frequencies were determined and were compared between groups with the PM+EH+ (Zhao et al. 2000) and the HTR (Zaykin et al. 2002) softwares. HTR also allows rapid and robust comparison of haplotype frequencies between two groups as well as association testing between haplotypes and quantitative traits.
The method is equivalent to multiple regression, where covariates are the probability of presence of each haplotype. We then get significance tests for the whole effect of haplotypes (Apval) on the trait and individual tests for each haplotype (Hpval). The HTR program allows for permutation empirical p value determination. We can thus correct for multiple SNPs testing. The expectation maximization (EM) algorithm is used to infer individual haplotype probability distribution. We assigned the two most likely haplotypes to each subject, either affected or unaffected. The population probabilities for each haplotype were estimated in the whole group, affected and unaffected, pooled together. PM+EH+ estimated the haplotype frequencies and their log-likelihood in each group separately (Laff and Lunaff) and in the whole sample (Lall) through an EM algorithm, and a likelihood ratio test (Lall−(Laff+Lunaff)) evaluated heterogeneity in haplotype frequencies between the groups. The main difference between these two methods lies in the group where frequencies are estimated. Haplotypes were reconstructed from population genotype data, using SNPHAP (Stephens et al. 2001) software.
Familial association
We used three methods that allowed us to extract as much information as possible from our data, which are not well tailored for family-based tests.
Pedigree Disequilibrium Test (PDT). The Pedigree Disequilibrium Test (Martin et al. 2000) allows us to evaluate evidence of LD in general pedigree data. This method considers all the possible informative triads and discordant sibpairs (DSPs) in the pedigree. A variable is created that is either the difference between the number of transmissions and the nontransmission for a given allele in a triad or the difference between the frequency of this allele in affected and unaffected member of the DSP. The sum of this value is weighted by the number of units (triad and DSP) in each pedigree. The new random variable D is then summed over all the pedigrees. It is expected to be equal to 0 under the null hypothesis of no linkage and no association and D/√Var(D) follows a Normal with a mean of 0 and a variance of 1.
We decided to use the option that computes the statistic for the trios and only when the founders are untyped uses DSP. This seems to be a sound approach when we are not sure of the status of the unaffected individuals and want to give them minimum weight.
Family-Based Association Test (FBAT). The FBAT (Lake et al. 2000) method defines a statistical test that reflects association between a phenotype (T) and a marker value (X). The tests uses the generic form S = ΣT·X as a test statistic, where summation is over all offspring in all families in the dataset. The distribution of S under H0 is calculated using the distribution of offspring genotype, conditional on the trait T and on the parental genotype, or the sufficient statistics when parental genotype is unobserved. The value S − E(S)/√Var(S) follows a Normal (0,1). As we are in a region of linkage, with several individuals in each family, we chose the option −e that calculates an empirical variance and provides a valid test of association in this case. The phenotype was coded 1 for affected and 0 for unaffected, giving them a null weight in the final statistic. This is an affected-only test, although the genotypes of unaffected are used when the parents' genotypes are missing.
The FBAT program allows for haplotype tests. We therefore repeated this association test on haplotypes.
Association with Evidence of Linkage. We sought to test whether any of the SNPs was responsible for the observed linkage. We therefore split the sample of affected sibpairs onto pairs concordant for genotype categories (1 1, 1 2, 2 2, 1 X, 2 X). Note that the sets of 1 X and 2 X, where X represents allele 1 or 2, are overlapping. If a genotype is responsible for the observed linkage, we expect that the MLS of the set of the pairs concordant, or identical by state (IBS) for this genotype, which we call MLSg, is significantly higher than what is expected under H0. In our case, H0 includes linkage and association. We then derive a p value through simulation after preserving the linkage information (i.e., the identical by descent [IBD] status for each pair) and the association (the number of pairs concordant for the genotype).
It is worth pointing out that genotype category-specific MLSg cannot be considered as a traditional MLS. Indeed, we select pairs where IBS is 2 and the IBD status is not independent of the IBS status. Therefore, the MLSg does not follow a mixture of χ2 tests with 1 or 2 df, as usual. The p value is obtained through simulation under H0.
We simulate the parents' genotype and drop the alleles in the offspring according to the transmission probabilities (½–½) and the IBD status. For each pair, its IBD status is drawn from the zij distribution, where j = (0,1,2) is the number of alleles IBD and j is the pair's index. These values were obtained with the GeneHunterPlus software. Note that in parents, we just determine the number of 1 and 2 alleles, from an original allelic frequency (f1), and then just shuffle the alleles among them. Therefore, we will have the same allelic frequency in founders for each replicate. For a valid test of association with evidence of linkage, we count the number of times the replicate LOD score exceeds the observed LOD score, for a number of pairs equal to the original (if there are N pairs 11 11, we will use only the replicates where we observe N pairs simulated). This method was used by Horikawa et al. (2000) and Sun et al. (2002).
Plasmid Construction, Cell Line, and Luciferase Assay
Sense (cgggtctctgctttgttagc) and antisense (tttggagactggagcaggtc) oligonucleotides were used to amplify a 2,200 bp fragment of the GAD2 promoter from four homozygous individuals (wild-type, −243 G/G, −1600 A/A, and −2000 T/T). PCR fragments were inserted into the pGL3-basic vector (Promega) using the BglII and HindIII restriction sites present in the vector and the sense and the antisense oligonucleotides, respectively. Preparations of plasmids representing the genotypes −2000/−1600/−243 (A/G/A, G/G/A, A/A/A, and A/G/T) were performed, and the genotypes of the constructs were confirmed by sequencing.
Murine insulinoma cells βTC3 were grown in Dulbecco's modified Eagle's medium (DMEM) (Life Technologies, Carlsbad, California, United States) supplemented with 10% fetal calf serum, penicillin (10 U/ml), streptomycin (100 mg/ml), and L-glutamin (2 mM) and incubated at 37°C, under an atmosphere of 5% CO2. Cells were transiently transfected with 1 μg of each construct and with 50 ng of pRLTK plasmid expressing Renilla luciferase for 48 h using TransFastTM (Promega) according to the manufacturer's instructions. Cells were lysed and the firefly and the Renilla luciferase activities were measured using the dual-luciferase assay system (Promega). The pGL3-basic vector was used as negative control and the pGL3-SV40 vector as positive control. Each transfection was performed in duplicate and replicated five times. The normalized relative luciferase units (RLUs) for each construct correspond to the firefly/Renilla RLU ratio.
EMSA
Nuclear extracts were prepared from murine insulinoma cells βTC3, which were grown in DMEM high-glucose media supplemented with 10% fetal bovine serum, 2 mM L-glutamine, and 2-mercapto-ethanol and incubated at 37°C under an atmosphere of 5% CO2. Nuclear extracts were prepared as previously described (Schreiber et al. 1989). Double-stranded DNA probes containing the −243 A>G polymorphism were labeled with T4 polynucleotide kinase using [γ-32P]ATP and then purified using a mini-Quick Spin Columns system (Roche Applied Science, Basel, Switzerland). Binding reactions were performed in a total volume of 20 μl, with 5 μg of nuclear extract in a buffer containing 40 mM HEPES, 400 mM NaCl, 0.4 mM EDTA, 0.1 μg/μl dI–dC, 40% glycerol, 4 mg/ml bovine serum albumin, and 2 mM DTT. After a 15 min incubation at room temperature, probes (10,000 cpm) were added. The protein–DNA complexes were resolved on a 4% polyacrylamide:bisacrylamide (29:1) gel. Gels were dried under vacuum and exposed to X-ray films (Kodak, Rochester, New York, United States). Quantification of the signal was performed with NIH Image software (http://rsb.info.nih.gov/nih-image/).
Supporting Information
Accession Numbers
Accession numbers for the genes discussed in this paper are dopamine D2 receptor (LocusLink ID 1813), GAD2 (LocusLink ID 2572 and Genbank g182931), melanocortin 4 receptor (LocusLink ID 4160), MYO3A (LocusLink ID 53904), and neuropeptide Y (LocusLink ID 4852).
Acknowledgments
We are indebted to all families who participated to this study. This work was supported in part by a grant from Eli Lilly through the Lilly Consortium for Diabetes and Obesity (to M. McCarthy, P. Froguel, R. Leibel, M. Lathrop, J. Caro, and E. Ravussin); by the European Community Project NUGENOB (QLRT-CT-2000-00618); by the Medical Research Council (G 0000477); by the Genopole de Lille/Region Nord-Pas de Calais (G-6B and G-2A); by the Fond National de la Science (FNS) (Séquençage à grande échelle 2001); and by the National Institutes of Health (grants DK26190, DK53004, and DK 58026–04). The technical assistance of Marianne Deweirder is gratefully acknowledged.
Abbreviations
- Ab
autoantibody
- BMI
body mass index
- CI
confidence interval
- DMEM
Dulbecco's modified Eagle's medium
- DSP
discordant sibpair
- EH
estimation haplotype
- EM
expectation maximization
- EMSA
electrophoretic mobility shift assay
- FBAT
familial-based association test
- GABA
γ-aminobutyric acid
- GAD
glutamic acid decarboxylase
- HOMA
homeostasis model assessment
- HTR
haplotype trend regression
- IBD
identical by descent
- IBS
identical by state
- Lall
lumped allele statistics
- LD
linkage disequilibrium
- Ln
natural logarithm
- LOD
logarithm of odds
- MC4-R
melanocortin 4 receptor
- MLS
maximal LOD score
- NPY
neuropeptide Y
- OR
odds ratio
- PDT
pedigree disequilibrium test
- PM
permutation and model-free analysis
- POMC neuron
pro-opiomelanocortinergic neuron
- RLU
relative luciferase unit
- SNP
single nucleotide polymorphism
- SNPHAP
software for estimating frequencies of large haplotypes of single nucleotide polymorphisms
- TFEQ
Three-Factor Eating Questionnaire
- UTR
untranslated region
Conflicts of Interest. The authors have declared that no conflicts of interest exist.
Author Contributions. PB, CD, and PF conceived and designed the experiments. PB, SD, LC, JC, and VV-D performed the experiments. PB, CD, FV, SD, KS, LB, MC, KC, and PF analyzed the data. CD, FV, LC, KS, LB, BN, MAC, KC, AL, and PF contributed reagents/materials/analysis tools. PB, CD, FV, AL, and PF wrote the paper.
Academic Editor: John Bell, University of Oxford
¤1Present address: Pennington Biomedical Center, Baton Rouge, Louisiana, United States of America
¤2Present address: Faculty of Medicine and Pharmacy, Fes University, Fes, Morocco
References
- Ardlie KG, Kruglyak L, Seielstad M. Patterns of linkage disequilibrium in the human genome. Nat Rev Genet. 2002a;3:299–309. doi: 10.1038/nrg777. [DOI] [PubMed] [Google Scholar]
- Ardlie KG, Lunetta KL, Seielstad M. Testing for population subdivision and association in four case-control studies. Am J Hum Genet. 2002b;71:1478–1480. doi: 10.1086/341719. [DOI] [PMC free article] [PubMed] [Google Scholar]
- Bannai M, Ichikawa M, Nishihara M, Takahashi M. Effect of injection of antisense oligodeoxynucleotides of GAD isozymes into rat ventromedial hypothalamus on food intake and locomotor activity. Brain Res. 1998;784:305–315. doi: 10.1016/s0006-8993(97)01349-8. [DOI] [PubMed] [Google Scholar]
- Batterham RL, Cowley MA, Small CJ, Herzog H, Cohen MA, et al. Gut hormone PYY3–36 physiologically inhibits food intake. Nature. 2002;418:650–654. doi: 10.1038/nature00887. [DOI] [PubMed] [Google Scholar]
- Blomeke B, Sieben S, Spotter D, Landt O, Merk HF. Identification of N-acetyltransferase 2 genotypes by continuous monitoring of fluorogenic hybridization probes. Anal Biochem. 1999;275:93–97. doi: 10.1006/abio.1999.4288. [DOI] [PubMed] [Google Scholar]
- Branson R, Potoczna N, Kral JG, Lentes KU, Hoehe MR, et al. Binge eating as a major phenotype of melanocortin 4 receptor gene mutations. N Engl J Med. 2003;348:1096–1103. doi: 10.1056/NEJMoa021971. [DOI] [PubMed] [Google Scholar]
- Bulik CM, Devlin B, Bacanu SA, Thornton L, Klump KL, et al. Significant linkage on chromosome 10p in families with bulimia nervosa. Am J Hum Genet. 2003;72:200–207. doi: 10.1086/345801. [DOI] [PMC free article] [PubMed] [Google Scholar]
- Chagnon YC, Rankinen T, Snyder EE, Weisnagel SJ, Perusse L, et al. The human obesity gene map: The 2002 update. Obes Res. 2003;11:313–367. doi: 10.1038/oby.2003.47. [DOI] [PubMed] [Google Scholar]
- Charles MA, Basdevant A, Eschwege E. Prevalence of obesity in adults in France: The situation in 2000 established from the OBEPI Study. Ann Endocrinol (Paris) 2002;63:154–158. [PubMed] [Google Scholar]
- Clement K, Boutin P, Froguel P. Genetics of obesity. Am J Pharmacogenomics. 2002;2:177–187. doi: 10.2165/00129785-200202030-00003. [DOI] [PubMed] [Google Scholar]
- Denbow DM. Induction of food intake by a GABAergic mechanism in the turkey. Physiol Behav. 1991;49:485–488. doi: 10.1016/0031-9384(91)90268-s. [DOI] [PubMed] [Google Scholar]
- Erdo SL, Wolff JR. Aminobutyric acid outside the mammalian brain. J Neurochem. 1990;54:363–372. doi: 10.1111/j.1471-4159.1990.tb01882.x. [DOI] [PubMed] [Google Scholar]
- Faith MS, Johnson SL, Allison DB. Putting the behavior into the behavior of genetics of obesity. Behav Genet. 1997;27:423–439. doi: 10.1023/a:1025648316652. [DOI] [PubMed] [Google Scholar]
- Gretarsdottir S, Thorleifsson G, Reynisdottir ST, Manolescu A, Jonsdottir S, et al. The gene encoding phosphodiesterase 4D confers risk of ischemic stroke. Nat Genet. 2003;35:131–138. doi: 10.1038/ng1245. [DOI] [PubMed] [Google Scholar]
- Grubin CE, Daniels T, Toivola B, Landin-Olsson M, Hagopian WA, et al. A novel radioligand binding assay to determine diagnostic accuracy of isoform-specific glutamic acid decarboxylase antibodies in childhood IDDM. Diabetologia. 1994;37:344–350. doi: 10.1007/BF00408469. [DOI] [PubMed] [Google Scholar]
- Gu XH, Kurose T, Kato S, Masuda K, Tsuda K, et al. Suppressive effect of GABA on insulin secretion from the pancreatic beta-cells in the rat. Life Sci. 1993;52:687–694. doi: 10.1016/0024-3205(93)90229-v. [DOI] [PubMed] [Google Scholar]
- Hager J, Dina C, Francke S, Dubois S, Houari M, et al. A genome-wide scan for human obesity genes reveals a major susceptibility locus on chromosome 10. Nat Genet. 1998;20:304–308. doi: 10.1038/3123. [DOI] [PubMed] [Google Scholar]
- Heartherth TF, Polivy J. Chronic dieting and eating disorders: A spiral model. In: Crowther JH, Tannenbaum DL, Hobfoll SE, Stephens MAP, editors. The etiology of bulimia nervosa: The individual and family context. Washington, District of Columbia: Hemisphere Publishing; 1992. pp. 133–155. [Google Scholar]
- Horikawa Y, Oda N, Cox NJ, Li X, Orho-Melander M, et al. Genetic variation in the gene encoding calpain-10 is associated with type 2 diabetes mellitus. Nat Genet. 2000;26:163–175. doi: 10.1038/79876. [DOI] [PubMed] [Google Scholar]
- Jenkinson CP, Hanson R, Cray K, Wiedrich C, Knowler WC, et al. Association of dopamine D2 receptor polymorphisms Ser311Cys and TaqIA with obesity or type 2 diabetes mellitus in Pima Indians. Int J Obes Relat Metab Disord. 2000;24:1233–1238. doi: 10.1038/sj.ijo.0801381. [DOI] [PubMed] [Google Scholar]
- Johnson GCL, Payne F, Nutland S, Stevens H, Tuomilehto-Wolf E, et al. A comprehensive, statistically powered analysis of GAD2 in type 1 diabetes. Diabetes. 2002;51:2866–2870. doi: 10.2337/diabetes.51.9.2866. [DOI] [PubMed] [Google Scholar]
- Kruglyak L, Lander ES. Complete multipoint sib-pair analysis of qualitative and quantitative traits. Am J Hum Genet. 1995;57:439–454. [PMC free article] [PubMed] [Google Scholar]
- Lake SL, Blacker D, Laird NM. Family-based tests of association in the presence of linkage. Am J Hum Genet. 2000;67:1515–1525. doi: 10.1086/316895. [DOI] [PMC free article] [PubMed] [Google Scholar]
- Laprade N, Soghomonian JJ. Gene expression of the GAD67 and GAD65 isoforms of glutamate decarboxylase is differentially altered in subpopulations of striatal neurons in adult rats lesioned with 6-OHDA as neonates. Synapse. 1999;33:36–48. doi: 10.1002/(SICI)1098-2396(199907)33:1<36::AID-SYN4>3.0.CO;2-0. [DOI] [PubMed] [Google Scholar]
- Lawson OJ, Williamson DA, Champagne CM, DeLany JP, Brooks ER, et al. The association of body weight, dietary intake, and energy expenditure with dietary restraint and disinhibition. Obes Res. 1995;3:153–161. doi: 10.1002/j.1550-8528.1995.tb00131.x. [DOI] [PubMed] [Google Scholar]
- Ma YH, Hu JH, Zhou XG, Zeng RW, Mei Z, et al. Transgenic mice overexpressing gamma-aminobutyric acid transporter subtype I develop obesity. Cell Res. 2000;10:303–310. doi: 10.1038/sj.cr.7290057. [DOI] [PubMed] [Google Scholar]
- Martin ER, Monks SA, Warren LL, Kaplan NL. A test for linkage and association in general pedigrees: The pedigree disequilibrium test. Am J Hum Genet. 2000;67:146–154. doi: 10.1086/302957. [DOI] [PMC free article] [PubMed] [Google Scholar]
- Matthews DR, Hosker JP, Rudenski AS, Naylor BA, Treacher DF, et al. Homeostasis model assessment: Insulin resistance and beta-cell function from fasting plasma glucose and insulin concentrations in man. Diabetologia. 1985;28:412–419. doi: 10.1007/BF00280883. [DOI] [PubMed] [Google Scholar]
- Niswender KD, Morrison CD, Clegg DJ, Olson R, Baskin DG, et al. Insulin activation of phosphatidylinositol 3-kinase in the hypothalamic arcuate nucleus: A key mediator of insulin-induced anorexia. Diabetes. 2003;52:227–231. doi: 10.2337/diabetes.52.2.227. [DOI] [PubMed] [Google Scholar]
- Ovesjo ML, Gamstedt M, Collin M, Meister B. GABAergic nature of hypothalamic leptin target neurons in the ventromedial arcuate nucleus. J Neuroendocrinol. 2001;13:505–516. doi: 10.1046/j.1365-2826.2001.00662.x. [DOI] [PubMed] [Google Scholar]
- Price RA, Li WD, Bernstein A, Crystal A, Golding EM, et al. A locus affecting obesity in human chromosome region 10p12. Diabetologia. 2001;44:363–366. doi: 10.1007/s001250051627. [DOI] [PubMed] [Google Scholar]
- Pu S, Jain MR, Horvath TL, Diano S, Kalra PS, et al. Interactions between neuropeptide Y and gamma-aminobutyric acid in stimulation of feeding: A morphological and pharmacological analysis. Endocrinology. 1999;140:933–940. doi: 10.1210/endo.140.2.6495. [DOI] [PubMed] [Google Scholar]
- Reich DE, Cargill M, Bolk S, Ireland J, Sabeti PC, et al. Linkage disequilibrium in the human genome. Nature. 2001;10:199–204. doi: 10.1038/35075590. [DOI] [PubMed] [Google Scholar]
- Risch N. Linkage strategies for genetically complex traits. III. The effect of marker polymorphism on analysis of affected relative pairs. Am J Hum Genet. 1990;46:242–253. [PMC free article] [PubMed] [Google Scholar]
- Rolandsson O, Hagg E, Hampe C, Sullivan EP, Nilsson M, et al. Glutamate decarboxylase (GAD65) and tyrosine phosphatase-like protein (IA-2) autoantibodies index in a regional population is related to glucose intolerance and body mass index. Diabetologia. 1999;42:555–559. doi: 10.1007/s001250051194. [DOI] [PubMed] [Google Scholar]
- Rorsman P, Berggren PO, Bokvist K, Ericson H, Mohler H, et al. Glucose-inhibition of glucagon secretion involves activation of GABAA-receptor chloride channels. Nature. 1989;341:233–236. doi: 10.1038/341233a0. [DOI] [PubMed] [Google Scholar]
- Saar K, Geller F, Ruschendorf F, Reis A, Friedel S, et al. Genome scan for childhood and adolescent obesity in German families. Pediatrics. 2003;111:321–327. doi: 10.1542/peds.111.2.321. [DOI] [PubMed] [Google Scholar]
- Schreiber E, Matthias P, Muller MM, Schaffner W. Rapid detection of octamer binding proteins with ‘mini-extracts,’ prepared from a small number of cells. Nucleic Acids Res. 1989;17:6419. doi: 10.1093/nar/17.15.6419. [DOI] [PMC free article] [PubMed] [Google Scholar]
- Schwartz MW, Woods SC, Seeley RJ, Barsh GS, Baskin DG, et al. Is the energy homeostasis system inherently biased toward weight gain. Diabetes. 2003;52:232–238. doi: 10.2337/diabetes.52.2.232. [DOI] [PubMed] [Google Scholar]
- Sham PC, Curtis D. Monte Carlo tests for associations between disease and alleles at highly polymorphic loci. Ann Hum Genet. 1995;59:97–105. doi: 10.1111/j.1469-1809.1995.tb01608.x. [DOI] [PubMed] [Google Scholar]
- Shi Y, Kanaani J, Menard-Rose V, Ma YH, Chang P, et al. Increased expression of GAD65 and GABA in pancreatic β-cells impairs first-phase insulin secretion. Am J Physiol Endocrinol Metab. 2000;279:684–694. doi: 10.1152/ajpendo.2000.279.3.E684. [DOI] [PubMed] [Google Scholar]
- Steinle NI, Hsueh WC, Snitker S, Pollin TI, Sakul H, et al. Eating behavior in the Old Order Amish: Heritability analysis and a genome-wide linkage analysis. Am J Clin Nutr. 2002;75:1098–1106. doi: 10.1093/ajcn/75.6.1098. [DOI] [PubMed] [Google Scholar]
- Stephens M, Smith NJ, Donnely P. A new statistical method for haplotype reconstruction from population data. Am J Hum Genet. 2001:978–989. doi: 10.1086/319501. [DOI] [PMC free article] [PubMed] [Google Scholar]
- Stunkard AJ, Messick S. The three-factor eating questionnaire to measure dietary restraint, disinhibition and hunger. J Psychosom Res. 1985;29:71–83. doi: 10.1016/0022-3999(85)90010-8. [DOI] [PubMed] [Google Scholar]
- Sun L, Cox NJ, McPeek MS. A statistical method for identification of polymorphisms that explain a linkage result. Am J Hum Genet. 2002;70:399–411. doi: 10.1086/338660. [DOI] [PMC free article] [PubMed] [Google Scholar]
- Verge CF, Stenger D, Bonifacio E, Colman PG, Pilcher C, et al. IA-2 autoantibody, GAD autoantibody, insulin autoantibody, cytoplasmic islet cell antibodies in type 1 diabetes: Combinatorial Islet Autoantibody Workshop. Diabetes. 1998;47:1857–1866. doi: 10.2337/diabetes.47.12.1857. [DOI] [PubMed] [Google Scholar]
- Vionnet N, El-Hani H, DuPont S, Gallina S, Francke S, et al. Genomewide search for type 2 diabetes-susceptibility genes in French whites: Evidence for a novel susceptibility locus for early-onset diabetes on chromosome 3q27-qter and independent replication of a type 2 diabetes locus on chromosome 1q21-q24. Am J Hum Genet. 2000;67:1470–1480. doi: 10.1086/316887. [DOI] [PMC free article] [PubMed] [Google Scholar]
- Walsh T, Walsh V, Vreugde S, Hertzano R, Shahin H, et al. From flies' eyes to our ears: Mutations in a human class III myosin cause progressive nonsyndromic hearing loss DFNB30. Proc Natl Acad Sci U S A. 2002;99:7518–7523. doi: 10.1073/pnas.102091699. [DOI] [PMC free article] [PubMed] [Google Scholar]
- Wang GJ, Volkow ND, Logan J, Pappas NR, Wong CT, et al. Brain dopamine and obesity. Lancet. 2001;357:354–357. doi: 10.1016/s0140-6736(00)03643-6. [DOI] [PubMed] [Google Scholar]
- Weets I, van Autreve J, van der Auwera BJ, Schuit FC, Du Caju MV, et al. Male-to-female excess in diabetes diagnosed in early adulthood is not specific for the immune-mediated form nor is it HLA-DQ restricted: Possible relation to increased body mass index. Diabetologia. 2001;44:40–47. doi: 10.1007/s001250051578. [DOI] [PubMed] [Google Scholar]
- Zaykin DV, Westfall PH, Young SS, Karnoub MC, Wagner J, et al. Testing association of statistically inferred haplotypes with discrete and continuous traits in samples of unrelated individuals. Hum Hered. 2002;53:79–91. doi: 10.1159/000057986. [DOI] [PubMed] [Google Scholar]
- Zhao JH, Curtis D, Sham PC. Model-free analysis and permutation tests for allelic associations. Hum Hered. 2000;50:133–139. doi: 10.1159/000022901. [DOI] [PubMed] [Google Scholar]


