

Abstract
Sarcoidosis is a systemic granulomatous disease associated with local epithelioid granulomas, CD4+ T cells, and Th1 cytokines. The tissue Ags that drive this granulomatous inflammation are uncertain. In this study, we used IFN-γ-ELISPOT assays and flow cytometry to assess lung and blood T cell responses to the candidate pathogenic Ag, Mycobacterium tuberculosis catalase-perox-idase (mKatG) in patients with sarcoidosis from two centers. Despite differences in patient phenotypic, genetic, and prognostic characteristics, we report that T cell responses to mKatG were remarkably similar in these cohorts, with higher frequencies of mKatG-reactive, IFN-γ-expressing T cells in the blood of sarcoidosis patients compared with nontuberculosis sensitized healthy controls, and (in a subset) in greater numbers than T cells reactive to purified protein derivative. In sarcoidosis, mKatG-reactive CD4+ Th1 cells preferentially accumulated in the lung, indicating a compartmentalized response. Patients with or without Löfgren syndrome had similar frequencies of mKatG specific IFN-γ-expressing blood T cells. Circulating mKatG-reactive T cells were found in chronic active sarcoidosis but not in patients with inactive disease. Together, these results demonstrate that T cell responses to mKatG in sarcoidosis fit a profile expected for a pathogenic Ag, supporting an immunotherapeutic approach to this disease.
Sarcoidosis is a systemic disease characterized by noncaseating epithelioid granulomatous inflammation with pulmonary involvement in over 90% of patients (1). There is remarkable heterogeneity in disease manifestations and clinical course within the spectrum of sarcoidosis. For example, patients with Löfgren syndrome manifest acute inflammation (erythema nodosum, bilateral hilar adenopathy, ankle arthritis) and have a remission rate of 70–80% (2). Other patients have unremitting, multiorgan granulomatous inflammation that may be associated with progressive fibrosis and organ failure. The frequency of sarcoidosis and its different clinical manifestations of sarcoidosis varies from different geographic areas and ethnic or racial groups (3). In Sweden, the annual incidence of sarcoidosis is estimated at 64/100,000 and Löfgren syndrome is diagnosed in ~40% of patients (2). In the U.S., the overall annual incidence is higher in black Americans (35/100,000) compared with white Americans (11/100,000) with chronic or fatal sarcoidosis more common among black Americans (3). Overall, fewer than 5–10% of sarcoidosis patients in the U.S. are diagnosed with Löfgren syndrome (3, 4).
Despite the tremendous clinical heterogeneity, there are immunologic hallmarks that are characteristic of sarcoidosis (5). These features include the presence of mononuclear cell inflammation at sites of epithelioid granulomas, with a predominance of CD4+ over CD8+ T cells (6). At sites of inflammation, there is an associated highly polarized Th1 response with enhanced expression of IFN-γ, Th1-promoting cytokines (IL12 and IL18), and Th1-associated chemokines and chemokine receptors (7-11). Cytokines such as TNF, IL6, and IL1β are expressed at sites of granulomas and orchestrate the granulomatous inflammation in concert with T cell derived cytokines as shown in various experimental models (12). Direct human evidence of the critical role for CD4+ T cells and polarized Th1 immunity in sarcoidosis is provided by the association of sarcoidosis with Th1-promoting biologic response modifiers (e.g., IFNα, IL2, IFNβ) and immune reconstitution in HIV+ patients undergoing highly active antiretroviral therapy (13, 14). Although polarized Th1 immunity appears to be a necessary feature of sarcoidosis, the tissue Ags driving local Th1 responses in sarcoidosis have remained uncertain (15).
Evidence that the granulomatous response is driven by tissue Ags in sarcoidosis is provided by analysis of TCR expression (16). Multiple studies have described oligoclonal expansions of TCR-αβ+ T cells in sarcoidosis in the lung, blood or tissues consistent with an Ag-driven immune process (17-19). For example, in sarcoidosis patients from Sweden, there is a remarkable accumulation of CD4+ TCR-AV2S3+ T cells in the lungs of HLA-DRB1*0301+ patients (18). Several studies report that oligoclonal populations of TCR-αβ+ T cells have similarities in the CDR3 regions of the α- or β-chains, indicating selection by a conventional antigenic stimulus (20, 21). Approaches to determine the antigenic specificities of the biased, oligoclonal TCR specific populations in sarcoidosis have been unsuccessful to date.
Recently, using a novel proteomic approach to identify potential pathogenic tissue Ags, we identified a specific mycobacterial protein, the catalase-peroxidase protein (mKatG),4 in 55% of sarcoidosis tissues and that was the target of circulating IgG in 48% of sarcoidosis patients (22). This approach capitalized on the assumption that a pathogenic “sarcoidosis” Ag would be a poorly soluble component of the sarcoidosis granulomas but otherwise required no a priori hypothesis regarding whether disease relevant Ags would be derived from foreign or endogenous proteins. The identification of mKatG protein as a candidate pathogenic Ag followed multiple studies that reported the presence of mycobacterial DNA in 0–80% of sarcoidosis tissues using PCR technologies (23). The conclusion that mycobacterial organisms are etiologically linked to sarcoidosis has remained controversial despite these studies due to the marked variability in results from different centers and the lack of corroborating evidence for specific mycobacterial Ags involved in driving the granulomatous inflammation (24). Recently, several reports have documented T cell responses to select mycobacterial proteins or peptides including a single mKatG peptide in peripheral blood of subsets of patients with sarcoidosis (25-27). Whether these mycobacterial peptides are relevant to the pathogenesis of sarcoidosis has remained uncertain given the lack of evidence that the respective proteins or peptides are present in sarcoidosis tissues and whether T cell responses to these proteins are regulated in a manner expected for pathogenic Ags.
In this study, we set out to test the hypothesis that mKatG is a specific pathogenic Ag in sarcoidosis by assessing the T cell responses to this Ag in two cohorts of sarcoidosis patients (from the U.S. and Sweden) characterized by markedly different phenotypic, genetic, and prognostic profiles. Despite these differences, our studies reveal that T cell responses to mKatG are remarkably similar in both cohorts, with mKatG reactive, IFN-γ-expressing T cells circulating in subsets of patients in higher proportions than in non-Mycobacterium tuberculosis sensitized control subjects, in higher frequency than T cells reactive to PPD, with the preferential accumulation of mKatG-reactive CD4+ Th1 cells in lung, and with persistent mKatG specific T cell responses in patients with active disease but not in those patients with inactive disease. Together, these findings demonstrate that T cell responses to mKatG are regulated in a manner expected for a pathogenic Ag in sarcoidosis, providing a scientific foundation to consider Ag-specific immunotherapeutic approaches to this disease.
Materials and Methods
Study population
Clinical samples were obtained from patients with sarcoidosis recruited from specialized clinics or hospitals of the Johns Hopkins University in the U.S. or the Karolinska Institutet in Sweden. A diagnosis of sarcoidosis was established either by tissue biopsy or by initial manifestations consistent with Löfgren syndrome (erythema nodosum and/or acute arthritis, hilar lymphadenopathy) without alternative diagnoses according to world-wide consensus criteria (1). Demographic characteristics of these patient groups are summarized in Table I. Based on clinical manifestations, chest radiograph, and pulmonary function tests, patients were classified as having active sarcoidosis or “inactive” disease, defined by resolution of disease manifestations or absence of disease progression off all therapy for at least 1 year (28). Untreated patients were those who had not received systemic therapy within 3 mo of the time of study. Control subjects included healthy individuals with documented skin testing to purified protein derivative (PPD) within the past year or with a self-reported prior history of vaccination with Bacillus Calmette-Guérin (BCG). PPD skin testing was performed in accordance with accepted criteria used in the respective countries. In the U.S., subjects received an intradermal injection of five tuberculin units of PPD (Tubersol, Aventis Pasteur); induration of ≥10 mm at 48–72 h was considered a positive skin test response (29). In Sweden, subjects received an intradermal injection of two tuberculin units of PPD; induration ≥6 mm at 72 h was considered a positive test. All study subjects participated voluntarily and provided informed consent under protocols approved by the local institutional review board. HLA class II (HLA-DR) genotyping of Swedish patients was determined by PCR using sequence-specific primers as previously described (30).
Table I.
Clinic characteristics of study subjects
| United States | Sweden | |
|---|---|---|
| Sarcoidosis patients | ||
| Total | 99 | 51 |
| Female | 57 | 16 |
| Male | 42 | 35 |
| Mean age (years) | 46.0 | 43.2 |
| CXR stage 0/I/II/III/IVa | 7/18/51/17/5 | 2/25/16/6/2 |
| BAL cell differential (%) | n = 30 | n = 51 |
| Macrophages | 58.2 ± 3.8 | 64.7 ± 2.6 |
| Lymphocytes | 36.6 ± 3.6 | 32.2 ± 2.6 |
| CD4/CD8 ratiob | 5.7 (0.5–12.9) | 5.5 (0.6–25.7) |
| Neutrophils | 3.4 ± 2.0 | 2.2 ± 0.7 |
| Eosinophils | 0.5 ± 0.2 | 0.9 ± 0.2 |
| Healthy control subjects | ||
| Total | 33 | 20 |
| Female | 18 | 14 |
| Male | 15 | 6 |
| Mean age (years) | 34.5 | 29.4 |
Scadding CXR stage: 0 = no adenopathy, no lung infiltrates; stage I = hilar adenopathy only; stage II = hilar adenopathy + lung infiltrates; stage III = lung infiltrates only; stage IV = pulmonary fibrosis.
Median (range).
Reagents
Recombinant Mtb KatG protein was isolated and prepared using an Escherichia coli UM255 strain overexpression system carrying a plasmid construct pYZ56 containing the wild-type M. tuberculosis katG gene in a 2.9 kD EcoRV-KpnI fragment in pUC19 vector (31). The culture was grown in LB medium containing 100 μg/ml ampicillin and agitated overnight at 37°C. The cells were harvested by centrifugation at 4000 × g for 15 min at 4°C. Cell pellets were resuspended in 100 ml of 10 mM phosphate buffer (Na2HPO4 and NaH2PO4 and 0.5 mM EDTA) (pH 6.0) and sonicated with three 30 s bursts at full power. Insoluble material was removed by centrifugation at 12000 × g, 4°C for 30 min. The supernatant was harvested for further purification by ammonium sulfate precipitation, and the protein was harvested by centrifugation at 12000 × g for 30 min. The pellet was resuspended in the phosphate buffer and dialyzed against the same buffer at 4°C overnight and then assayed for peroxidase and catalase activity. The active fractions were further purified by gel filtration chromatography. A Superdex 200 gel filtration column (Pharmacia) was equilibrated with the phosphate buffer overnight. The catalase containing fractions were loaded onto the column with a flow rate of 0.2 ml/min. Fractions (1 ml) were collected and assayed for peroxidase and catalase activity. Active fractions were assessed for purity by SDS-PAGE, pooled, and then dialyzed against the above phosphate buffer at 4°C overnight (32). The purified KatG protein was at least 95% pure. The protein was kept at −80°C for long term storage and −20°C for short term (<2 mo) between immunological studies.
Human cell preparations
PBMC were prepared according to established protocols used by each institution (33, 34). In the U.S., PBMCs isolated by Ficoll-Paque (GE Health-care) density gradient centrifugation were resuspended in complete medium (RPMI 1640, 10% pooled human AB serum (Sigma-Aldrich), 1% penicillin-streptomycin (Biosource)). In Sweden, Ficoll-isolated PBMC were resuspended in complete tissue culture medium (CTCM) (RPMI 1640 with HEPES, 10% FCS, 1% penicillin-streptomycin, and 1% l-glutamine).
Lung mononuclear cells obtained from bronchoalveolar lavage (BAL) were prepared according to established protocols used by each institution as approved by their respective institutional review board, with differences as noted (8, 35). Flexible bronchoscopy was performed using topically applied lidocaine after premedication with i.v. fentanyl and midazolam (U.S.) or morphine-hyoscine (Morfin-skopolamin, Meda) i.m. (Sweden). BAL was initiated by wedging the bronchoscope in one of the subsegments of the right middle lobe or lingula, and lavage performed with five 30 ml (U.S.) or five 50 ml aliquots (Sweden). Excess BAL fluid not needed for clinical purposes was immediately transported to the laboratory. BAL cells were washed with PBS, resuspended in complete medium and counted by hemocytometer. Total cell viability was determined by Trypan blue exclusion. Differential counts were established from cytospin preparations (Shandon) using a modified Giemsa stain, with a minimum of 500 cells counted per sample.
ELISPOT assay
Ag-specific stimulation of T cells was assessed by an ELISPOT assay specific for human IFN-γ with technical differences as noted between the two sites. In the U.S., assays were performed using reagents and methods as recommended by the manufacturer (Cell Sciences). In brief, 96-well polyvinylidene fluoride-bottomed-well plates (Millipore) were coated with capture Ab overnight at 4°C and then blocked with 1% BSA in PBS for 2 h at room temperature. Equal numbers of PBMC (5 × 10⁵ cells/well) or BAL cells (1 × 10⁵ cells/well) were loaded into duplicate wells. Cells were incubated at 37°C in a humidified CO2 incubator for 18–22 h in either complete medium alone, mKatG (10 μg/ml), PPD (10 μg/ml), or positive control PHA (10 μg/ml). The number of spot forming cells (sfc) was detected using BCIP/NBT substrate and enumerated by visual inspection with 10× magnification by a reader blinded to all subject information (36).
In Sweden, assays were performed using reagents and methods as recommended by the manufacturer (Mabtech AB). In brief, 96-well polyvinylidene fluoride plates (Mabtech AB) were coated with capture Ab overnight at 4°C. After washing with PBS, plates were blocked with CTCM. Equal numbers of PBMC (3 × 10⁵) or BAL cells (2 × 10⁵) were loaded into wells in triplicate and incubated in CTCM with or without Ag (mKatG 10 μg/ml, PPD 10 μg/ml, or PHA 1 μg/ml) at 37°C for 22 h. IFN-γ sfc were detected using BCIP/NBT substrate and enumerated using an AID ELISPOT Reader system with AID ELISPOT Software 2.1 (AID Diagnostika).
At both sites, results were calculated as a mean value from replicate wells, and normalized to sfc per 106 cells. Ag-specific responses (PPD or mKatG) were calculated by subtracting sfc of medium control wells from the specific Ag result. For each subject, a “positive” ELISPOT response in the blood required that the number of Ag specific sfc was greater than or equal to twice the background (medium) sfc and that the difference of Ag specific sfc minus background sfc was greater than the upper 95th percentile of Ag specific responses from all PPD− subjects from the respective sites.
Flow cytometry
Intracellular cytokine staining for IFN-γ expression was performed to characterize Ag-specific lymphocyte responses. In brief, PBMC or BAL cells were incubated in polypropylene tubes for 6 h at 37°C in complete medium with or without Ag (mKatG, 20 μg/ml) or staphylococcal enterotoxin B (SEB, 1 μg/ml) as positive control (Toxin Technology). Brefeldin A (10 μg/ml) (Sigma-Aldrich) was added for the final 4 h of culture as described previously (37). Cells were harvested and specific T cell subsets were identified using fluorochrome-labeled mAbs against lymphocyte surface markers from BD Biosciences (CD3 clone UCHT1, CD4 clone RPA-T4, CD8 clone SK1). Surface-stained cells were fixed in 4% paraformaldehyde, permeablized with 0.1% saponin, and intracellular cytokine expression was determined using allophycocyanin-labeled Ab against human IFN-γ (clone B27) with comparison made using a nonspecific isotype control Ab (clone MOPC-21) labeled with the same fluorochrome. Data were acquired with CellQuest software (BD Biosciences) using a FACSCalibur multiparameter flow cytometer (BD Biosciences) and analyzed using FlowJo software (Tree Star). Viable lymphocytes were gated by forward and side scatter characteristics, and analysis was performed on 200–300 × 103 acquired events for each sample (38). Ag-specific IFN-γ expression was normalized against spontaneous cytokine expression in medium alone, calculated as % IFN-γ+ cells in response to KatG minus % IFN-γ+ cells in medium alone.
To assess Ag-specific proliferation, PBMC and BAL cells were labeled with 0.625 μM CFSE (Molecular Probes) before antigenic stimulation and loaded into a 48-well plate (1 × 10⁶ cells/ml). Cells were incubated at 37°C in complete medium with or without Ag (mKatG 20 μg/ml, or SEB 1 μg/ml). Cells were harvested on day 6, stained with lymphocyte surface markers (CD3, CD4, CD8; see above), and cell fluorescence intensity was immediately measured within T cell subsets using a FACSCalibur cytometer. Ag-specific proliferation was indicated by decreased CFSE fluorescence intensity. Percentages of T cell proliferation were calculated from gates demarcating CFSEhigh (undivided parent population) and CFSElow (divided progeny population) using positive (SEB) and negative (medium) controls. Results were normalized against spontaneous proliferation in medium alone, calculated as percent proliferation to mKatG minus percent proliferation to medium alone.
BAL cells from sarcoidosis patients from Sweden were stained with TCR-AV2S3-specific Ab clone F1 (Pierce Biotechnology) as previously described (30).
Statistics
Statistical analyses were performed using either JMP software version 5.0.1 (SAS Institute) or GraphPad Prism 5 (GraphPad Software). Group comparisons of unpaired quantitative data were performed using the Kruskal-Wallis test followed by individual comparisons using the Mann-Whitney U test. Paired analyses were performed by the paired Mann-Whitney U test. Results of nonparametric correlation analysis are expressed using the Spearman coefficient (rs) with p values determined by a 2-tailed test. Categorical data were analyzed using the 2-tailed Fisher’s exact test. A p value of <0.05 was considered significant.
Results
Circulating T cells reactive to mKatG are found in sarcoidosis patients from the U.S. and Sweden
To determine the profile of Ag-specific T cell responses in sarcoidosis patients to the candidate pathogenic Ag mKatG, T cell reactivity to recombinant mKatG was determined by ELISPOT using PBMC isolated from untreated patients with active sarcoidosis, healthy volunteers with a negative PPD skin test or no history of BCG vaccination (PPD−/BCG−, hereafter called PPD− subjects) or volunteers with a positive PPD skin test or a history of BCG vaccination (PPD+/BCG+, hereafter called PPD+ subjects). In the U.S. center, we found a significantly higher proportion of mKatG-reactive T cells in PBMC from patients with sarcoidosis compared with PPD− subjects (median frequency: 14 vs 2 sfc per 106 cells, p = 0.026) (Fig. 1A). There was no difference in the proportion of mKatG-reactive T cells in sarcoidosis compared with a group of PPD+ subjects (median freq. 14 vs 20 sfc/106 cells, p = 0.899). In Sweden, the median proportion of mKatG-reactive T cells from sarcoidosis patients was higher than that from PPD− subjects from this site, though this difference was not statistically different (median freq. 28 vs 10 sfc/106 cells, p = 0.077) (Fig. 1A). As in the U.S., there was no difference between sarcoidosis patients and PPD+ subjects from Sweden (median freq. 28 vs 33 sfc/106 cells, p = 0.697). Overall, pair-wise analyses demonstrated that the different subject groups (PPD−, sarcoidosis, PPD+) from the respective sites were not significantly different from each other. When subjects from both sites were combined, the difference between PPD− subjects and sarcoidosis patients was highly significant (p = 0.008) whereas there was no difference between sarcoidosis and PPD+ subjects (p = 0.545, Fig. 1B).
FIGURE 1.
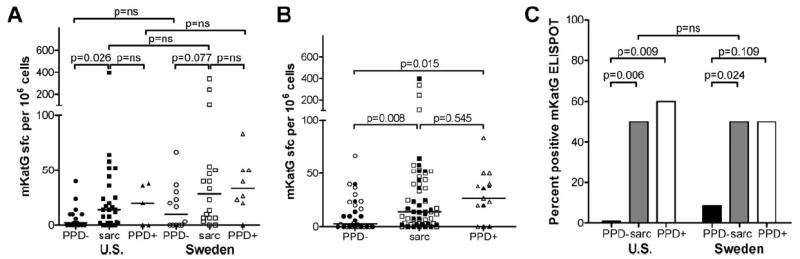
Ex vivo T cell reactivity to mKatG in blood from patients with active untreated sarcoidosis and healthy PPD− or PPD+ subjects. PBMC were stimulated with recombinant mKatG and the number of IFN-γ-producing cells was measured by ELISPOT (see Materials and Methods). A, Dot plots represent mean number of IFN-γ-producing cells in mKatG wells minus negative control wells per 106 PBMC from individual subjects from the U.S. or Sweden as detailed in Materials and Methods; group medians indicated by horizontal lines. B, Dot plots of combined data from the U.S. (filled symbols) and Sweden (open symbols). C, Graph showing proportion of “positive” mKatG responders for each site, defined by samples with a frequency of mKatG-reactive T cells greater than two times media control wells and the absolute number of mKatG-reactive T cells (minus background) exceeding the upper 95% confidence interval level of mKatG responses from PPD− subjects from their respective sites (U.S.>13 sfc/106 PBMC; SE >30 sfc/106 PBMC).
Given the differences in patient demographics and clinical phenotypes between the two sites (Table I), we assessed the operating characteristics of an mKatG ELISPOT test by defining a “positive” mKatG responder as a subject with a frequency of mKatG reactivity greater than two times media control and greater than the upper 95th confidence interval of the PPD- control groups from the respective sites (U.S. >13 sfc/106 PBMC; Sweden >30 sfc/106 PBMC). Using this criteria, we found that the overall proportions of positive mKatG responders in sarcoidosis patients from both the U.S. and Sweden were strikingly similar (both groups 50%, p = ns) and significantly higher than the proportion of responders in PPD− subjects from the U.S. or Sweden (p < 0.05, each comparison) (Fig. 1C).
T cell reactivity to mKatG is not correlated with T cell reactivity to PPD in sarcoidosis
The increased frequency of mKatG reactive, IFN-γ-producing T cells in the blood of sarcoidosis patients suggests prior exposure to mycobacterial organisms. To investigate whether mKatG is a dominant Ag or is accompanied by responses to other mycobacterial Ags, we analyzed the ex vivo proportions of IFN-γ-producing PBMC responsive to PPD in which mKatG is a minor component. As expected, PPD+ subjects were characterized by higher proportion of IFN-γ-producing PBMC in response to PPD compared with PPD− subjects from both the U.S. (p = 0.002) and Sweden (p = 0.019) (Fig. 2A). There were no significant differences between PPD responses in the sarcoidosis patients compared with PPD− subjects from the individual sites. In the U.S., the median T cell response to PPD was higher in the PPD+ subjects than in sarcoidosis patients (p = 0.004); in contrast, there was no difference in the T cell reactivity to PPD between sarcoidosis patients and PPD+ subjects from Sweden (p = 0.107) (Fig. 2A). Sarcoidosis patients from Sweden were characterized by higher T cell reactivity to PPD than in patients from the U.S. (p = 0.0005).
FIGURE 2.
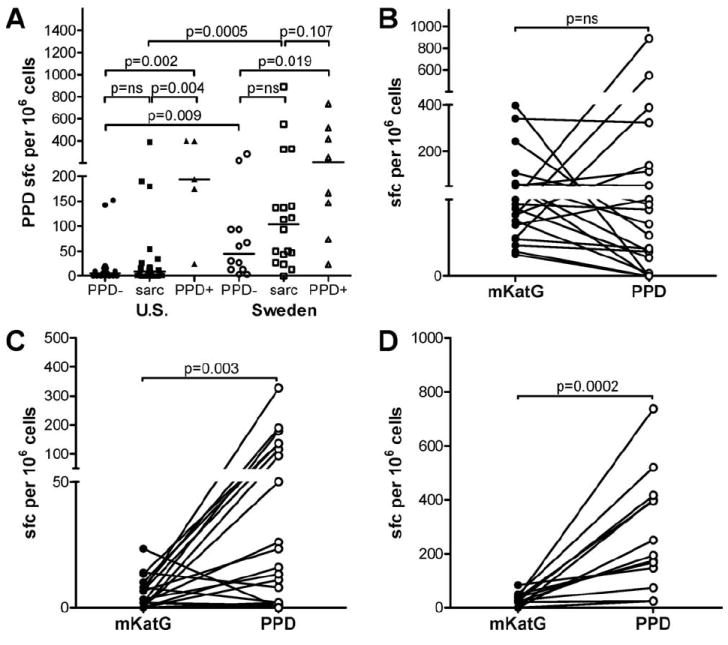
Ex vivo T cell reactivity to PPD in blood from patients with active sarcoidosis and healthy PPD− or PPD+ subjects. PBMC were stimulated with PPD and the number of IFN-γ-producing PBMC was measured by ELISPOT. A, Dot plots represent mean number of IFN-γ-producing cells in PPD wells minus negative control wells per 106 PBMC from individual subjects from the U.S. or Sweden; group medians indicated by horizontal lines. B–D, Paired analysis of mKatG (filled symbols) and PPD (open symbols) responses for individual subjects. Data are grouped for patients with sarcoidosis and positive mKatG responses as defined in Fig. 1 and Materials and Methods (B), sarcoidosis patients with negative mKatG responses (C), or PPD+ subjects (D).
When paired mKatG and PPD responses in both patient cohorts were examined, a dichotomy between T cell reactivity to mKatG and PPD was seen in sarcoidosis patients (Fig. 2, B and C). Within the group of sarcoidosis patients with a “positive” mKatG ELISPOT (as defined in Fig. 1, Materials and Methods), 14/21 (67%) patients had higher proportions of circulating T cells reactive to mKatG than PPD suggesting that mKatG is a dominant mycobacterial Ag in this subset of patients (Fig. 2B). The remaining sarcoidosis patients in this group (7/21) had higher T cell reactivity to PPD than mKatG, though they also had positive mKatG responses. Within the group of sarcoidosis patients with a “negative” mKatG ELISPOT, 16/21 (76%) patients had higher proportions of circulating T cells reactive to PPD than mKatG suggesting that mycobacterial Ags other than mKatG elicit dominant T cell responses in this subgroup of patients (Fig. 2C). These differential responses to mKatG and PPD resulted in an overall lack of correlation between PPD responses and mKatG responses in the positive mKatG responder subgroup or when all sarcoidosis patients were grouped together (Spearman coefficient rs = 0.190, p = 0.408). Overall, 34/42 (85%) of sarcoidosis patients had T cell responses to either mKatG or PPD, suggesting an association with mycobacterial exposure in a majority of sarcoidosis patients. PPD+ subjects were uniformly (13/13) characterized by greater T cell reactivity to PPD than mKatG (p = 0.0002), suggesting that mKatG is a minor recall Th1 Ag in these individuals (Fig. 2D).
Compartmentalized enhanced mKatG responses in the lung of patients with pulmonary sarcoidosis
To determine whether mKatG-reactive T cells localize to areas of granulomatous inflammation, we examined lung cells recovered from bronchoalveolar lavage fluid (BAL) in patients with sarcoidosis, over 90% of whom have pulmonary involvement. Overall, we found significantly increased proportions of IFN-γ-producing BAL cells in response to mKatG compared with PBMC from sarcoidosis patients from both the U.S. (median 60 vs 14 sfc/106 cells, p = 0.002) and Sweden (median 270 vs 28 sfc/106 cells, p = 0.013). The median frequency of mKatG-reactive BAL T cells in Swedish patients was greater than that in the U.S, though not statistically different (p = 0.151) (Fig. 3A). When U.S. and Swedish patient groups were combined, the difference between BAL cells and PBMC responses to mKatG was highly significant (median BAL 70 vs PBMC 14 sfc/106 cells, p < 0.0001). In 16 patients with concomitant BAL and PBMC analysis, a paired analysis confirmed the greater frequency of mKatG-reactive T cells in the lung compared with blood (p = 0.0009), consistent with compartmentalization of mKatG-reactive T cells to the lung in sarcoidosis (Fig. 3B). In contrast to the BAL T cell reactivity to mKatG in sarcoidosis, there was no evidence for significant numbers of IFN-γ-producing mKatG-reactive BAL cells above media control wells from three nonsarcoidosis subjects undergoing diagnostic bronchoscopy who had at least 10% lymphocytes in their BAL fluid (mean ± SE: 12 ± 6 sfc/106 cells). The median frequency of T cell reactivity to PPD was also higher in BAL cells compared with PBMC among sarcoidosis patients from both sites, with a higher frequency of PPD-reactive BAL cells from sarcoidosis patients from Sweden compared with the U.S. (255 vs 50 sfc/106 cells, p = 0.009) (Fig. 3C). However, unlike the response to mKatG, T cell responses to PPD did not show a significant difference between the lung and blood (p = 0.168), suggesting T cells reactive to mycobacterial Ags other than mKatG have a reduced potential to localize in the lung compared with mKatG (Fig. 3D).
FIGURE 3.
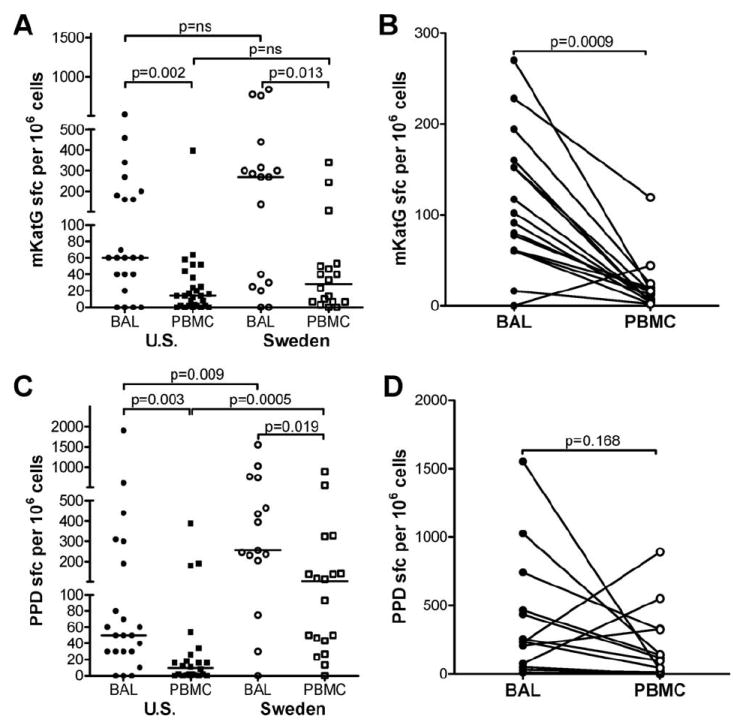
Higher T cell reactivity to mKatG in the lung than blood from patients with sarcoidosis. BAL cells or PBMC were stimulated with mKatG (A and B) or PPD (C and D) and the number of IFN-γ-producing cells was measured by ELISPOT. A and C, Dot plots represent mean number of IFN-γ-producing cells in mKatG (A) or PPD (C) wells minus negative control wells per 106 total BAL cells or PBMC from individual subjects from the U.S. (closed symbols) or Sweden (open symbols); group medians indicated by horizontal lines. B and D, Analysis of T cell reactivity to mKatG (B) or PPD (D) from paired samples of BAL cells (●) and PBMC (○) obtained from individual patients as indicated by a joining line.
Both CD4+ and CD8+ T cells from lung and blood express IFN-γ in response to mKatG
To assess the relative contribution of CD4+ vs CD8+ T cells in the IFN-γ-expressing mKatG specific responses enumerated by ELISPOT assay, PBMC and BAL cells from sarcoidosis patients and healthy control subjects (U.S. only) were stained for intracellular IFN-γ expression after 6 h incubation with mKatG (Fig. 4, A–D). PBMC from PPD− subjects expressed low or undetectable mKatG responses in both CD4+ and CD8+ subsets (Fig. 4, A and C). In comparison to PPD− subjects, there were greater proportions of mKatG-reactive CD3+ T cells from both CD4 and CD8 subsets in the blood of sarcoidosis patients. Although the median frequencies of blood CD4+ and CD8+ mKatG-reactive T cells were similar in sarcoidosis patients (Fig. 4C), there was a greater proportion of CD8+ than CD4+ mKatG-reactive, IFN-γ-expressing T cells (measured as percentage of total mKatG-reactive CD3+ blood T cells) (p = 0.002) after accounting for the relative CD4+ lymphopenia typical in sarcoidosis patients (Fig. 4D). In BAL from sarcoidosis patients, both CD4+ and CD8+ T cells reactive to mKatG were detected, with 40% (4 of 10) of patients demonstrating over 0.5% of their total CD3+ T cell repertoire reactive to this Ag (Fig. 4, B and C). We found greater proportions of mKatG-reactive CD4+ T cells in the lung compared with blood (p = 0.05), indicating compartmentalization of mKatG-reactive Th1 cells to the lung (Fig. 4C). This compartmentalization did not extend to the CD8+ T cell subset as there was no difference in the proportions of CD8+ T cells reactive to mKatG in the lung compared with blood (p = 0.655). T cells populations recovered by BAL in sarcoidosis are typified by greater numbers of CD4+ than CD8+ T cells (1, 6). When accounting for the increased CD4+ compared with CD8+ T cells in the lungs of our sarcoidosis patients, the proportion of total CD3+ T cells reactive to mKatG was dominated in all cases by CD4+ Th1 cells (Fig. 4D).
FIGURE 4.
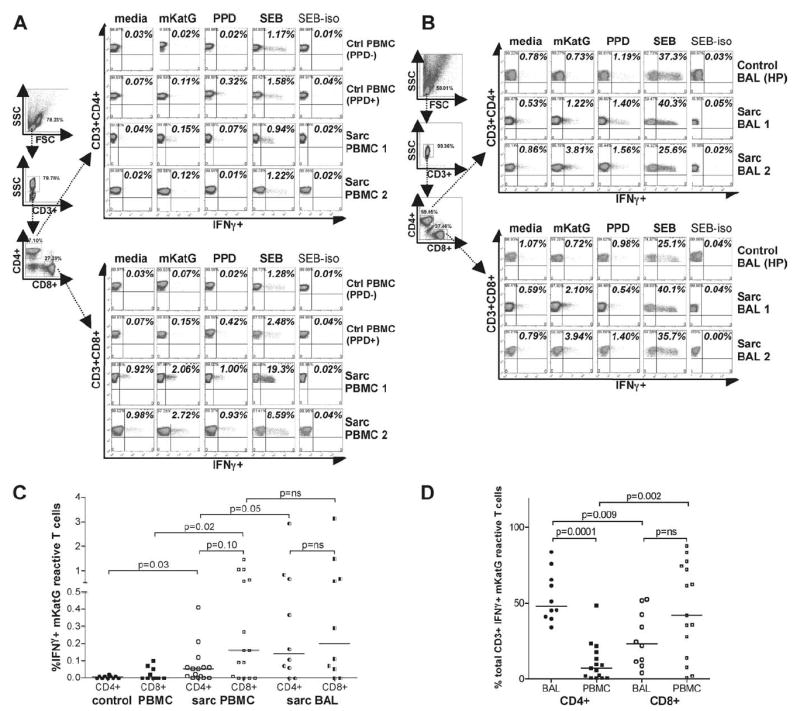
IFN-γ-expressing mKatG-reactive lung and blood T cells derive from both CD4 and CD8 subsets in sarcoidosis. PBMC or BAL cells were incubated for 6 h with medium alone, mKatG, PPD, or SEB, and then intracellularly stained with anti-IFN-γ mAb or isotype control (see Materials and Methods). Dot plots represent percentage of cells expressing IFN-γ within electronically gated populations of CD3+CD4+ and CD3+CD8+ T cells. A, Gating strategy and representative examples of IFN-γ expression in PBMC from a healthy PPD+ subject, healthy PPD− subject, and two patients with sarcoidosis. B, Gating strategy and representative examples of IFN-γ expression in stimulated BAL cells from a control subject with hypersensitivity pneumonitis and two sarcoidosis patients. C, Graph represents percentage of IFN-γ+ T cells in response to mKatG minus media control for PBMC or BAL cells within CD3+CD4+ and CD3+CD8+ subsets. D, Graph represents relative proportion of CD4+ or CD8+ T cells expressing IFNγ in response to mKatG minus media control calculated as a proportion of total CD3+ T cells reactive to mKatG. Horizontal lines depict median percentage of IFN-γ+ T cells reactive to mKatG.
Ag specific lung and blood T cell proliferation to mKatG is dominant in the CD4 T cell subset
To assess the proliferative potential of mKatG-reactive T cells in sarcoidosis, PBMC and BAL T cells were analyzed by flow cytometry for proliferation by monitoring CFSE dilution after 6 days (Fig. 5, A and B). To assess background levels of mKatG proliferation in a control population, eight PPD− subjects from the U.S. were analyzed. These PPD− subjects had low or undetectable levels of CD3+ T cell proliferation to mKatG compared with control conditions (mean 0.13 ± 0.09%, median 0.015%, maximum 0.72% proliferation calculated by subtracting media control from mKatG proliferation). Using this upper range (≥0.72%) as a threshold for determining a significant proliferative response to mKatG, we found that 21/44 (48%) sarcoidosis patients from the U.S. had significant CD3+ blood T cell proliferation to mKatG (median 0.615% proliferation). Proliferation to mKatG was greatest in the CD3+CD4+ compared with CD3+CD8+ T cell subset (median 0.895% vs 0.010%, p < 0.0001) (Fig. 5C).
FIGURE 5.
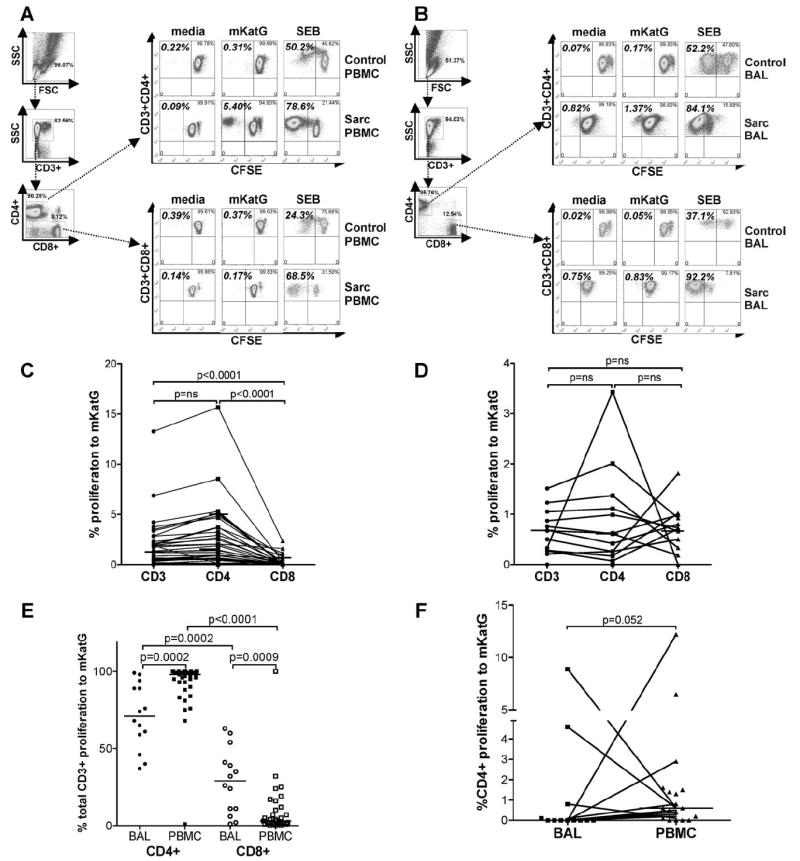
mKatG-induced proliferative responses of CD3+, CD4+ and CD8+ blood and lung T cells in sarcoidosis. PBMC or BAL cells were incubated for 6 days with medium alone, mKatG, or SEB and proliferation assessed by CFSE dilution using flow cytometry as described in Materials and Methods. A and B, Gating strategy and representative examples of CD3+CD4+ and CD3+CD8+T cell proliferation in stimulated PBMC (A) and BAL cells (B) from a control subject (healthy PPD− for PBMC, hypersensitivity pneumonitis for BAL) (top three rows) and a patient with sarcoidosis (bottom three rows). C–F, T cell proliferation in response to mKatG minus media control proliferation of PBMC (C) or BAL cells (D) gated on CD3+, CD3+CD4+, CD3+CD8+ subsets from sarcoidosis patients from the U.S. E, Dot plots represent relative proportion of CD4+ or CD8+ T cell proliferation to mKatG minus media control calculated as a proportion of total CD3+ T cell proliferation in response to mKatG from U.S. patients. F, Dot plots represent relative proportion of CD4+ T cells proliferating to mKatG in BAL and PBMC from patients from Sweden. Horizontal lines depict median percentage of proliferation by each T cell subset.
The proliferative responses of Ag stimulated BAL T cells in sarcoidosis are in general diminished compared with the proliferative responses in blood, likely reflective of a more differentiated memory phenotype for lung T cells (39, 40). In this context, we next determined whether mKatG induces proliferation of BAL T cells in patients with active pulmonary sarcoidosis. In 5 of 14 (36%) patients from the U.S. undergoing diagnostic bronchoscopy, we detected significant proliferation of CD3+ BAL T cells to mKatG (≥ 0.72%) (Fig. 5D). In contrast to circulating blood T cells, there was no difference in the proportion of CD3+CD4+ BAL T cells that were proliferating to mKatG compared with CD3+CD8+ BAL T cells in sarcoidosis patients from the U.S. (Fig. 5D). When accounting for the higher number of CD4+ compared with CD8+ BAL T cells, the relative frequency of CD3+ BAL T cells proliferating to mKatG was greater within the CD4+ T cell subset (median 71% of total CD3+ BAL cells) than the CD8+ T cell subset (29% of total CD3+ proliferating BAL cells) (p = 0.0002) (Fig. 5E). The dominant CD4 response of mKatG-reactive proliferating T cells was even more striking in PBMC when analyzed relative to total CD3+ T cells (median 98% of total CD3+ proliferation) (Fig. 5E).
In Sweden, where only CD4+ T cell proliferation was assessed, sarcoidosis patients demonstrated greater proliferation of CD4+ T cells from the blood than BAL in response to mKatG (p = 0.052) (Fig. 5F). Interestingly, among paired PBMC-BAL samples, there was divergence in the proportions of mKatG-reactive T cells within the two compartments, with 4 of 12 patients demonstrating >1% proliferation of CD4+ T cells in only one of the compartments (Fig. 5F).
Higher proportions of mKatG-reactive BAL cells are present in DRB1*0301+ Swedish sarcoidosis patients and correlate with numbers of AV2S3 BAL T cells
In Sweden, DRB1*0301+ patients are characterized by expansions of TCR-specific AV2S3+ T cells in the lung and a higher likelihood of undergoing disease remission than DRB1*0301− patients (41). DRB1*0301+ sarcoidosis patients from Sweden were found to have higher frequencies of BAL cells producing IFN-γ in response to mKatG than DRB1*0301− patients (median 315 vs 55 sfc/106 PBMC, p = 0.041) (Fig. 6A). In contrast, there was no significant difference noted between these groups in the proportions of mKatG-reactive PBMC in their blood (median 40 vs 27 sfc/106 PBMC, p = 0.311) (Fig. 6A). Responses to mKatG were significantly higher in BAL cells than PBMC in DRB1*0301+ patients, consistent with compartmentalization of mKatG responses to the lung in these patients (Fig. 6A). In contrast to mKatG, there was no significant difference in the frequencies of T cells reactive to PPD within either BAL or PBMC in DRB1*0301+ compared with DRB1*0301− patients (Fig. 6B). We found a significant correlation between the numbers of AV2S3+ BAL T cells and BAL T cells reactive to mKatG (rs = 0.448, p = 0.018) or PPD (rs = 0.413, p = 0.028).
FIGURE 6.
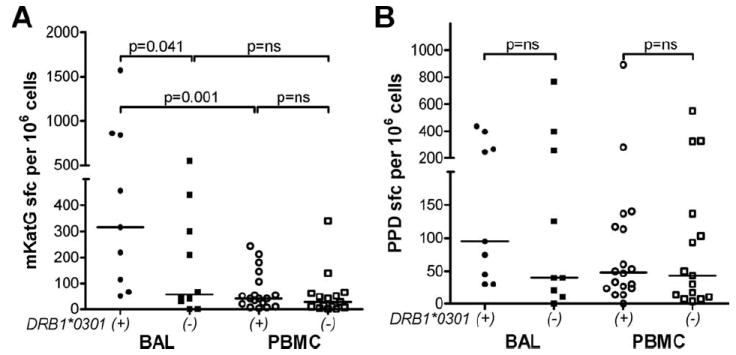
Greater BAL T cell reactivity to mKatG in DRB1*0301+ than DRB1*0301− sarcoidosis patients from Sweden. A and B, BAL cells or PBMC were stimulated with mKatG or PPD and the number of IFN-γ-producing cells was measured by ELISPOT. To reduce the background number of spots in BAL cells, alveolar macrophages were partially depleted by plastic adherence during a 2-hour incubation in medium alone before being added to the ELISPOT plates. Dot plots represent mean number of IFN-γ-producing cells in mKatG (A) or PPD (B) wells minus negative control wells per 106 BAL cells or PBMC from Swedish patients separated into DRB1*0301+ or DRB1*0301− from HLA genotyping as detailed in Materials and Methods.
T cell reactivity to mKatG decreases with treatment or disease inactivity but not disease chronicity
To analyze whether mKatG responses correlate with disease manifestations that are associated with different probabilities of remission, we grouped patients into those with or without manifestations of Löfgren syndrome at time of diagnosis (2). We found no significant difference in the median mKatG responses in either BAL (p = 0.236) or blood (p = 0.378) between these groups (Fig. 7A). Both groups manifested higher median T cell reactivity to mKatG in the lung than blood, though this was not statistically significant in the smaller Löfgren group (p = 0.112).
FIGURE 7.
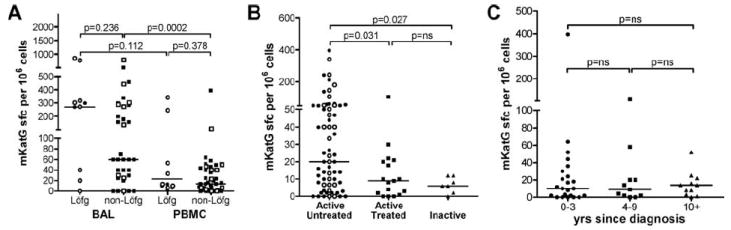
Effect of treatment, disease inactivity, and chronicity of disease on PBMC reactivity to mKatG. PBMC or BAL cells were stimulated with mKatG and the number of IFN-γ-producing PBMC cells was measured by ELISPOT. A, Dot plots represent mean IFN-γ-expressing cells in mKatG wells minus negative control wells per 106 PBMC or BAL from individual subjects from the U.S. (closed symbols) or Sweden (open symbols), grouped according to whether they had manifestations of the Löfgren syndrome (Löfg) or not (non-Löfg) at time of diagnosis as defined in Materials and Methods. B, Dot plots represent mean mKatG reactive PBMC in patients grouped into active untreated vs active treated vs inactive sarcoidosis. C, PBMC mKatG responses determined by ELISPOT in U.S. patients with active disease grouped by time since diagnosis in years with medians as indicated.
To examine whether treatment, disease inactivity, or chronicity influences the frequency of circulating mKatG-reactive T cells, we analyzed PBMC from sarcoidosis patients within these groups. Systemic treatment with corticosteroid or immunosuppressive therapy was associated with reduced proportions of mKatG-reactive, IFN-γ-producing blood T cells compared with untreated patients from the U.S. or the combined U.S. and Swedish cohort (p = 0.031) (Fig. 7B). Strikingly, all sarcoidosis patients who had an absence of manifestations of clinically active disease for at least 1 year were characterized by a lack of circulating mKatG-reactive T cells, suggesting that sarcoidosis patients who have undergone disease remission have few or no mKatG-reactive T cells in their blood (p = 0.027) (Fig. 7B). Because >90% of sarcoidosis patients who undergo disease remission do so within the first 3 years of known disease (1), we analyzed mKatG responses in U.S. patients grouped according to their years of known diagnosis. Importantly, we found no significant differences in the median mKatG responses in the blood of patients with chronic sarcoidosis (known disease >3 years) compared with those patients with <3 yrs of active disease and a higher likelihood of remission (Fig. 7C). The proportion of “positive” mKatG responders remained constant regardless of years of active disease (40–45%), including those with active disease for >10 years (Fig. 7C), consistent with the premise that ongoing mKatG-reactive, IFN-γ-expressing T cell responses are pathogenic in a subset of patients with chronic sarcoidosis.
Discussion
The pathobiologic processes that result in systemic granulomatous inflammation in sarcoidosis remain poorly understood. Immunologic hallmarks of sarcoidosis, featured by the accumulation of CD4+ T cells, oligoclonal TCR-αβ+ expansions and Th1 cytokine production at sites of inflammation provide prima facie evidence that the development of sarcoidosis depends on Ag specific Th1 cells driving this pathologic response (1, 5). By using a novel proteomic approach using sarcoidosis tissues and circulating immunoglobulins, we previously identified the mycobacterium-derived protein, mKatG, as a candidate pathobiologically relevant Ag in this disease (22). In this study, we present direct evidence that the T cell responses to mKatG in sarcoidosis are regulated in a manner expected for a pathogenic Ag. Using IFN-γ-ELISPOT assays, we found striking similarities in the magnitude and prevalence of T cell responses among sarcoidosis patients with active disease from the U.S. and Sweden despite marked differences in underlying disease prevalence, clinical manifestations, and expected clinical outcomes typified by sarcoidosis patients from these two sites. These similarities provide robust validation that mKatG-reactive, IFN-γ-producing effector T cells play a role in a subset of sarcoidosis patients from the U.S. and northern Europe.
Importantly, several findings suggest mKatG is a pathogenic Ag of special relevance in a subset of sarcoidosis patients. First, a subset of patients was characterized by higher proportions of IFN-γ-expressing T cells reactive to mKatG compared with PPD, suggesting that mKatG is a dominant Ag within the T cell repertoire of anti-mycobacterial responses in these patients. Second, CD4+ Th1 cells reactive to mKatG accumulated in the lungs of patients with pulmonary involvement, indicating the trafficking of these Ag specific T cells to a site of granulomatous inflammation. In contrast, there was no apparent selective accumulation of PPD-reactive, IFN-γ-expressing T cells in the lungs of sarcoidosis patients, suggesting that T cells reactive to mycobacterial Ags other than mKatG have a reduced potential to localize to sites of inflammation. Finally, the persistence of mKatG-reactive, IFN-γ-producing T cells in patients with chronic active disease but not in patients who had undergone remission or had inactive disease, provides additional support for the premise that mKatG-specific, IFN-γ-producing T cells are important effector cells that participate in driving chronic granulomatous inflammation.
The finding that a separate subset of sarcoidosis patients had strong ex vivo responses to PPD but lower or absent numbers of mKatG-reactive, IFN-γ-expressing T cells in the blood suggests that mKatG is not the only relevant mycobacterial Ag in sarcoidosis. PPD-reactive T cells in the blood have been previously noted in sarcoidosis patients, with overall weaker proliferative responses in sarcoidosis patients than in healthy control subjects (39, 42). T cell responses to select mycobacterial proteins or derived peptides (ESAT-6, CFP-10, Ag-85, heat shock protein-70) have been recently documented in subgroups of sarcoidosis patients, and it seems likely that some of these Ags could contribute to the repertoire of PPD-reactive, IFN-γ-expressing T cell responses in the blood of patients from our study (25-27). The relevance of these latter mycobacterial proteins in sarcoidosis remains less certain, because they have not been demonstrated in sarcoidosis tissues, nor is it known that CD4+ T cells reactive to these proteins selectively accumulate at sites of inflammation in sarcoidosis or persist in chronic disease.
Our finding that >80% of sarcoidosis patients possess significant numbers of IFN-γ-expressing T cells reactive to either mKatG or PPD indicates that most sarcoidosis patients from our centers were sensitized to mycobacterial Ags before the onset of their disease. Given this high prevalence, it is important to consider possible differences in the repertoire of T cell responses to specific mycobacterial Ags that may contribute to different outcomes following exposure to mycobacterial organisms. Studies of T cell responses to selected sets of mycobacterial Ags in M. tuberculosis infected individuals have usually involved proteins that are highly expressed and secreted (e.g., ESAT-6, CFP-10, Ag-85) and that elicit strong T cell responses in most individuals with active tuberculosis (43). To our knowledge, T cell responses to mKatG have not been evaluated in active tuberculosis. Our finding that PPD+ subjects had circulating mKatG-reactive T cells suggests that T cell memory to mKatG occurs following M. tuberculosis infection or BCG vaccination. However, a paired analysis revealed that PPD+ subjects had greater numbers of T cells reactive to PPD Ags than to mKatG, suggesting that mKatG is a minor T cell Ag in these individuals. The fact that a subset of sarcoidosis patients had significantly greater T cell reactivity to mKatG with little or no reactivity to PPD Ags highlights at least one immune response difference between sarcoidosis and individuals with latent M. tuberculosis infection or those vaccinated with BCG. Conceivably, mKatG-reactive, IFN-γ-producing effector T cells in sarcoidosis may contribute to the overall greater Th1 polarization seen in sarcoidosis compared with tuberculosis (44).
The reasons why mKatG may be an immunodominant T cell Ag in sarcoidosis but not in latent M. tuberculosis infection or BCG vaccination remain unclear. One striking difference between individuals with latent M. tuberculosis infection and sarcoidosis is the lack of evidence that sarcoidosis patients are susceptible to reactivation of live mycobacteria from a dormant state, despite years of corticosteroid or immunosuppressive therapy. This clinical observation leads to the hypothesis that viable mycobacterial organisms are no longer present in sarcoidosis tissues, with only select remnant mycobacterial proteins such as mKatG remaining that could drive differential immune responses (22). Additional possibilities include differences between these groups in mKatG expression within tissue mycobacteria, differences in Ag processing of mKatG by dendritic cells or macrophages depending on their state of activation, or the presence of pre-existing cross-reactive (to other microbial derived KatG) or autoreactive mKatG responsive T cells. For example, clinical isolates of M. tuberculosis reveal extensive strain variation in the katG region that could contribute to differences in expression or in coding sequences that affect immune responses (45). Because infection-induced inflammation may break tolerance either by cross-reactivity or from exposure to sequestered autoantigens, differences in the inflammatory host response during the course of M. tuberculosis infection and sarcoidosis could also lead to differences in cross (auto)-reactivity to mycobacterial Ags or autoimmunity (46). Our data are also consistent with the premise that active sarcoidosis could be triggered by non-M. tuberculosis mycobacterial organisms. In our original study that identified M. tuberculosis KatG as a candidate pathogenic Ag, mass spectrometry and peptide fingerprinting of a poorly soluble Ag in one tissue sample matched M. smegmatis KatG, consistent with the premise that KatG proteins from non-M. tuberculosis mycobacteria may also be relevant pathogenic Ags in sarcoidosis (22). In this study, the anti-M. tuberculosis KatG mAb used to detect mKatG in sarcoidosis tissues by protein immunoblotting was demonstrated to cross-react with KatG from a subset of non-M. tuberculosis mycobacteria such as Mycobacterium smegmatis, but not others (e.g., Mycobacterium chelonei), and thus could not discriminate the precise mycobacterial species from which the tissue KatG was derived (22).
Experimental models of mycobacterial infection and autoimmunity indicate that T cells reactive to microbial Ags or pathogenic tissue autoantigens accumulate at sites of antigenic exposure where they can effect an inflammatory response (47-49). As expected for a pathogenic Ag in sarcoidosis, our study found that CD4+ IFN-γ-expressing Th1 cells reactive to mKatG accumulate in the lungs of patients with pulmonary involvement, with fewer circulating mKatG specific CD4+ Th1 cells in the blood. ELISPOT assays have previously been shown to preferentially detect effector memory T cells in tuberculosis, malaria, and other infections (50-53). Given that >95% of T cells in the sarcoidosis lung have a CD45R0+/CD45RA− memory phenotype (40, 54), our current results suggests there is an accumulation of mKatG specific effector memory CD4+ Th1 cells in the sarcoidosis lung. Proliferation to mKatG was also dominant within the CD4+ T cell subset, suggesting central memory T cells reactive to mKatG are present in sarcoidosis in varying degrees in different patients. This possibility may parallel findings in chronic beryllium (Be) disease in which Be-sensitized individuals develop granulomatous pneumonitis histologically identical to pulmonary sarcoidosis and in whom circulating Be-specific CD4+ T cells with proliferative capacity are dominantly of a central memory T cells phenotype (55).
Importantly, circulating mKatG-reactive, IFN-γ-expressing T cells persisted with chronic disease, but were not present in those patients who had inactive disease suggesting these effector T cells play a role in ongoing granulomatous inflammation. The finding that there were more CD8+ than CD4+ mKatG-reactive T cells expressing IFNγ in the blood and the presence of CD8+ mKatG-reactive T cells in the lung suggest that a significant contribution to chronic IFN-γ-mediated granulomatous inflammation in these patients may derive from CD8+ mKatG specific T cells. In both sarcoidosis and tuberculosis, CD4+ T cells are found scattered throughout the granuloma, with CD8+ T cells dominantly around the periphery of the granuloma (1, 56, 57). Both human and experimental models of mycobacterial infection have demonstrated the importance of both CD4+ and CD8+ T cells in host defense against these organisms, and a similar interplay between CD4+ and CD8+ mKatG-specific T cells could also be relevant in sarcoidosis (58-61).
The mechanisms that promote the persistence of Th1 cells at site of inflammation in sarcoidosis despite years of disease remain unclear. One possibility discussed above is that there is persistence of pathogenic Ags such as mKatG at sites of granulomatous inflammation as suggested by our prior study that documented the presence of mKatG protein and DNA in ~50% of sarcoidosis tissues (22). The fact that a subgroup of patients had higher responses to mKatG than PPD suggests mKatG may be a more persistent Ag compared with other Ags contained within PPD preparations. In chronic Be disease, CD4+ Be-specific T cells in blood persist for many years of disease duration even after decades removed from last known occupational exposure, likely in part related to the persistence of Be in the lung (62). Because granulomas may serve as an impediment to removal of Ags by the presence of cells and matrix designed to wall off offending poorly soluble antigenic material, it is possible that mKatG is complexed with other proteins or sequestered within the granuloma in a manner that permits only a slow removal of this Ag (63). A second possibility is that cross-reactivity between microbial and autoAgs could play a role in chronic active sarcoidosis. For example, Ab responses to human and microbial heat shock proteins are commonly observed in patients with sarcoidosis and other inflammatory diseases (64). Alternatively, mKatG-reactive T cells may persist due to cross-reactivity with homologous peptides from environmental exposure to related mycobacterial organisms. Because it has been shown that granulomas serve as traps for superinfecting mycobacterial organisms, it is also conceivable that environmentally derived mycobacterial proteins may replenish a supply of existing mycobacterial Ags at sites of granulomas (65). A final possibility is that mKatG-reactive effector T cells persist despite the gradual removal of the pathogenic antigenic burden in tissues. Several studies indicate that effector memory T cells are capable of longstanding survival in absence of Ag (66-68).
A genetic basis for sarcoidosis risk and clinical phenotype is centered primarily on the MHC locus and HLA alleles, though the molecular mechanisms that determine different outcomes remain undefined (1, 69). The finding that DRB1*0301+ sarcoidosis patients had higher frequencies of mKatG-reactive lung T cells compared with DRB1*0301− patients, suggests a direct influence of this MHC genotype on mKatG Th1 responses. Because DRB1*0301 has been strongly associated with Löfgren syndrome and good prognosis in sarcoidosis (41), it is possible that DRB1*0301+ could directly affect localized Th1 responses by binding relevant peptides derived from this (or other) pathogenic Ags and influence clinical course. This possibility is enhanced by the finding that no difference in mKatG responses was seen in the blood of DRB1*0301+ compared with DRB1*0301− patients, suggesting that mKatG responses are manifested dominantly in tissues such as the lung where there is active inflammation. Of interest, it has been reported that DRB1*03 is associated with protection from tuberculosis, and with a favorable disease course (70). The finding that both the frequency of mKatG-reactive and PPD-reactive IFN-γ expressing T cells in the lung was higher in DRB1*0301+ patients is in keeping with premise that DRB1*0301 alleles may influence clinical outcomes by affecting local immune responses to mycobacterial Ags. Future studies will be necessary to determine whether the association of DRB1*0301 and good prognosis with Löfgren syndrome in sarcoidosis reflect similar mechanisms that may operate to contribute to a favorable outcome in active tuberculosis.
Intriguingly, we found a significant correlation between the proportion of mKatG and PPD responsive BAL cells and the number of AV2S3+ BAL T cells in DRB1*0301+ Swedish patients, allowing the speculation that AV2S3+ BAL T cells could contain T cells reactive to mKatG or other mycobacterial Ags. In line with this, a previous study showed that in vitro stimulation of peripheral blood cells from BCG vaccinated DRB1*0301+ healthy Swedish volunteers with Mycobacterium tuberculosis extracts gave rise to AV2S3+ T cell expansions (71). In a recent study, the present Swedish authors and their colleagues described a novel technique that allowed them to identify 78 peptides that were eluted from HLA-DR molecules expressed on sarcoidosis BAL cells from DRB1*0301+ sarcoidosis patients and thus, could potentially stimulate AV2S3+ T cells (72). These peptides included autoantigens such as lysyl-tRNA synthase and vimentin. Some of these peptides can induce IFN-γ expression in blood and BAL T cells from sarcoidosis patients, but so far any role for AV2S3+ T cells in such responses remains unknown (72). One could speculate that AV2S3+ T cells could be crossreactive and recognize both some autoantigens and mKatG or other mycobacterial Ags. However, we found no obvious sequence homologies between the HLA-DR-binding peptides and mKatG. Another possibility could be that AV2S3+ BAL T cells in DRB1*0301+ Swedish patients have specificities to mKatG or other mycobacterial Ags and are expanded in parallel with autoreactive T cells, expressing other TCR components with AV2S3 in this lung T cell subset.
The determinants of remitting vs chronic sarcoidosis remain uncertain but are of critical interest given that insights might allow new therapeutic approaches to this disease. Our finding that there was no distinction between the percentages of mKatG-reactive, IFN-γ-producing cells in either the lung or blood of patients with or without Löfgren syndrome at time of diagnosis implies that mKatG-reactive Th1 cells circulate at times of active inflammation and disease regardless of the prognosis or subsequent clinical course. This common thread strengthens the case that mKatG is a pathogenic Ag by providing a unifying trigger in sarcoidosis but mandates that other factors are critical in determining clinical outcome. The present Swedish authors have described a reduced Th1 phenotype for BAL cells in AV2S3+/DRB1*0301+ sarcoidosis patients that have a favorable prognosis with remission >80% of time (30). Other studies have linked persistent expression of TNF from BAL cells in sarcoidosis patients with chronic disease (73). Whether mKatG-reactive T cells will be shown to have a reduced Th1 phenotype in those with Löfgren syndrome or express greater amounts of TNF in those with chronic sarcoidosis remains to be determined. The possibility that some mKatG reactive CD4+ T cells express IL17 (i.e., Th17 effector cells) should also be considered given recent data that indicate Th17 cells may have an important role in host defense against specific pathogens and in organ specific autoimmunity (74, 75). In this context, future studies are clearly indicated to determine whether mKatG specific T cells produce TNF or IL17 and more generally, whether differences exist in the profiles of cytokine producing mKatG reactive effector T cells in different subgroups of patients. It is also conceivable that mKatG-reactive T cells with regulatory properties (Tregs) may influence disease outcome. In this context, pathogen-specific Tregs have been shown to regulate immunity to foreign Ags and regulate host responses in experimental models of tuberculosis (76-78). Recent studies report that Tregs may be either defective in number or function in sarcoidosis, suggesting that Ag-specific Tregs could contribute to disease pathogenesis or influence clinical outcome (79, 80).
In summary, this study demonstrates that T cell responses to mKatG are regulated in a manner expected for a pathogenic Ag. The presence, persistence and dominance of mKatG-reactive, IFNγ-expressing T cells in a subset of patients together with the prior demonstration of mKatG in sarcoidosis tissues provides a foundation to consider mKatG specific responses as part of an immunophenotyping scheme that could assist in clinical evaluation or course prediction. It is also possible that an immunotherapeutic strategy using mKatG could be derived to benefit some patients with sarcoidosis.
Footnotes
This work was supported by National Institutes of Health Grants HL-68019, HL-77732, and HL-83870 (to D.R.M.), HL-71100 (to E.S.C.), by the Life and Breath Foundation, and the Hospital for the Consumptives of Maryland (Eudowood).
Abbreviations used in this paper: mKatG, Mycobacterium tuberculosis catalase-peroxidase; PPD, purified protein derivative; BCG, Bacillus Calmette-Guérin; BAL, bronchoalveolar lavage; sfc, spot forming cell; SEB, staphylococcal enterotoxin B; Be, beryllium; Treg, regulatory T cell; CTCM, complete tissue culture medium.
Disclosures Johns Hopkins University with D.R.M. and Y.Z. have a patent pending related to this work. Other co-authors have no financial conflict of interests with this study.
References
- 1.Joint Statement of the American Thoracic Society (ATS), the European Respiratory Society (ERS) and the World Association of Sarcoidosis and Other Granulomatous Disorders (WASOG) adopted by the ATS Board of Directors and by the ERS Executive Committee. Statement on sarcoidosis. Am J Respir Crit Care Med. 1999 February;160:736–755. doi: 10.1164/ajrccm.160.2.ats4-99. [DOI] [PubMed] [Google Scholar]
- 2.Grunewald J, Eklund A. Sex-specific manifestations of Lofgren’s syndrome. Am J Respir Crit Care Med. 2007;175:40–44. doi: 10.1164/rccm.200608-1197OC. [DOI] [PMC free article] [PubMed] [Google Scholar]
- 3.Rybicki BA, Iannuzzi MC. Epidemiology of sarcoidosis: recent advances and future prospects. Semin Respir Crit Care Med. 2007;28:22–35. doi: 10.1055/s-2007-970331. [DOI] [PubMed] [Google Scholar]
- 4.Baughman RP, Teirstein AS, Judson MA, Rossman MD, Yeager H, Jr, Bresnitz EA, DePalo L, Hunninghake G, Iannuzzi MC, Johns CJ, et al. Clinical characteristics of patients in a case control study of sarcoidosis. Am J Respir Crit Care Med. 2001;164:1885–1889. doi: 10.1164/ajrccm.164.10.2104046. [DOI] [PubMed] [Google Scholar]
- 5.Zissel G, Prasse A, Muller-Quernheim J. Sarcoidosis: immunopathogenetic concepts. Semin Respir Crit Care Med. 2007;28:3–14. doi: 10.1055/s-2007-970329. [DOI] [PubMed] [Google Scholar]
- 6.Hunninghake GW, Crystal RG. Pulmonary sarcoidosis: a disorder mediated by excess helper T-lymphocyte activity at sites of disease activity. N Engl J Med. 1981;305:429–434. doi: 10.1056/NEJM198108203050804. [DOI] [PubMed] [Google Scholar]
- 7.Robinson BW, McLemore TL, Crystal RG. γ interferon is spontaneously released by alveolar macrophages and lung T lymphocytes in patients with pulmonary sarcoidosis. J Clin Invest. 1985;75:1488–1495. doi: 10.1172/JCI111852. [DOI] [PMC free article] [PubMed] [Google Scholar]
- 8.Moller DR, Forman JD, Liu MC, Noble PW, Greenlee BM, Vyas P, Holden DA, Forrester JM, Lazarus A, Wysocka M, et al. Enhanced expression of IL-12 associated with Th1 cytokine profiles in active pulmonary sarcoidosis. J Immunol. 1996;156:4952–4960. [PubMed] [Google Scholar]
- 9.Rogge L, Papi A, Presky DH, Biffi M, Minetti LJ, Miotto D, Agostini C, Semenzato G, Fabbri LM, Sinigaglia F. Antibodies to the IL-12 receptor β 2 chain mark human Th1 but not Th2 cells in vitro and in vivo. J Immunol. 1999;162:3926–3932. [PubMed] [Google Scholar]
- 10.Greene CM, Meachery G, Taggart CC, Rooney CP, Coakley R, O’Neill SJ, McElvaney NG. Role of IL-18 in CD4+ T lymphocyte activation in sarcoidosis. J Immunol. 2000;165:4718–4724. doi: 10.4049/jimmunol.165.8.4718. [DOI] [PubMed] [Google Scholar]
- 11.Katchar K, Eklund A, Grunewald J. Expression of Th1 markers by lung accumulated T cells in pulmonary sarcoidosis. J Intern Med. 2003;254:564–571. doi: 10.1111/j.1365-2796.2003.01230.x. [DOI] [PubMed] [Google Scholar]
- 12.Chiu BC, Freeman CM, Stolberg VR, Komuniecki E, Lincoln PM, Kunkel SL, Chensue SW. Cytokine-chemokine networks in experimental mycobacterial and schistosomal pulmonary granuloma formation. Am J Respir Cell Mol Biol. 2003;29:106–116. doi: 10.1165/rcmb.2002-0241OC. [DOI] [PMC free article] [PubMed] [Google Scholar]
- 13.Nakajima M, Kubota Y, Miyashita N, Niki Y, Matsushima T, Manabe T. Recurrence of sarcoidosis following interferon α therapy for chronic hepatitis C. Intern Med. 1996;35:376–379. doi: 10.2169/internalmedicine.35.376. [DOI] [PubMed] [Google Scholar]
- 14.Naccache JM, Antoine M, Wislez M, Fleury-Feith J, Oksenhendler E, Mayaud C, Cadranel J. Sarcoid-like pulmonary disorder in human immunodeficiency virus-infected patients receiving antiretroviral therapy. Am J Respir Crit Care Med. 1999;159:2009–2013. doi: 10.1164/ajrccm.159.6.9807152. [DOI] [PubMed] [Google Scholar]
- 15.Chen ES, Moller DR. Etiology of sarcoidosis. Clin Chest Med. 2008;29:365–377. doi: 10.1016/j.ccm.2008.03.011. [DOI] [PubMed] [Google Scholar]
- 16.Moller DR. Involvement of T cells and alterations in T cell receptors in sarcoidosis. Semin Respir Infect. 1998;13:174–183. [PubMed] [Google Scholar]
- 17.Moller DR, Konishi K, Kirby M, Balbi B, Crystal RG. Bias toward use of a specific T cell receptor β-chain variable region in a subgroup of individuals with sarcoidosis. J Clin Invest. 1988;82:1183–1191. doi: 10.1172/JCI113715. [DOI] [PMC free article] [PubMed] [Google Scholar]
- 18.Grunewald J, Janson CH, Eklund A, Ohrn M, Olerup O, Persson U, Wigzell H. Restricted V α 2.3 gene usage by CD4+ T lymphocytes in bronchoalveolar lavage fluid from sarcoidosis patients correlates with HLA-DR3. Eur J Immunol. 1992;22:129–135. doi: 10.1002/eji.1830220120. [DOI] [PubMed] [Google Scholar]
- 19.Forrester JM, Wang Y, Ricalton N, Fitzgerald JE, Loveless J, Newman LS, King TE, Kotzin BL. TCR expression of activated T cell clones in the lungs of patients with pulmonary sarcoidosis. J Immunol. 1994;153:4291–4302. [PubMed] [Google Scholar]
- 20.Grunewald J, Hultman T, Bucht A, Eklund A, Wigzell H. Restricted usage of T cell receptor Vα/Jα gene segments with different nucleotide but identical amino acid sequences in HLA-DR3+ sarcoidosis patients. Mol Med. 1995;1:287–296. [PMC free article] [PubMed] [Google Scholar]
- 21.Silver RF, Crystal RG, Moller DR. Limited heterogeneity of biased T-cell receptor Vβ gene usage in lung but not blood T cells in active pulmonary sarcoidosis. Immunology. 1996;88:516–523. doi: 10.1046/j.1365-2567.1996.d01-683.x. [DOI] [PMC free article] [PubMed] [Google Scholar]
- 22.Song Z, Marzilli L, Greenlee BM, Chen ES, Silver RF, Askin FB, Teirstein AS, Zhang Y, Cotter RJ, Moller DR. Mycobacterial catalase-peroxidase is a tissue antigen and target of the adaptive immune response in systemic sarcoidosis. J Exp Med. 2005;201:755–767. doi: 10.1084/jem.20040429. [DOI] [PMC free article] [PubMed] [Google Scholar]
- 23.Gupta D, Agarwal R, Aggarwal AN, Jindal SK. Molecular evidence for the role of mycobacteria in sarcoidosis: a meta-analysis. Eur Respir J. 2007;30:508–516. doi: 10.1183/09031936.00002607. [DOI] [PubMed] [Google Scholar]
- 24.Hance AJ. The role of mycobacteria in the pathogenesis of sarcoidosis. Semin Respir Infect. 1998;13:197–205. [PubMed] [Google Scholar]
- 25.Drake WP, Dhason MS, Nadaf M, Shepherd BE, Vadivelu S, Hajizadeh R, Newman LS, Kalams SA. Cellular recognition of Mycobacterium tuberculosis ESAT-6 and KatG peptides in systemic sarcoidosis. Infect Immun. 2007;75:527–530. doi: 10.1128/IAI.00732-06. [DOI] [PMC free article] [PubMed] [Google Scholar]
- 26.Hajizadeh R, Sato H, Carlisle J, Nadaf MT, Evans W, Shepherd BE, Miller RF, Kalams SA, Drake WP. Mycobacterium tuberculosis Antigen 85A induces Th-1 immune responses in systemic sarcoidosis. J Clin Immunol. 2007;27:445–454. doi: 10.1007/s10875-007-9080-4. [DOI] [PMC free article] [PubMed] [Google Scholar]
- 27.Dubaniewicz A, Trzonkowski P, Dubaniewicz-Wybieralska M, Singh M, Mysliwski A. Mycobacterial heat shock protein-induced blood T lymphocytes subsets and cytokine pattern: comparison of sarcoidosis with tuberculosis and healthy controls. Respirology. 2007;12:346–354. doi: 10.1111/j.1440-1843.2007.01076.x. [DOI] [PubMed] [Google Scholar]
- 28.Consensus conference: activity of sarcoidosis. Eur Respir J; Third WASOG meeting; Los Angeles, USA. September 8–11, 1993; 1994. pp. 624–627. [PubMed] [Google Scholar]
- 29.Targeted tuberculin testing and treatment of latent tuberculosis infection. American Thoracic Society. MMWR Recomm Rep. 2000;49:1–51. [PubMed] [Google Scholar]
- 30.Idali F, Wiken M, Wahlstrom J, Mellstedt H, Eklund A, Rabbani H, Grunewald J. Reduced Th1 response in the lungs of HLA-DRB1*0301 patients with pulmonary sarcoidosis. Eur Respir J. 2006;27:451–459. doi: 10.1183/09031936.06.00067105. [DOI] [PubMed] [Google Scholar]
- 31.Zhang Y, Heym B, Allen B, Young D, Cole S. The catalase-peroxidase gene and isoniazid resistance of Mycobacterium tuberculosis. Nature. 1992;358:591–593. doi: 10.1038/358591a0. [DOI] [PubMed] [Google Scholar]
- 32.Johnsson K, Froland WA, Schultz PG. Overexpression, purification, and characterization of the catalase-peroxidase KatG from Mycobacterium tuberculosis. J Biol Chem. 1997;272:2834–2840. doi: 10.1074/jbc.272.5.2834. [DOI] [PubMed] [Google Scholar]
- 33.Grunewald J, Olerup O, Persson U, Ohrn MB, Wigzell H, Eklund A. T-cell receptor variable region gene usage by CD4+ and CD8+ T cells in bronchoalveolar lavage fluid and peripheral blood of sarcoidosis patients. Proc Natl Acad Sci USA. 1994;91:4965–4969. doi: 10.1073/pnas.91.11.4965. [DOI] [PMC free article] [PubMed] [Google Scholar]
- 34.Forman JD, Klein JT, Silver RF, Liu MC, Greenlee BM, Moller DR. Selective activation and accumulation of oligoclonal Vβ-specific T cells in active pulmonary sarcoidosis. J Clin Invest. 1994;94:1533–1542. doi: 10.1172/JCI117494. [DOI] [PMC free article] [PubMed] [Google Scholar]
- 35.Eklund A, Blaschke E. Relationship between changed alveolar-capillary permeability and angiotensin converting enzyme activity in serum in sarcoidosis. Thorax. 1986;41:629–634. doi: 10.1136/thx.41.8.629. [DOI] [PMC free article] [PubMed] [Google Scholar]
- 36.Lalvani A, Pathan AA, Durkan H, Wilkinson KA, Whelan A, Deeks JJ, Reece WH, Latif M, Pasvol G, Hill AV. Enhanced contact tracing and spatial tracking of Mycobacterium tuberculosis infection by enumeration of antigen-specific T cells. Lancet. 2001;357:2017–2021. doi: 10.1016/S0140-6736(00)05115-1. [DOI] [PubMed] [Google Scholar]
- 37.Shlobin OA, West EE, Lechtzin N, Miller SM, Borja M, Orens JB, Dropulic LK, McDyer JF. Persistent cytomegalovirus-specific memory responses in the lung allograft and blood following primary infection in lung transplant recipients. J Immunol. 2006;176:2625–2634. doi: 10.4049/jimmunol.176.4.2625. [DOI] [PubMed] [Google Scholar]
- 38.Holmes KL, Otten G, Yokoyama WM. Flow cytometry analysis using the Becton Dickinson FACS Calibur. In: Coligan JE, Bierer BE, Margulies DH, Shevach EM, Strober W, editors. Current Protocols in Immunology. John Wiley & Sons, Inc.; Hoboken, NJ: 2002. pp. 5.4.1–5.4.22. [DOI] [PubMed] [Google Scholar]
- 39.Lecossier D, Valeyre D, Loiseau A, Cadranel J, Tazi A, Battesti JP, Hance AJ. Antigen-induced proliferative response of lavage and blood T lymphocytes: comparison of cells from normal subjects and patients with sarcoidosis. Am Rev Respir Dis. 1991;144:861–868. doi: 10.1164/ajrccm/144.4.861. [DOI] [PubMed] [Google Scholar]
- 40.Dominique S, Bouchonnet F, Smiejan JM, Hance AJ. Expression of surface antigens distinguishing “naive” and previously activated lymphocytes in bronchoalveolar lavage fluid. Thorax. 1990;45:391–396. doi: 10.1136/thx.45.5.391. [DOI] [PMC free article] [PubMed] [Google Scholar]
- 41.Grunewald J, Berlin M, Olerup O, Eklund A. Lung T-helper cells expressing T-cell receptor AV2S3 associate with clinical features of pulmonary sarcoidosis. Am J Respir Crit Care Med. 2000;161:814–818. doi: 10.1164/ajrccm.161.3.9906001. [DOI] [PubMed] [Google Scholar]
- 42.Nishino K, Yoshida H, Yoshida O, Watanabe M, Fukushima A, Ueno H. Analysis of responses of peripheral blood lymphocytes from sarcoidosis patients to purified protein derivative. Jpn J Ophthalmol. 2000;44:165–170. doi: 10.1016/s0021-5155(99)00182-3. [DOI] [PubMed] [Google Scholar]
- 43.Mustafa AS, Amoudy HA, Wiker HG, Abal AT, Ravn P, Oftung F, Andersen P. Comparison of antigen-specific T-cell responses of tuberculosis patients using complex or single antigens of Mycobacterium tuberculosis. Scand J Immunol. 1998;48:535–543. doi: 10.1046/j.1365-3083.1998.00419.x. [DOI] [PubMed] [Google Scholar]
- 44.Bergeron A, Bonay M, Kambouchner M, Lecossier D, Riquet M, Soler P, Hance A, Tazi A. Cytokine patterns in tuberculous and sarcoid granulomas: correlations with histopathologic features of the granulomatous response. J Immunol. 1997;159:3034–3043. [PubMed] [Google Scholar]
- 45.Zhang Y, Young D. Strain variation in the katG region of Mycobacterium tuberculosis. Mol Microbiol. 1994;14:301–308. doi: 10.1111/j.1365-2958.1994.tb01291.x. [DOI] [PubMed] [Google Scholar]
- 46.Mackay IR, Leskovsek NV, Rose NR. Cell damage and autoimmunity: a critical appraisal. J Autoimmun. 2008;30:5–11. doi: 10.1016/j.jaut.2007.11.009. [DOI] [PMC free article] [PubMed] [Google Scholar]
- 47.Silver RF, Zukowski L, Kotake S, Li Q, Pozuelo F, Krywiak A, Larkin R. Recruitment of antigen-specific Th1-like responses to the human lung following bronchoscopic segmental challenge with purified protein derivative of Mycobacterium tuberculosis. Am J Respir Cell Mol Biol. 2003;29:117–123. doi: 10.1165/rcmb.4840. [DOI] [PubMed] [Google Scholar]
- 48.Palendira U, Bean AG, Feng CG, Britton WJ. Lymphocyte recruitment and protective efficacy against pulmonary mycobacterial infection are independent of the route of prior Mycobacterium bovis BCG immunization. Infect Immun. 2002;70:1410–1416. doi: 10.1128/IAI.70.3.1410-1416.2002. [DOI] [PMC free article] [PubMed] [Google Scholar]
- 49.Rose NR. The role of infection in the pathogenesis of autoimmune disease. Semin Immunol. 1998;10:5–13. doi: 10.1006/smim.1997.0100. [DOI] [PubMed] [Google Scholar]
- 50.Pathan AA, Wilkinson KA, Klenerman P, McShane H, Davidson RN, Pasvol G, Hill AV, Lalvani A. Direct ex vivo analysis of antigen-specific IFN-γ-secreting CD4 T cells in Mycobacterium tuberculosis-infected individuals: associations with clinical disease state and effect of treatment. J Immunol. 2001;167:5217–5225. doi: 10.4049/jimmunol.167.9.5217. [DOI] [PubMed] [Google Scholar]
- 51.Flanagan KL, Lee EA, Gravenor MB, Reece WH, Urban BC, Doherty T, Bojang KA, Pinder M, Hill AV, Plebanski M. Unique T cell effector functions elicited by Plasmodium falciparum epitopes in malaria-exposed Africans tested by three T cell assays. J Immunol. 2001;167:4729–4737. doi: 10.4049/jimmunol.167.8.4729. [DOI] [PubMed] [Google Scholar]
- 52.Godkin AJ, Thomas HC, Openshaw PJ. Evolution of epitope-specific memory CD4+ T cells after clearance of hepatitis C virus. J Immunol. 2002;169:2210–2214. doi: 10.4049/jimmunol.169.4.2210. [DOI] [PubMed] [Google Scholar]
- 53.Lanzavecchia A, Sallusto F. Understanding the generation and function of memory T cell subsets. Curr Opin Immunol. 2005;17:326–332. doi: 10.1016/j.coi.2005.04.010. [DOI] [PubMed] [Google Scholar]
- 54.Fazel SB, Howie SE, Krajewski AS, Lamb D. Increased CD45RO expression on T lymphocytes in mediastinal lymph node and pulmonary lesions of patients with pulmonary sarcoidosis. Clin Exp Immunol. 1994;95:509–513. doi: 10.1111/j.1365-2249.1994.tb07027.x. [DOI] [PMC free article] [PubMed] [Google Scholar]
- 55.Fontenot AP, Palmer BE, Sullivan AK, Joslin FG, Wilson CC, Maier LA, Newman LS, Kotzin BL. Frequency of beryllium-specific, central memory CD4+ T cells in blood determines proliferative response. J Clin Invest. 2005;115:2886–2893. doi: 10.1172/JCI24908. [DOI] [PMC free article] [PubMed] [Google Scholar]
- 56.Modlin RL, Hofman FM, Meyer PR, Sharma OP, Taylor CR, Rea TH. In situ demonstration of T lymphocyte subsets in granulomatous inflammation: leprosy, rhinoscleroma and sarcoidosis. Clin Exp Immunol. 1983;51:430–438. [PMC free article] [PubMed] [Google Scholar]
- 57.Gonzalez-Juarrero M, Turner OC, Turner J, Marietta P, Brooks JV, Orme IM. Temporal and spatial arrangement of lymphocytes within lung granulomas induced by aerosol infection with Mycobacterium tuberculosis. Infect Immun. 2001;69:1722–1728. doi: 10.1128/IAI.69.3.1722-1728.2001. [DOI] [PMC free article] [PubMed] [Google Scholar]
- 58.Orme IM. The kinetics of emergence and loss of mediator T lymphocytes acquired in response to infection with Mycobacterium tuberculosis. J Immunol. 1987;138:293–298. [PubMed] [Google Scholar]
- 59.Muller I, Cobbold SP, Waldmann H, Kaufmann SH. Impaired resistance to Mycobacterium tuberculosis infection after selective in vivo depletion of L3T4+ and Lyt-2+ T cells. Infect Immun. 1987;55:2037–2041. doi: 10.1128/iai.55.9.2037-2041.1987. [DOI] [PMC free article] [PubMed] [Google Scholar]
- 60.Tan JS, Canaday DH, Boom WH, Balaji KN, Schwander SK, Rich EA. Human alveolar T lymphocyte responses to Mycobacterium tuberculosis antigens: role for CD4+ and CD8+ cytotoxic T cells and relative resistance of alveolar macrophages to lysis. J Immunol. 1997;159:290–297. [PubMed] [Google Scholar]
- 61.McShane H, Behboudi S, Goonetilleke N, Brookes R, Hill AV. Protective immunity against Mycobacterium tuberculosis induced by dendritic cells pulsed with both CD8+- and CD4+-T-cell epitopes from antigen 85A. Infect Immun. 2002;70:1623–1626. doi: 10.1128/IAI.70.3.1623-1626.2002. [DOI] [PMC free article] [PubMed] [Google Scholar]
- 62.Fontenot AP, Canavera SJ, Gharavi L, Newman LS, Kotzin BL. Target organ localization of memory CD4+ T cells in patients with chronic beryllium disease. J Clin Invest. 2002;110:1473–1482. doi: 10.1172/JCI15846. [DOI] [PMC free article] [PubMed] [Google Scholar]
- 63.Saunders BM, Cooper AM. Restraining mycobacteria: role of granulomas in mycobacterial infections. Immunol Cell Biol. 2000;78:334–341. doi: 10.1046/j.1440-1711.2000.00933.x. [DOI] [PubMed] [Google Scholar]
- 64.Staton JM, Dench JE, Currie B, Fitzpatrick DR, Himbeck RP, Allen R, Bruce J, Robinson BW, Bielefeldt-Ohmann H. Expression and immune recognition of stress proteins in sarcoidosis and other chronic interstitial lung diseases. Immunol Cell Biol. 1995;73:23–32. doi: 10.1038/icb.1995.4. [DOI] [PubMed] [Google Scholar]
- 65.Cosma CL, Humbert O, Ramakrishnan L. Superinfecting mycobacteria home to established tuberculous granulomas. Nat Immunol. 2004;5:828–835. doi: 10.1038/ni1091. [DOI] [PubMed] [Google Scholar]
- 66.Jamieson BD, Ahmed R. T cell memory. Long-term persistence of virus-specific cytotoxic T cells. J Exp Med. 1989;169:1993–2005. doi: 10.1084/jem.169.6.1993. [DOI] [PMC free article] [PubMed] [Google Scholar]
- 67.Swain SL. CD4 T-cell memory can persist in the absence of class II. Philos Trans R Soc London B. 2000;355:407–411. doi: 10.1098/rstb.2000.0581. [DOI] [PMC free article] [PubMed] [Google Scholar]
- 68.Zhu Y, Zhu G, Luo L, Flies AS, Chen L. CD137 stimulation delivers an antigen-independent growth signal for T lymphocytes with memory phenotype. Blood. 2007;109:4882–4889. doi: 10.1182/blood-2006-10-043463. [DOI] [PMC free article] [PubMed] [Google Scholar]
- 69.Iannuzzi MC. Genetics of sarcoidosis. Semin Respir Crit Care Med. 2007;28:15–21. doi: 10.1055/s-2007-970330. [DOI] [PubMed] [Google Scholar]
- 70.Khomenko AG, Litvinov VI, Chukanova VP, Pospelov LE. Tuberculosis in patients with various HLA phenotypes. Tubercle. 1990;71:187–192. doi: 10.1016/0041-3879(90)90074-i. [DOI] [PubMed] [Google Scholar]
- 71.Esin S, Batoni G, Saruhan-Direskeneli G, Harris RA, Grunewald J, Pardini M, Svenson SB, Campa M, Wigzell H. In vitro expansion of T-cell-receptor Vα2.3+ CD4+ T lymphocytes in HLA-DR17(3), DQ2+ individuals upon stimulation with Mycobacterium tuberculosis. Infect Immun. 1999;67:3800–3809. doi: 10.1128/iai.67.8.3800-3809.1999. [DOI] [PMC free article] [PubMed] [Google Scholar]
- 72.Wahlstrom J, Dengjel J, Persson B, Duyar H, Rammensee HG, Stevanovic S, Eklund A, Weissert R, Grunewald J. Identification of HLA-DR-bound peptides presented by human bronchoalveolar lavage cells in sarcoidosis. J Clin Invest. 2007;117:3576–3582. doi: 10.1172/JCI32401. [DOI] [PMC free article] [PubMed] [Google Scholar]
- 73.Ziegenhagen MW, Benner UK, Zissel G, Zabel P, Schlaak M, Muller-Quernheim J. Sarcoidosis: TNF-α release from alveolar macrophages and serum level of sIL-2R are prognostic markers. Am J Respir Crit Care Med. 1997;156:1586–1592. doi: 10.1164/ajrccm.156.5.97-02050. [DOI] [PubMed] [Google Scholar]
- 74.Harrington LE, Hatton RD, Mangan PR, Turner H, Murphy TL, Murphy KM, Weaver CT. Interleukin 17-producing CD4+ effector T cells develop via a lineage distinct from the T helper type 1 and 2 lineages. Nat Immunol. 2005;6:1123–1132. doi: 10.1038/ni1254. [DOI] [PubMed] [Google Scholar]
- 75.Bettelli E, Korn T, Oukka M, Kuchroo VK. Induction and effector functions of TH17 cells. Nature. 2008;453:1051–1057. doi: 10.1038/nature07036. [DOI] [PMC free article] [PubMed] [Google Scholar]
- 76.Sakaguchi S, Sakaguchi N, Asano M, Itoh M, Toda M. Immunologic self-tolerance maintained by activated T cells expressing IL-2 receptor α-chains (CD25): breakdown of a single mechanism of self-tolerance causes various autoimmune diseases. J Immunol. 1995;155:1151–1164. [PubMed] [Google Scholar]
- 77.Groux H, O’Garra A, Bigler M, Rouleau M, Antonenko S, de Vries JE, Roncarolo MG. A CD4+ T-cell subset inhibits antigen-specific T-cell responses and prevents colitis. Nature. 1997;389:737–742. doi: 10.1038/39614. [DOI] [PubMed] [Google Scholar]
- 78.Zhang ZX, Yang L, Young KJ, DuTemple B, Zhang L. Identification of a previously unknown antigen-specific regulatory T cell and its mechanism of suppression. Nat Med. 2000;6:782–789. doi: 10.1038/77513. [DOI] [PubMed] [Google Scholar]
- 79.Miyara M, Amoura Z, Parizot C, Badoual C, Dorgham K, Trad S, Kambouchner M, Valeyre D, Chapelon-Abric C, Debre P, et al. The immune paradox of sarcoidosis and regulatory T cells. J Exp Med. 2006;203:359–370. doi: 10.1084/jem.20050648. [DOI] [PMC free article] [PubMed] [Google Scholar]
- 80.Idali F, Wahlstrom J, Muller-Suur C, Eklund A, Grunewald J. Analysis of regulatory T cell associated forkhead box P3 expression in the lungs of patients with sarcoidosis. Clin Exp Immunol. 2008;152:127–137. doi: 10.1111/j.1365-2249.2008.03609.x. [DOI] [PMC free article] [PubMed] [Google Scholar]