

Abstract
We have recently developed a semi-continuous flow electroporation (SFE) device for in vitro DNA delivery. Cells mixed with plasmid DNA continuously flowed through a serpentine channel, the side walls of which also serving as electrodes. Using pWizGFP plasmid and K562 cells as a model system, SFE showed better transgene expression (10~15%) compared to a commercial electroporation system. Quantitative results via MTS assay also revealed a 50% or higher cell viability. Similar observations were also found with pWizGFP transfection to mouse embryonic stem cells. Such improvements were attributed to less gas formation and joule heating in SFE.
Keywords: Electroporation, Microfluidics, Gene Delivery, Mammalian Cells, Microdevices
INTRODUCTION
Many fundamental studies and therapies in the biomedical field demand efficient introduction of biomolecules (genes and oligonucleotides, in particular) into cells or tissues1,2. Reversible permeabilization of the cellular membrane is the major challenge and a variety of approaches have been developed to overcome this problem. Viral transductions (i.e., retroviruses and adenoviruses) are highly stable and efficienct3-5 but have a high risk of oncogenesis and inflammation6,7. Non-viral vectors, such as lipoplex and polyplex, show some delivery benefits but suffer low transfection efficiency and often a high cytotoxicity level8. Physical methods are in general more benign, as naked genes are transferred without the introduction of a secondary agent9-11. Among them, gold particle bombardment, such as gene gun often causes significant physical damages to cells, and gold particle carriers may have a negative impact on cell functions12-16. Microinjection can precisely target specific locations of cells but it is time-consuming and heavily operator-dependent, resulting in very low cell transfection throughput17,18. Electroporation has attracted a great deal of interest because of its simplicity and almost no restrictions for reagents and cell types19. It has been widely used as a convenient tool for both in vitro and in vivo delivery of DNA, protein, and other biomolecules1,2.
Current commercial electroporation devices are easy to use and applicable to a wide range of cell lines where non-viral gene transfer is required. They have been reasonably successful, but carry several major drawbacks such as a high electric voltage requirement, narrow cell population (~105–106) per test, large variations in transfection efficiency and cell viability, and cell type and population specific protocols. The recent introduction of microtechnology offers several advantages to this technology20-42, including low applied potential bias from closely patterned electrodes and online monitoring of intracellular transport20,21. However, most of these microdevices focus on cell lysis21-31 or cell fusion32,33 and only a few have been used for gene transfection34-44 with a very low cell population (single or multiple cells). In many applications (e.g., clinical studies and stem cell research in particular), there is a need to transfect a larger number of cells (e.g. >109 cells) with high transfection efficiency and cell viability. A continuous electroporation device that can conduct high cell throughput is highly desirable.
In this study, we designed and constructed a novel flow-through electroporation device. In this device, edges of a metallic serpentine channel serve as both electrodes and channel walls so that cells can be electroporated when flowing through the channel. The serpentine channel design can provide better mixing of gene and cell suspensions for maximum DNA uptake during electroporation. It can also save space on a 2D platform, and avoid serious joule heating and gas bubble formation. Cells mixed with plasmid DNA flowed through the channel in a semi-continuous manner where electric pulses were applied. In this way, the delivery of therapeutic materials can be accomplished easily for a large number of cells. As a demonstration, mouse embryonic stem cells (an adherent cell line) and K562 human chronic leukemia cells (a suspended cell line) were used as the model cell lines and WizGFP plasmids were used as the model gene. Besides its high cell throughput, this method also achieved a great improvement on transgene expression as well as cell viability.
EXPERIMENTAL
Design and Fabrication of Serpentine Microfluidic Chips
The fabrication procedure of the serpentine electroporation chips is schematically shown in Figure 1a. Briefly, an aluminum plate (~0.7 mm in thickness) was first pre-polished on both sides using a nanogrinding machine (350FG from Moore Nanotechnology Systems, LLC, Keene, NH) to achieve the desirable surface smoothness (3-5 nm roughness). The polished plate was then cut into small Al bars (shown in Figure 1a, step I) with an Electrical Discharge Machine (EDM) to avoid any curled edges due to mechanical stress during cutting. After measuring its thickness, one Al bar was pressed into poly (methyl methacrylate) (PMMA) pellets heated to 180°C. Two glass plates (150 mm × 150 mm) were used as top and bottom molds during hot embossing to ensure a smooth surface of the Al/PMMA sample (Figure 1a, step II). The finished Al/PMMA sample was then taken through a second polishing process to reach the desired thickness (e.g., 500 μm) and surface smoothness (Figure 1a, step III). A serpentine channel was created via cutting the embedded Al piece into two halves (Figure 1a, step IV) using a micromilling machine (Aerotech, Inc). The formed Al edges serve as both electrodes and channel walls in our semi-continuous electroporation device. After ultrasonic cleaning, the chip was sealed by lamination with a thin (~ 60 μm in thickness) plastic film. In this study, aluminum was used as the electrode material in order to make a comparison with commercial systems. For the same reason, the width of the serpentine channels was fixed at 2 mm, identical to the distance between the two electrodes widely used in commercial systems. The other dimensions of our serpentine channels are listed in Figure 1b.
Figure 1.
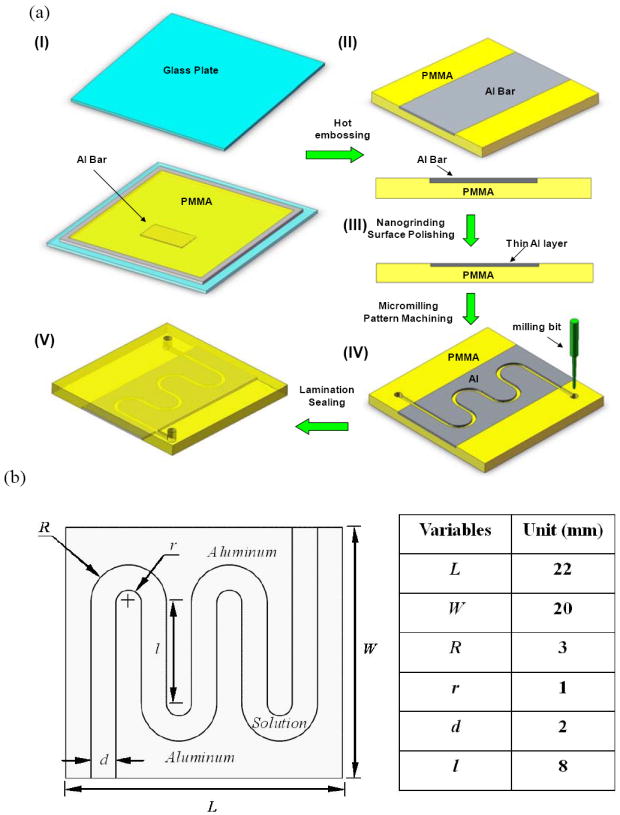
(a) Schematic of a serpentine channel fabrication (I. assembly Al bar, frame spacer, and glass mold plates; II, Al/PMMA sample after hot embossing; III, polished Al/PMMA sample; IV, serpentine channel made by micromilling; V, closed serpentine channel after lamination; (b) dimensions of a semi-continuous flow electroporation (SFE) device.
Experimental Setup and Procedure
Conductive copper tapes (McMaster Carr) and wires were used to connect the on-chip Al electrodes to electrodes inside the shockpod chamber of a Bio-Rad Gene Pulser Xcell™ system. Electric pulses (either square waves or exponentially decaying waves) were applied through the CE module of the Bio-Rad system. Cells (~0.5×10⁶ cells/ml) mixed with therapeutic materials (i.e., pWizGFP plasmids) flowed through the serpentine channel at a pre-specified flow rate controlled by a programmable syringe pump (Pump 22, Harvard Apparatus, Holliston, MA). An electric pulse was imposed when cells were pumped through the serpentine channel at a low flow rate (e.g., 0.2 ml/hr). After electroporation, the channel was filled with Opti-MEM® (a reduced serum media from Invitrogen, widely used for cationic lipid transfections) and the porated cells were flushed out at a higher flow rate (e.g., 5 ml/hr). After twice the amount of Opti-MEM® (washing solution) was pumped through the serpentine channel, fresh cell solution was loaded again for the next electroporation cycle. The cell solution in each cycle took about 95% of the channel volume with the rest occupied by the washing solutions from the previous cycle and the current cycle. The cell solution was therefore sandwiched in the electroporation zone (having Al side walls) and all liquids were moving forward together during electroporation. Some washing solution in front moved out of the channel slowly while more came in from behind. Therefore, in the period with the electric pulse on, the volumes of washing solutions from each end changed but all cells were still in the electroporation zone. In each electroporation cycle, 75 μL cell solutions were pumped into the channel, the same amount which is also used in a 2 mm cuvette (Cat # 165-2092) for batch mode bulk Electroporation (BE). A single pulse was given in each electroporation cycle and multiple pulses (~ 16-20 pulses in total) were imposed to process enough cells for biological assays. All solutions from the channel outlet were collected and transferred to a 6-well cell culture plate or a Nunc T-25cm2 filter flask.
Cell Culture
K562 cells, obtained from the American Type Culture Collection (ATCC, Manassas, VA), were cultured in RPMI 1640 media supplemented with 10% heat-inactivated fetal bovine serum (FBS), 100 U/mL penicillin, 100 μg/mL streptomycin, and L-glutamine at 37°C in a humidified atmosphere containing 5% CO2. Mouse embryonic stem (mES) cells were donated by StemCell Technologies (Vancouver, Canada). The mES cells were cultured on gelatin-coated tissue culture flasks and maintained in an undifferentiated state using Dulbecco’s Modified Eagle’s Medium (DMEM with 4.5 g/L D-glucose) supplemented with 15%(v/v) fetal bovine serum (FBS), 100 U/mL penicillin, 100 μg/mL streptomycin, 0.1 mM non-essential amino acids, 10 ng/mL murine recombinant leukemia inhibitory factor (LIF; these reagents were from StemCell Technologies, Vancouver, Canada), 0.1 mM monothioglycerol, 2 mM L-glutamine (Sigma Aldrich, St. Louis, MO) and 1 mM sodium pyruvate (Invitrogen) at 37°C in a humidified atmosphere containing 5% CO2.
DNA Transfection
The plasmid pGFP (gWiz™ GFP, 5757 bp) was obtained from Aldevron. It was mixed with K562 cells in Opti-MEM® at a ratio of 2-10 μg/106 cells. After electroporation, cells were transferred to 6-well tissue culture plates at 106/well in 1.2 mL RPMI1640 medium containing 10% FBS. PBS (300 μL/well) was added to each well and the cells were incubated for 4 hr at 37 °C. The cells were then transferred to fresh medium, incubated for another 24 hr, and analyzed for transfection efficiency and cell viability.
GFP transfection was evaluated both qualitatively, by visualizing the number of cells with green fluorescence within a representative area selected from the entire culture surface under an inverted fluorescence microscope (TE 100, Nikon, Japan) and quantitatively, by counting cells using a four-color flow cytometry system (FACS Calibur, BD Biosciences, CA) 24 hr post transfection. Briefly, 1.5×10⁶ cells/ml was collected after cultured for 24 hr and the percentage of GFP positive cells was calculated quantitatively via flow cytometer. The unstained samples were run first to adjust the voltage setting and compensation of the flow cytometer. Then the tested samples were processed by CellQuest. At least 10,000 events were collected for each sample.
Cell viability was evaluated by a MTS cell proliferation assay (Promega, Madison, WI). Briefly, the cells in 80 μL/well of medium were transferred to a 96-well plate and incubated. Serial dilutions of daunorubicin (0 to 100 μM) in 10 μL were then added and the cells were incubated at 37°C for 4 hr. Another 100 μL fresh medium was then added to each well and the cells were incubated for an additional 24 hr. At this point, 20 μL of CellTiter 96® AQueous One Solution (Promega, Madison, WI) was added to each well and the cells were incubated at 37°C for another 4 hr. Absorbance was measured at 492 nm on an automated plate reader (GENios Pro, Tecan, Switzerland). Data points were represented as the mean ± standard deviation (S.D.) of triplicates, unless otherwise indicated.
To enable in situ process imaging, the whole chip was mounted onto the stage of an inverted epi-fluorescence microscope (TE 2000U, Nikon Japan). Cells stained by calcein AM were used for visualization of the electroporation process with 4x and 10x objective lenses.
RESULTS AND DISCUSSION
Transfection and cell viability for K562 leukemia cells (a suspension cell line)
K562 (a human chronic leukemia cell line) is well-known to be a hard-to-transfect blood cell line. We used K562 cells and pWizGFP as a model system to evaluate our semi-continuous electroporation (SFE) device on suspension cells. K562 cells were porated with unipolar square wave electric pulses (150V, 10-25 ms). Successful transfection of pGFP was observed when cells were inspected 24 hr after electroporation. Many cells emitted green fluorescence as shown in Figure 2a. Such expression could maintain for at least 10 days (which is the longest tests we have done, data not shown). For comparison, electroporation was also carried out under the same conditions in 2 mm cuvettes using the Bio-Rad system (batch mode bulk electroporation or BE in later discussions) and the results are shown in Figure 2b. Efficiency of pGFP transfection from SFE is much better than that from BE. More quantitative comparison was done by counting the percentage of cells with GFP positive 24 hr post electroporation using flow cytometry. The results are shown in Figure 2c. About 100% improvement of transfection efficiency (from ~5% to ~10% for 25 ms pulse) was obtained in the serpentine channel. Here, the transfection efficiency was defined as the number of cells emitting a fluorescence signal to the total number of counted cells in a flow cytometry sample. With a shorter electric pulse (e.g., 10 ms), the transfection efficiency can be further increased to about 15%. We believe such improvement comes from the higher cell survival rate during and after electroporation. As seen in the phase contrast images of cells 24 hr post electroporation (Figures 2a and 2b), a lot of cell debris (the dark spots in Figure 2b) were found floating on the culture medium for samples treated by BE while most of cells electroporated by SFE kept their round shape and debris could be hardly found. This suggests that many porated cells in BE did not survive the electroporation process, while the situation was much improved in SFE. Such a high cell survival rate is further confirmed quantitatively by the MTS cell proliferation assay. As shown in Figure 3, about 50% or even higher relative cell viability was obtained from cells treated in SFE while only about 10% or less from BE. Here, the cell viability is defined as the ratio of the light absorbance of the electroporated cell sample to that of the negative control cell sample in MTS assay after a certain period of post electroporation culture (e.g., 24 or 48 hr). It should be mentioned that the transfection efficiency and cell viability used in this study are defined differently from the common definition used in the literature. In the commonly used definition, the transfection efficiency (or cell viability) is defined as the cell transfection (or number of live cells) 24 hr or 48 hr post transfection divided by the number of cells survived right after transfection. Such definitions emphasize the fate of cells survived after transfection. Our definitions, on the other hand, are more relevant for the flow-through transfection system because one of our main goals is to have high cell throughput. Therefore, a high cell survival rate is essential.
Figure 2.
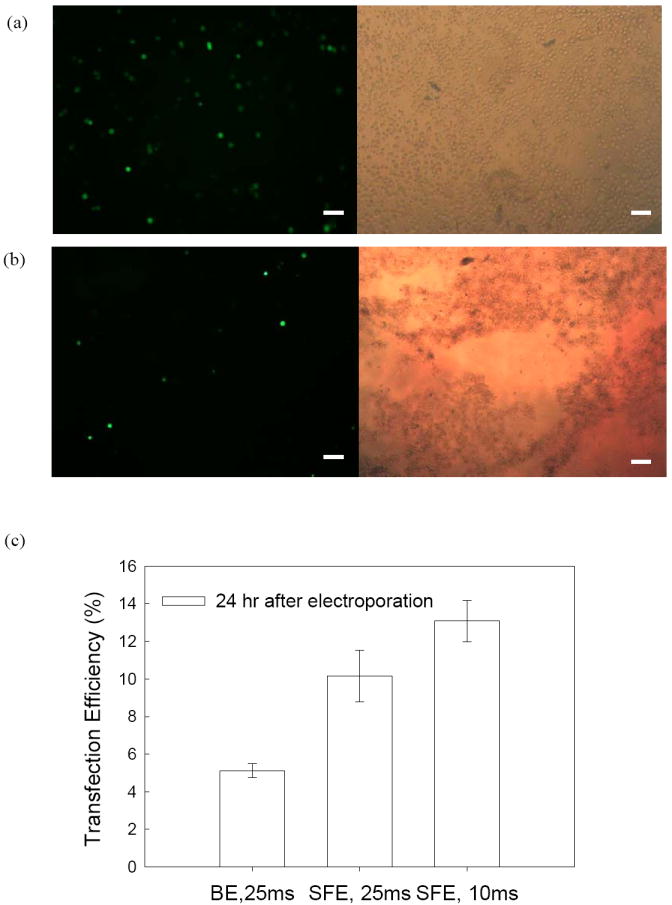
Comparison of GFP Expression of K562 cells in (a, c) SFE and (b, c) BE. Experimental conditions: 150V/2 mm, 10 or 25 ms unipolar square-wave pulses. Cell number is 0.5×10⁶ cell/ml in (a) & (b) and 1.5×10⁶ cell/ml in (c). Flow cytometry data are plotted with the standard deviation from the mean (n=3). The scale bars represent 100 μm.
Figure 3.
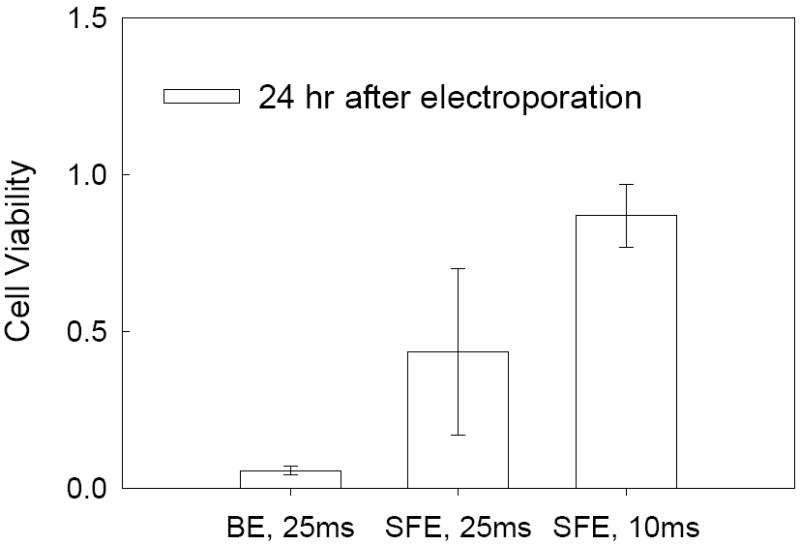
Comparison of cell viability of K562 cells in SFE and BE. Cells were taken from the same samples as in Figure 2.
Transfection and cell viability for mouse embryonic stem cells (an adherent cell line)
Besides suspension cells, we also compared BE and SFE for adherent cells. Mouse embryonic stem cells (mES cells) were chosen here as our model adherent cell line. The evaluation was again focused on the efficiency of transgene expression and cell viability. For mES cells, both square waves (results not shown) and exponentially decaying pulses were tested and it turned out that the exponentially decaying pulses could achieve better transfection efficiency. After a pre-screening test, two different conditions (125V, 500μF and 150V, 250μF) were found to have the best GFP expression. Successful transfection of pGFP was observed for both SFE and BE. In both cases, many mES cells emitted green fluorescence (Figures 4a and 4b) and such observation was further confirmed quantitatively with flow cytometry results (Figure 4c): i.e., they achieved a similar level of GFP expression. However, we observed a major difference in cell morphology between the two cases after culturing 24 and 48 hours post electroporation. Cells porated by SFE kept their normal shape and were attached to the surface of the seeded layer in the cultured well (Figure 4a), while a lot of cells treated by BE became suspended in the cultured medium with a round shape (Figure 4b) suggesting changes in the physiological response of these cells. MTS assays showed ~25% cell viability for BE and ~40%-60% cell viability for SFE (Figure 5). Apparently, the damage caused by BE resulted in a lower cell growth rate (or low cell viability 24 hr post electroporation). The high cell viability from SFE is particularly valuable for embryonic stem cells because, unlike cancer cell electroporation which is mainly used for in vitro pharmacokinetic studies, gene transfected embryonic stem cells have many valuable ex vivo applications, including tissue engineering.
Figure 4.
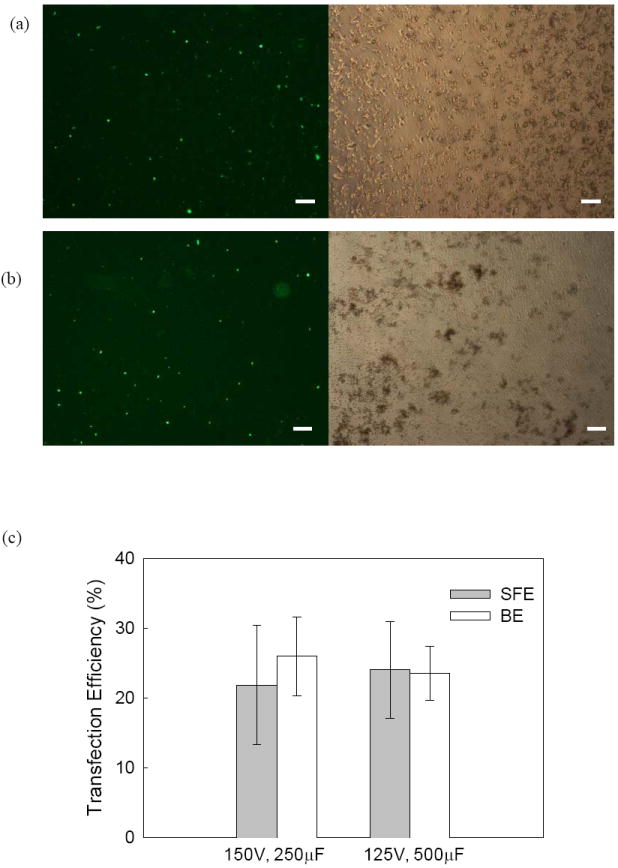
Comparison of GFP Expression of mES cells in (a,c) SFE and (b,c) BE. Experimental conditions: exponentially decaying pulses. Cell number is 0.5×10⁶cell/ml in (a) & (b) and 1.5×10⁶ cell/ml in (c). Flow cytometry data are plotted with the standard deviation from the mean (n=3). The scale bars represent 100 μm.
Figure 5.
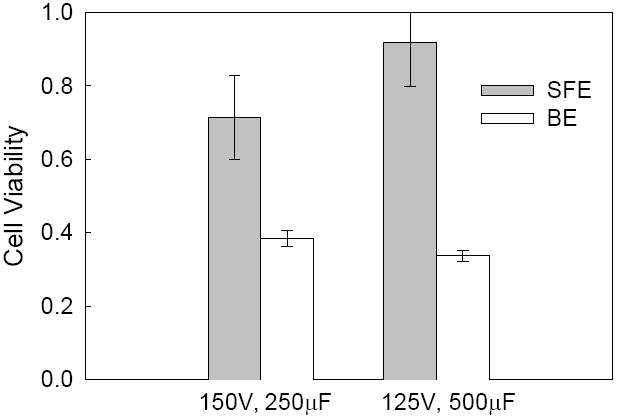
Comparison of cell viability of mES cells in SFE and BE. Cells were collected from the same samples as in Figure 4.
Bubble Formation in Electroporation
To explain why the SFE method worked better than BE, both the serpentine channel and the 2 mm cuvette were mounted on the stage of an inverted fluorescence microscopy (TE 2000U, Nikon, Japan) and the process was recorded at a frame rate of 20 frames/s. Electric pulses were applied through wire extension from the Bio-Rad shockpod chamber. K562 Cells stained with calcein AM were used here, following a protocol provided by the vendor (Invitrogen). For electroporation in cuvettes, it was difficult to observe clearly what happened after imposing electric pulses when the cuvette stood straight up (Figures 6a and 6b). The quality of wide field images was greatly affected by the long light path and interference from moisture and bubbles formation. To avoid this problem, the cuvette was laid horizontally with its opening end sealed and a hole was drilled on its side surface for liquid loading. In this way, the liquid level in the cuvette (the light path) was greatly reduced and the image quality was much improved. As seen in Figures 6c, many larger gas bubbles were observed near the cathode after an electric pulse was imposed and many cells were packed between these bubbles. Cells moved randomly at the moment of electroporation. The situation was quite different in the serpentine channel. Not many bubbles (especially large bubbles) and trapped cells were observed near the electrodes at a 100x magnification (Figures 6e and 6f). To have a complete picture of how the moving cells respond to an electric pulse, a 500 um-wide serpentine channel was used and the other dimensions of the SFE channel were scaled-down correspondingly. The imposed electric bias was also reduced to 37.5 V (1/4 of 150V, scaled-down with a simple formula, V2 = (d2/d1) V1, where V1 and V2 are the electric voltage for channels with a width of d1, and d2, respectively).
Figure 6.
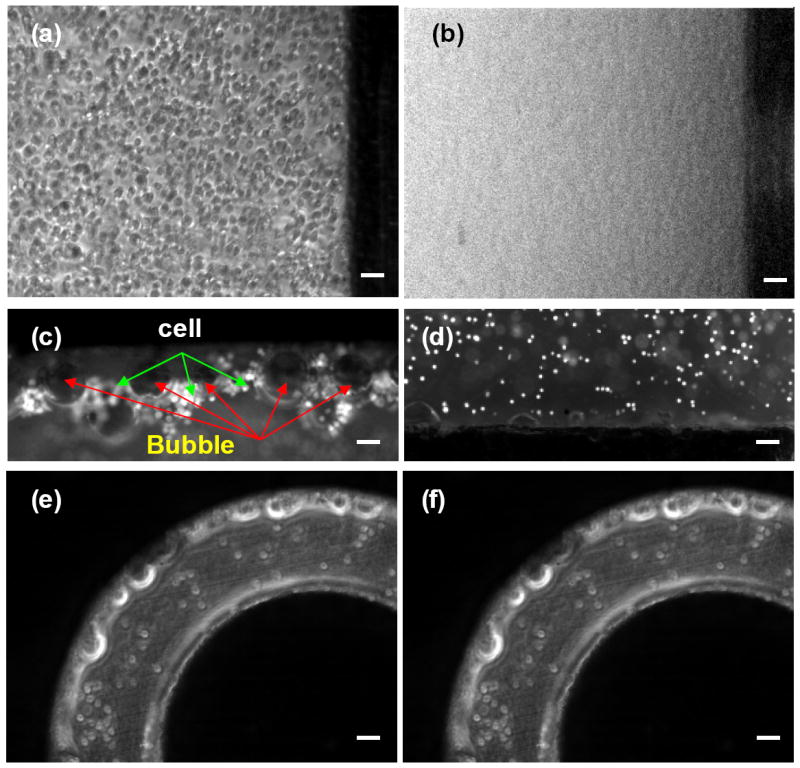
Dynamics of bubble formation in BE (a-d) and in SFE (e, f): (a), (e) before and (b), (c), (d), (f) after an electric pulse. Images of (c) and (d) were taken in the region close to the cathode and anode electrodes of BE, respectively. The scale bars represent 100 μm.
Gas bubble formation is recognized as an existing problem in electroporation, but its damage to cells has not been well documented. The electrolysis of water is the major source of gas bubble formation while joule heating elicits the bubbles to grow, rise and burst. The electrolysis of water mainly occurs at the cathode where H2 gas is produced:
| (1) |
Since the applied electric bias (150 V) was much higher than the minimum voltage required for water electrolysis (~1.3 V), the bubble formation problem was observed in regions near the cathode, as shown in Figures 6c and 6d. It was reported that the electrolysis of water may lead to a change of the pH value close to the Al electrodes and such unfavorable local pH values would cause cell damage42. Other issues, such as the dissolution of Al at the anode, should have a limited effect on electroporation or cell viability since only short electric pulses (10-25 ms) are used in our design and the chip is disposable. For better results, gold or platinum can be chosen as the electrode material. Since these reactions existed in both SFE and BE experiments, the difference between SFE and BE must originate from other sources.
Bubbles will grow, rise and burst when reaching the air-liquid surface. In BE, gas bubbles grew and aggregated at the top of the cuvette (i.e., the air-liquid surface). A high convection of liquid caused by bubble formation could occur and many bubbles travel a long distance (several millimeters). Since many cells were trapped around the bubbles, bubble growth, rising and bursting could cause detrimental damage to cells. The damage varied from an impact on the cell physiological response to complete cell lysis, depending on the poration conditions, such as pulse type, strength and duration and ion strength in the electroporation solution. In the 2D serpentine channel, such a bubble formation problem was not observed. Instead, a pulsatile convective backflow motion of cells was observed when the electric pulses were imposed, possibly coming from the electroosmosis effect45. Such motion elicits additional stress on the cell membrane, which may contribute positively on gene transfection46. This effect needs to be further investigated.
Joule Heating in Electroporation
Gas bubbles themselves would not cause lethal damage to cells if they didn’t grow and burst. We believe that joule heating plays an important role here because it accelerates bubble growth, rising and bursting. Moreover, a transient temperature increase, resulting from joule heating, could worsen cell survival, especially when the cell membrane has been porated. To estimate the impact of joule heating in electroporation, a CFD simulation was carried out, following a model established by others47. In this model, the electric field is calculated by equation 2, neglecting the influence from electroosmosis (EO). This should not cause large computational errors since the pulse duration is very short (~ 10 and 25 ms) and EO is only effective during that period. Furthermore, the electroporation solution used (Opti-MEM) has a high ion concentration, leading to a very thin electric double layer (EDL) and low EO.
| (2) |
Joule heating in the fluid is described by
| (3) |
and heat transfer into the solid part is described by
| (4) |
The change in conductivity from temperature variation is estimated as
| (5) |
Where, λ is the electric conductivity of the solution (in S/m), Φ is the electric potential (in V), ρ is the density of the solution (in kg/m3), Cp is the specific heat (in J/kg-K), T is the temperature (in K), V is the velocity vector, k is the thermal conductivity (in W/m-K), and α is the electric conductivity coefficient. Subscript 0 represents the variable value at T0 (=288 K). For the 2 mm cuvette, the whole domain is divided into a hexahedral mesh with a cell size of 0.1×0.1×0.2 mm (total number of grids is 237,200, Figure 7a, I). Because of its symmetric geometry, our CFD computation was only focused on 1/4 part of the device (Figure 7a, II). For the serpentine channel, both hexahedral and prism meshes were used to handle its more complicated geometry. Near the interfaces of the aluminum electrodes and the electroporation solution, the boundary layer grids were used. The plastic film region was represented by five grid layers with a grid height of 0.01 mm (total number of grids is 339,240). The boundaries connected to PMMA were set to be adiabatic and those connected to air were set to a constant temperature of 288K (the temperature in the operation tissue culture hood). The electric plus (with a voltage of 150 V) was added to the two aluminum electrodes (separated by a distance of 2 mm) for 10 or 25 ms, the same conditions used in our experiments. In both cases, the following parameters were used: λ0=1.0 Ω-1m-1, T0=288 K, α=3 %. The value of other parameters used in our simulations is listed in Table 1. The computation time step is 0.5 ms.
Figure 7.
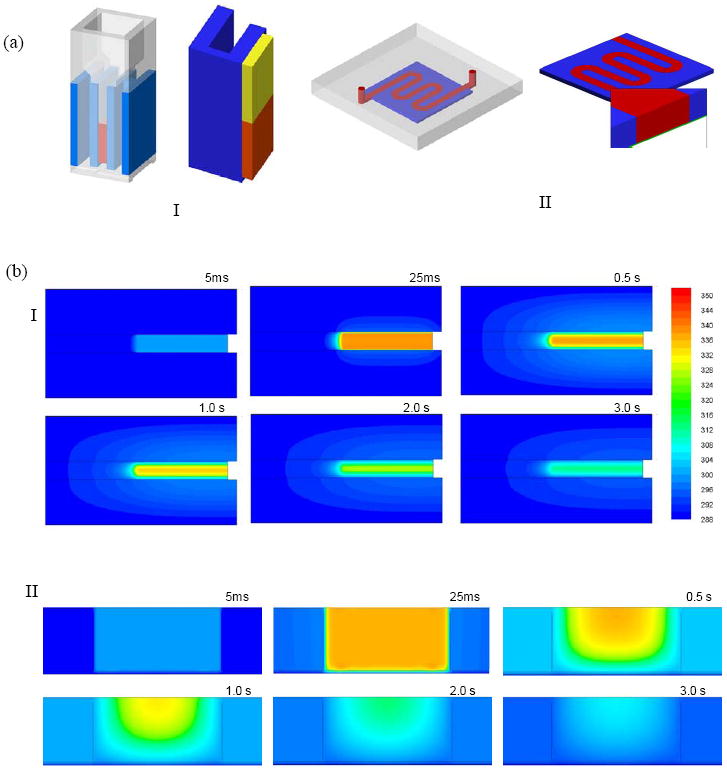
(a) Geometries of BE (I) and SFE (II) in our CFD simulation on joule heating; (b) snapshot images of the temperature profile in BE (I) and SFE (II) at different moments during and after electroporation; (c) the average temperature rise inside both a serpentine channel and a 2 mm cuvette during electroporation (150V, 25 ms); (d) the average temperature drop inside devices after a single electric pulse (150V, 10 and 25 ms).
Table 1.
Parameters used in the CFD simulation on Joule heating.
| ρ (kg/m3) | Cp (J/kg-K) | k (W/m-K) | |
|---|---|---|---|
| Buffer | 1030 | 4179 | 0.61 |
| Air | 1.2 | 1006 | 0.0242 |
| Aluminum | 2719 | 871 | 202.4 |
| Plastics | 1030 | 1100 | 0.18 |
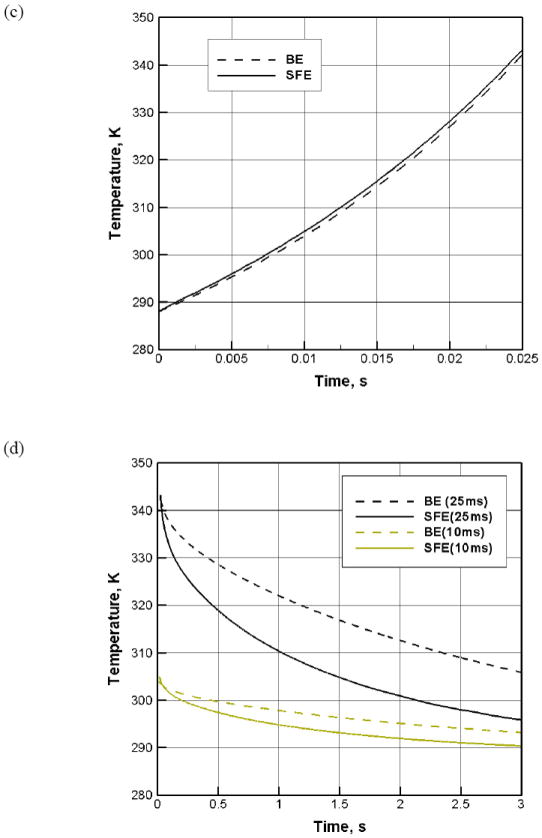
For a typical electroporation protocol (e.g., 150V, 25 ms), we found that the heat generation during the pulse period was not much different in BE and SFE (Figures 7b and 7c). However, the heat transfer was much faster in SFE (Figures 7b and 7d). In about 1.0 second after the pulse, the average temperature in a serpentine channel has already dropped below 37°C, while it took more than 2.3 seconds for a 2 mm cuvette to cool down to the same temperature. Heat can be more efficiently transferred out of the cell solution in SFE. This difference comes from the large temperature gradient between the two sides of the plastic film and a large heat transfer area in the serpentine channel. The rapid temperature drop in SFE benefits cell viability in two ways: a more benign environment to the porated cells and less bubble growth and bursting damage after electroporation. The longer the pulse duration, the more significant in hear transfer difference between the two devices (Figure 7d). Interestingly, a temperature gradient in the thickness direction is present in the serpentine channel as shown in Figure 8: temperature is lower near the bottom surface (the plastic film) than near the top surface (the thick PMMA side). As most cells are close to the bottom surface because of the influence of gravity, such temperature non-uniformity benefits those cells staying away from the high temperature zones in SFE. In the 2 mm cuvette, the bottom surface is a thick plastic wall and most heat is transferred out through the two Al electrode surfaces in the transverse direction. Therefore, it cannot provide the same beneficial temperature gradient as in SFE.
Figure 8.
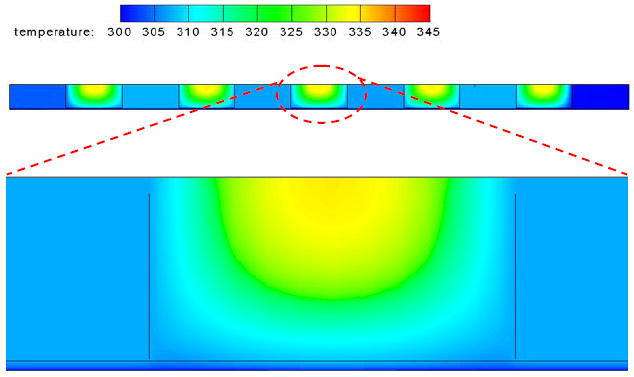
The temperature profile in SFE in the thickness direction at t=1.0 s after a single electric pulse (150V, 25 ms).
CONCLUSION
A serpentine channel made of Al on a plastic chip was designed, fabricated and tested for a semi-continuous electroporation process. Using pWizGFP plasmid and K562 & mES cells as models, SFE showed high transgene expression. Cell lysis during poration was greatly avoided with no observable cell debris and the cell viability could be over 50%. The improvement comes from less gas bubble formation and joule heating. This approach provides an efficient way for the delivery of therapeutic materials into a large number of cells.
Acknowledgments
The authors would like to thank Dr. Chunhe Zhang and Mr. Lei Li at The Ohio State University for Al sample polishing and the NIH/National Institute of Biomedical Imaging and Bioengineering (NIBIB) (Grant No. R21EB008247) and Nanoscale Science and Engineering Center for Affordable Nanoengineering of Polymeric Biomedical Devices (Grant No. EEC-0425626) for financial support.
Contributor Information
Shengnian Wang, Institute for Micromanufacturing and Chemical Engineering Program, Louisiana Tech University, Ruston, Louisiana 71272.
Xulang Zhang, Department of Chemical and Biomolecular Engineering, NSF Center for Affordable Nanoengineering of Polymer Biomedical Devices (CANPBD), The Ohio State University, 140w 19th Avenue, Columbus, Ohio 43210.
Weixiong Wang, Department of Chemical and Biomolecular Engineering, NSF Center for Affordable Nanoengineering of Polymer Biomedical Devices (CANPBD), The Ohio State University, 140w 19th Avenue, Columbus, Ohio 43210.
L. James Lee, Department of Chemical and Biomolecular Engineering, NSF Center for Affordable Nanoengineering of Polymer Biomedical Devices (CANPBD), The Ohio State University, 140w 19th Avenue, Columbus, Ohio 43210.
References
- 1.Chang DC, Chassy BM, Saunder JA. Guide to electroporation and electrofusion. Academic; San Diego: 1992. [Google Scholar]
- 2.Neumann E, Kakorin S. Radiol Oncol. 1998;32:7–17. [Google Scholar]
- 3.Yin LH, Fu SQ, Nanakorn T, Garcia-Sanchez F, Chung I, Cote R, Pissorno G, Hanania E, Heimfeld S, Crystal R, Deisseroth A. Stem Cells. 1998;16S1:247–250. doi: 10.1002/stem.5530160830. [DOI] [PubMed] [Google Scholar]
- 4.Wu S-C, Huang GY-L, Liu J-H. Biotech Progr. 2002;18:617–622. doi: 10.1021/bp020026p. [DOI] [PubMed] [Google Scholar]
- 5.Strair RK, Miller JS, Roberts BE. J Virology. 1988;62:2143–2149. doi: 10.1128/jvi.62.6.2143-2149.1988. [DOI] [PMC free article] [PubMed] [Google Scholar]
- 6.Gore ME. Gene Ther. 2003;10:4. [Google Scholar]
- 7.Marshall E. Clinical Trials. 1999;286:2244–2245. [Google Scholar]
- 8.Schmid RM, Weidenbach H, Draenert GF, Liptay S, Luhrs H, Adler G. Gut. 1997;41:549–556. doi: 10.1136/gut.41.4.549. [DOI] [PMC free article] [PubMed] [Google Scholar]
- 9.Mehier-Humbert S, Guy RH. Adv Drug Deliv Rev. 2005;57:733–753. doi: 10.1016/j.addr.2004.12.007. [DOI] [PubMed] [Google Scholar]
- 10.Wells DJ. Gene Ther. 2004;11:1363–1369. doi: 10.1038/sj.gt.3302337. [DOI] [PubMed] [Google Scholar]
- 11.Chou T-HW, Biswas S, Lu S. Methods in Molecular Biology. 2004;245:147–165. doi: 10.1385/1-59259-649-5:147. [DOI] [PubMed] [Google Scholar]
- 12.Han R, Reed CA, Cladel NM, Christensen ND. Vaccine. 2000;18:2937–2944. doi: 10.1016/s0264-410x(00)00110-9. [DOI] [PubMed] [Google Scholar]
- 13.Wang S, Joshi S, Lu S. Methods in Molecular Biology. 2004;245:185–196. doi: 10.1385/1-59259-649-5:185. [DOI] [PubMed] [Google Scholar]
- 14.Vanegas PE, Valdez-Morales M, Valverde ME, Cruz-Hernandez A, Paredes-Lopez O. Plant Cell, Tissue and Organ Culture. 2006;84:359–363. [Google Scholar]
- 15.Uchida M, Natsume H, Kishino T, Seki T, Ogihara M, Juni K, Kimura M, Morimoto Y. Vaccine. 2006;24:2120–2130. doi: 10.1016/j.vaccine.2005.11.027. [DOI] [PubMed] [Google Scholar]
- 16.Salem AK, Searson PC, Leong KW. Nat Mater. 2003;2:668–671. doi: 10.1038/nmat974. [DOI] [PubMed] [Google Scholar]
- 17.Capecchi Cell. 1998;22:479–488. [Google Scholar]
- 18.Gordon JW, Scangos GA, Plotkin DJ, Barbosa JA, Ruddle FH. PNAS. 1980;78:6376–6380. doi: 10.1073/pnas.77.12.7380. [DOI] [PMC free article] [PubMed] [Google Scholar]
- 19.Gehl J. Acta Physiol Scand. 2003;177:437–447. doi: 10.1046/j.1365-201X.2003.01093.x. [DOI] [PubMed] [Google Scholar]
- 20.Gao J, Yin XF, Fang ZL. Lab Chip. 2004;4:47–52. doi: 10.1039/b310552k. [DOI] [PubMed] [Google Scholar]
- 21.Fei Z, Wang S, Xie Y, Brian H, Koh C, Lee LJ. Anal Chem. 2007;79:5719–5722. doi: 10.1021/ac070482y. [DOI] [PubMed] [Google Scholar]
- 22.McClain MA, Culbertson CT, Jacobson SC, Allbritton NL, Sims CE, Ramsey JM. Anal Chem. 2003;75:5646–5655. doi: 10.1021/ac0346510. [DOI] [PubMed] [Google Scholar]
- 23.Lee S-W, Tai Y-C. Sens Actuators A. 1999;73:74–79. [Google Scholar]
- 24.Suehiro J, Shutou M, Hatano T, Hara M. Sens Actuators B. 2003;96:144–151. [Google Scholar]
- 25.Lu H, Schmidt MA, Jensen KF. Lab Chip. 2005;5:23–29. doi: 10.1039/b406205a. [DOI] [PubMed] [Google Scholar]
- 26.Khine M, Lau A, Ionescu-Zanetti C, Seo J, Lee LP. Lab Chip. 2005;5:38–43. doi: 10.1039/b408352k. [DOI] [PubMed] [Google Scholar]
- 27.Khine M, Ionescu-Zanetti C, Blatz A, Wang L, Lee LP. Lab Chip. 2007;7:457–462. doi: 10.1039/b614356c. [DOI] [PubMed] [Google Scholar]
- 28.Wang H, Bhunia A, Lu C. Biosens Bioelectron. 2006;22:582–588. doi: 10.1016/j.bios.2006.01.032. [DOI] [PubMed] [Google Scholar]
- 29.Huang Y, Rubinsky B. Sens Actuators A. 2001;89:242–249. [Google Scholar]
- 30.Wang H, Lu C. Biotechnol & Bioeng. 2006;95:1116–1125. doi: 10.1002/bit.21066. [DOI] [PubMed] [Google Scholar]
- 31.Wang H, Lu C. Anal Chem. 2006;78:5158–5164. doi: 10.1021/ac060733n. [DOI] [PubMed] [Google Scholar]
- 32.Wang J, Lu C. Applied Physics Letters. 2006;89:234102/1–3. [Google Scholar]
- 33.Skelley AM, Kirak O, Suh H, Jaenisch R, Voldman J. Nat Methods. 2009;6:147–152. doi: 10.1038/nmeth.1290. [DOI] [PMC free article] [PubMed] [Google Scholar]
- 34.Lin YC, Jen CM, Huang MY, Wu CY, Lin XZ. Sens Actuators B. 2001;79:137–143. [Google Scholar]
- 35.Huang Y, Rubinsky B. Sens Actuators A. 2003;104:205–212. [Google Scholar]
- 36.Shin Y, Cho K, Kim J, Lim S, Park C, Lee K, Park Y, Chun C, Han D, Chang J. Anal Chem. 2004;76:7045–7052. doi: 10.1021/ac0496291. [DOI] [PubMed] [Google Scholar]
- 37.Lin Y, Li M, Wu C. Lab Chip. 2004;4:104–108. doi: 10.1039/b312804k. [DOI] [PubMed] [Google Scholar]
- 38.Kim J, Cho K, Shin Y, Jung N, Chung C, Chang J. Biosens Bioelectron. 2007;22:3273–3277. doi: 10.1016/j.bios.2007.02.009. [DOI] [PubMed] [Google Scholar]
- 39.Jain T, Muthuswamy J. Lab Chip. 2007;7:1004–1011. doi: 10.1039/b707479d. [DOI] [PubMed] [Google Scholar]
- 40.Wang J, Bao N, Paris L, Wang H, Geahlen R, Lu C. Anal Chem. 2008;80:1087–1093. doi: 10.1021/ac702065e. [DOI] [PMC free article] [PubMed] [Google Scholar]
- 41.Yang S, Huang K, Chen H, Lin Y. Sens Actuators B. 2008;132:551–557. [Google Scholar]
- 42.Kim J, Cho K, Shin Y, Lee W, Jung N, Chung C, Chang J. Biosens Bioelectron. 2008;23:1353–1360. doi: 10.1016/j.bios.2007.12.009. [DOI] [PubMed] [Google Scholar]
- 43.Guignet EG, Meyer T. Nat Methods. 2008;5:393–395. doi: 10.1038/nmeth.1201. [DOI] [PMC free article] [PubMed] [Google Scholar]
- 44.Stewart DA, Gowrishankar TR, Jr, Weaver JC. IEEE Transactions on Plasma Science. 2004;32:1696–1708. [Google Scholar]
- 45.Lee W, Bang H, Yun H, Min J, Chung C, Chang J, Han D. Lab Chip. 2008;8:224–226. doi: 10.1039/b714371k. [DOI] [PubMed] [Google Scholar]
- 46.Zheng Q, Chang DC. Biochim Biophys Acta. 1991;1088:104–110. doi: 10.1016/0167-4781(91)90158-i. [DOI] [PubMed] [Google Scholar]
- 47.Erickson D, Sinton D, Li D. Lab Chip. 2003;3:141–149. doi: 10.1039/b306158b. [DOI] [PubMed] [Google Scholar]