

Summary
Cell density in the corneal stroma is typically determined by counting the number of bright objects, presumably keratocyte nuclei, in images from clinical confocal microscopy. We present a program that identifies bright objects and counts those that most likely represent cells. Selection variables were determined from 125 normal corneas with cell densities that had been assessed manually. The program was tested on 17 corneas of patients before and at several intervals to 5 years after laser in situ keratomileusis (LASIK) surgery. In these corneas, which showed a decrease in cell density after surgery, the program identified cells as well as human observers did.
Keywords: cell density, confocal microscopy, cornea, image processing, keratocyte density, keratocyte
Introduction
Keratocytes are fibroblast-like cells that maintain the health and clarity of the corneal stroma. Several investigators have examined changes in density of these cells with age (Moller-Pedersen, 1997; Mustonen et al., 1998; Hollingsworth et al., 2001; Patel et al., 2001; Berlau et al., 2002), with contact lens wear (Jalbert & Stapleton, 1999; Efron et al., 2002a, b; Patel et al., 2002; Kallinikos & Efron, 2004; Kallinikos et al., 2006), after refractive surgery (Frueh et al., 1998; Erie et al., 1999; Moller-Pedersen et al., 2000; Vesaluoma et al., 2000; Pisella et al., 2001; Mitooka et al., 2002; Erie, 2003; Erie et al., 2003, 2004, 2006; Perez-Gomez & Efron, 2003), and after corneal transplantation (Bourne, 2001; Mikek et al., 2003; Imre et al., 2005). These studies all required non-invasive and accurate estimates of keratocyte density in corneas of study subjects and patients.
Keratocyte nuclei scatter and reflect a small amount of light and are sometimes visible during slit lamp examination (Moller-Pedersen, 2004), although they are more prominent in clinical confocal images of the stroma. Keratocyte density in human corneas has been estimated from confocal images by counting the number of bright objects (assumed to be keratocyte nuclei) in a field of known area and dividing by the sample volume, the area multiplied by the effective depth offield (Patel et al., 1999; Popper et al., 2004; McLaren et al., 2005), although Berlau and coworkers (2002) estimated density from the number of cells distributed through several frames. Some investigators have reported cell density in terms of cells per unit area for a particular confocal microscope (Frueh et al., 1998; Mustonen et al., 1998; Prydal et al., 1998; Jalbert & Stapleton, 1999; Vesaluoma et al., 2000; Hollingsworth et al., 2001; Pisella et al., 2001; Perez-Gomez & Efron, 2003; Vanathi et al., 2003).
The accuracy and precision of manually counting cell nuclei depends on the ability of the observer to discriminate nuclei from the background noise in the image and to interpret the variable appearance of cell nuclei located at different depths within the optical section of the image. Nuclei with the highest contrast and sharpest edges can be consistently identified, whereas those with lower contrast and blurred edges will be inconsistently identified. Because of this subjectivity, two investigators, or one investigator assessing density in the same images on two sessions, rarely arrive at exactly the same density (McLaren et al., 2001).
A program that identifies and selects cells in confocal images would be more objective than manual assessment of low-contrast images. Programs that count keratocytes have been reported (Prydal et al., 1998; Patel et al., 1999), but none have been used consistently in clinical studies. Patel et al. (1999) described and histologically validated an automated algorithm to estimate keratocyte density in rabbit corneas. However, this method did not work consistently in human corneas and its use has not been demonstrated in a longitudinal study.
In this study, we further developed and refined the algorithm described by Patel et al. (1999) and tested it in confocal images of the human corneal stroma. Cell densities determined by the automated method were compared to densities determined by manually counting keratocyte nuclei in the same images, in a population of patients who received laser in situ keratomileusis (LASIK) and experienced a decrease in cell density.
Methods
Human subjects
All human subjects were participants in other studies in our laboratory, and these studies have been described in other papers. Image variables used in the cell-counting program were defined from confocal scans of 125 corneas of 79 subjects. This sample included 30 normal control corneas of 19 subjects from a study of keratoconus (Erie et al., 2002), 25 pre-operative corneas of 15 patients who received photorefractive keratectomy (PRK) (Erie et al., 1999), 20 corneas of 20 subjects in a study of contact lens wearers (Patel et al., 2002) and 50 corneas of 25 subjects in a study of corneal thickness (Kitzmann et al., 2005; McLaren et al., 2005). Scans were acquired between July, 1998 and July, 2003, and images from these scans were used to define selection criteria in the cell-counting program. The program was tested by assessing cell density in another group of 17 corneas from 11 patients before and at several intervals after LASIK through 5 years (Mitooka et al., 2002; Erie et al., 2004, 2006). All subjects were examined before the study to assure that their corneas and anterior segments were normal. Each subject gave informed consent to participate in the study after the nature and possible consequences of the study had been discussed. All studies were approved by the Institutional Review Board of Mayo Clinic and conformed to the tenets of the Declaration of Helsinki for research involving human subjects.
Confocal microscopy
Corneas were scanned by using a clinical tandem scanning confocal microscope (Tandem Scanning Corporation, Reston, Virginia, U.S.A.), by methods that have been described in detail previously (Patel et al., 1999, 2001). Briefly, the cornea was anaesthetized by instilling topical proparacaine 0.5%, a drop of a viscous coupling solution (Goniak; Akorn Inc., Buffalo Grove, IL, or GenTeal Gel; Novartis Ophthalmics, East Hanover, New Jersey) was placed on the tip of the objective lens, and the objective lens was advanced until this solution contacted the cornea. The objective lens was aligned with the centre of the cornea by centring the light and dark rings in the image of the epithelial surface. The focal plane of the microscope was retracted to inside the objective surface, and then advanced through the cornea at approximately 72 μm s-1 while video images were digitized and stored by a computer at 30 frames s-1. The video camera automatically adjusted its gain to maintain a constant image brightness.
Manual assessment of cell density
Each confocal scan through the stroma was reviewed and 10-12 frames were selected that had clear, non-blurred images of cell nuclei and did not have signs of motion artifacts. In control corneas, two frames were selected in each of five layers of the stroma, the anterior 0-10%, 10-33%, 33-66%, 66-90% and 90-100% of stromal depth (Patel et al., 2001). In corneas after LASIK, two frames were selected in the anterior and posterior half of the flap, the anterior and posterior halves of the region that extended 100 μm deep to the ablated surface, and the regions represented by 66-90% and 90-100% of the pre-LASIK stromal depth (Mitooka et al., 2002). Frames from the equivalent regions of stroma were selected from scans before LASIK.
Cell density was assessed manually by counting bright objects that were presumed to represent keratocyte nuclei inside a pre-defined rectangle (379 μm by 286 μm) by using a simple point-and-click method. Objects that touched the bottom or left edge of the rectangle were counted, but objects that touched the top or right edge were not counted. Each object was marked with an ‘X’ to prevent double counting. Frames from each cornea were presented to the investigator in random order so that the investigator was masked to the depth of the frame in the stroma and the identity of the subject. Cell density was expressed as cells mm-3:
| (1) |
where N is the number of objects counted, A is the area of the selection rectangle, and δ is the effective depth of field, (thefull-width-at-half-maximum of as can through are flecting surface plus the mean axial thickness of a keratocyte nucleus) (Patel et al., 1999; McLaren et al., 2005). We assumed A = 0.109 mm2 and δ = 0.0119 mm (McLaren et al., 2005). One investigator (CBN) assessed cell densities in all confocal images from the study of LASIK patients. Cell densities in the four groups of normal subjects were assessed by three investigators: pre-PRK and controls for the keratoconus study by one investigator, contact lens control corneas by another, and the corneal thickness study by a third (CBN).
Automated assessment of cell density
A program was developed to assess cell density in confocal images by using a scripted language, Tcl/tk (“tool command language/toolkit,” www.tcl.tk), and an image processing program, Analyse AVW (Mayo Medical Ventures, Rochester, Minnesota). The program worked in two steps; first, it identified bright objects in the field, and second, it selected those objects that most likely corresponded to cells based on the image properties of each object.
The algorithm that identified bright objects was similar to the process described by Patel, et al. (1999), although several steps were added to separate cell nuclei that overlapped each other. The original image processing steps are given in Table 1, and the additional steps used to separate overlapping objects are listed in Table 2. These steps created a binary mask of all bright objects in the frame. The mask of each object was isolated one at a time and the area around the object (background) was identified by creating a second mask as a band, approximately 11 pixels (8.6 μm) wide and separated by a 5-pixel gap (3.9 μm) from the object mask. Portions of the background mask that overlapped masks of other cells were excluded. The program calculated several variables including object size, mean and standard deviation of intensity of the object and background, minimum and maximum brightness, and coordinates of the geometric centre, from the areas in the original and processed images defined by the masks of the object and background. Contrast and brightness-area-product (BAP) of each object relative to the background brightness were calculated:
| (2) |
| (3) |
where Ic and Ib are the mean intensities of the cell and background respectively, calculated from the inhomogeneity-corrected image (step 1 in Table 1), and Ac is the area of the cell. After several preliminary trials of images from our control group, we found that cell contrast and BAP were the best variables for selecting objects that the human observers would most likely have identified as cells. The original program used by Patel et al. (1999) selected cells based on size; objects greater than a pre-determined size were counted as cells.
Table 1.
Steps used to identify objects in confocal images of the corneal stroma
| Step | Process | Purpose |
|---|---|---|
| 1 | Inhomogeneity correction | Adjust local brightness to make brightness uniform across field. |
| 2 | Sigma filter | Reduce high-frequency noise. |
| 3 | Adaptive histogram equalization and low-pass filter | Redistribute intensities in image uniformly across full intensity range. |
| 4 | Threshold, 70% full range | Convert to binary image. |
| 5 | Mathematical morphology | Remove very small objects (noise), smooth edges of large objects, open bridges, and close gaps. |
| 6 | Subdivide each object | Separate cells that overlap (Table 2). |
| 7 | Sort objects by size | Objects can be addressed individually. Each object can be used as a mask to the original or processed images. |
Table 2.
Steps to subdivide overlapping objects (expansion of step 6 in Table 1)
| Step | Process | Purpose |
|---|---|---|
| 6a | Select region slightly larger than each object | Operate on subimage. |
| 6b | Mask object in Adaptive Histogram Equalization image | Select object after adaptive histogram equalization (step 3). |
| 6c | Low-pass filter | Reduce noise, smooth peaks and valleys. |
| 6d | Adaptive histogram equalization | Redistribute intensities of cell; increase contrast. |
| 6e | Threshold, 70% full range | Convert to binary. |
| 6f | Homotopic thicken to original cell mask | Thicken objects without allowing them to merge. |
The program examined the image properties of each object and it selected objects with contrast greater than 0.03 and BAP greater than a pre-set threshold. The selected objects were counted as cells if they were entirely inside of a rectangle similar to that used in manual assessment (367 μm by 277 μm) or overlapping the left or bottom edge of the rectangle. Cell density was determined by using Eq. (1) (McLaren et al., 2005).
The optimum BAP threshold (BAPthr) was determined from ten frames in each of 125 confocal scans from our control group. Cell density in each frame was assessed manually. The BAP threshold that forced the program to estimate the same density as the manual assessment was determined iteratively for each frame, and the mean threshold of the ten frames () was calculated for each scan. When the mean background intensity after the adaptive histogram equalization step () was above a specific value (), the decreased as increased. The optimum BAP threshold for a particular frame also varied with depth in the stroma.
In addition, five scans from the LASIK patients at each visit at 1, 3, 6 and 12 months after LASIK were randomly selected and used to determine . During the first post-operative year was elevated compared to that from scans in control subjects. Selection of a subset of scans from the LASIK patients was necessary to include the full range of . During this interval, scans were not available from control subjects who did not participate in the LASIK study.
The program used the BAP threshold to determine which objects most likely represented cells. The BAPthr was selected in two steps, selection of the for the scan and selection of the specific BAPthr for the frame. The program selected based on the value of . If was less than Ib-min, then was set to a constant, but if it was greater than or equal to Ib-min, was determined by:
| (4) |
where m1 and b1 are constants determined by linear regression of and .
The BAP threshold for the ith frame (BAPthr-i) was selected in a second step:
| (5) |
where Ib-ahe-i is the mean intensity of the background regions after adaptive histogram equalization in the frame, and m2 and b2 are constants determined by regression.
The constants m1, b1, m2 and b2 were determined from confocal scans of the 125 normal corneas, and b2 was increased or decreased slightly to further optimize agreement between densities determined manually and automatically.
Cell density in LASIK patients
Cell density was estimated manually and by using the automated method in 17 corneas from 11 patients before and at 1, 3 and 6 months, and at 1, 2, 3 and 5 years after LASIK. These were different corneas than those used to define the constants in Eqs (4) and (5), except for the subjects randomly selected at 1, 3 and 6 months, and 1 year as described in the previous section. The mean of cell densities determined from the two frames from each layer was accepted as the cell density of the layer, and the mean cell density of each cornea was the mean cell density from all six layers, unweighted for the thickness of the layer.
Differences between the estimate of mean cell density of each cornea by the automated and the manual methods were assessed by using generalized estimating equation models, to account for the possible correlation between eyes of the same subjects, at each visit (pre-LASIK through 5 years). Tests were considered significant if P<0.05. The minimum detectable difference was calculated for each non-significant difference by using the standard error from the generalized estimating equation models, and assuming α = 0.05 and β = 0.20. Mean cell densities in each layer after LASIK, determined by manual and automatic assessment, were compared to densities in the same layer before LASIK by using generalized estimating equation models. Significances were adjusted for seven comparisons by using the method of Bonferroni.
Repeatability of manual assessment
Densities in 276 frames from 23 corneas at 2 and 3 years after LASIK were assessed manually a second time, and the correlation coefficient of concordance (Lin, 1989), mean difference and limits of agreement, the mean difference ±2 standard deviations of the mean as described by Bland & Altman (1986), between the first and second assessment were determined. Of these, 108 images from nine corneas at 3 years after LASIK were assessed a third time. Mean densities estimated in the three assessments were compared to each other and to automated density estimates by using paired t-tests.
Results
A typical confocal image from the mid-stroma is shown in Fig. 1. The inset shows two bright objects and their corresponding cell and background masks as identified by the program. Figure 2 shows a mid-stromal frame with manual identification of cell nuclei marked with X’s and automatic identification noted by bounding boxes. Not all objects identified by the observer were identified by the program as cell nuclei, and not all objects identified by the program were identified by the observer. The program required approximately 18 s to assess each frame, while manual assessment required 35-85 s (not including breaks in the work and time between scans required to load the new file), depending on the scan.
Fig. 1.
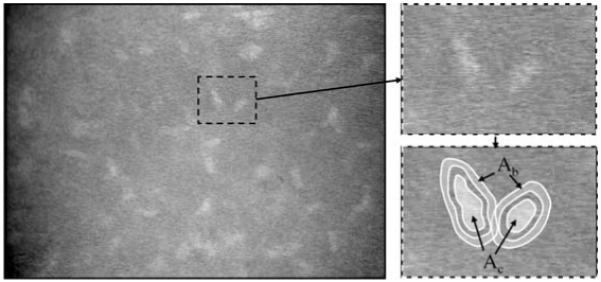
Confocal image of normal mid-stroma. Bright objects represent nuclei, presumably of keratocytes. The subregion around two nuclei is magnified to the right. The areas Ac and Ab are the mask areas of each cell and background respectively, selected by the program. The input or processed image intensities under these areas were used to calculate variables, such as the brightness-area-product and contrast, and these were used to select objects that most likely represented cells.
Fig. 2.
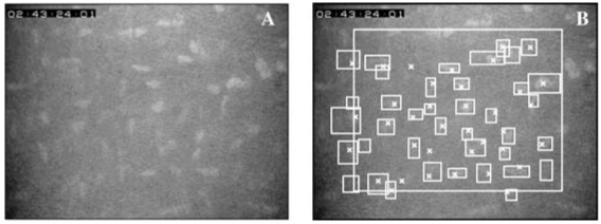
One confocal image before (A) and after counting cells (B). Cells were counted manually within or touching the left or bottom edge of the large rectangle and were indicated with an X. Cells identified by the program were indicated by a bounding box, the smallest rectangle with vertical and horizontal sides that entirely contained the cell. Most cells were identified by both methods, although some were identified by one or the other but not both.
Selection parameters
The relationship between and is shown in Fig. 3. The specific selected by the program is shown as a solid line, and the coefficients of the selection line (Eq. 4) are given in Table 3. The coefficients of Eq. (4) changed after March 1999, a time when the video system was adjusted to optimize the image. The appropriate parameters, depending on the date of the scan, were used with Eq. (4) to determine for each scan.
Fig. 3.
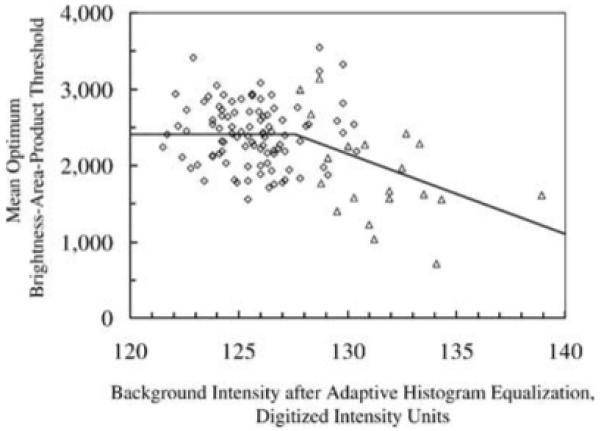
Relationship between mean optimum brightness-area-product threshold () and mean background intensity after adaptive histogram equalization (). Each marker represents the mean across all frames in a scan. The solid line represents the relationship that was used to determine the for a particular scan when was calculated from the images. When was less than 128, was constant (2411), and otherwise it was equal to x m1 + b1 (Eq. 4), where m1 and b1 are given in Table 3. The coefficients m1, b1, and the transition intensity changed after March 1, 1999 (data shown were from scans after this date).
Table 3.
Summary of parameters used to determine the optimum brightness-area-product threshold in Eq. (4)
The relationship between the BAPthr-i and Iahe-i normalized to and is shown in Fig. 4. The constants used in Eq. (5) determined from these data were m2 = 7.652 and b2 =-6.667 before March, 1999, and m2 = 5.477 and b2 = -4.529 after March, 1999.
Fig. 4.
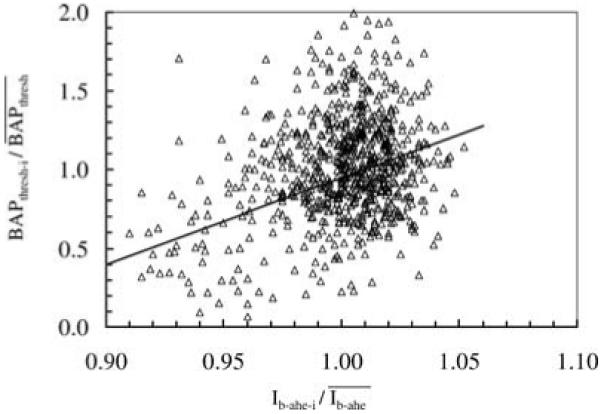
Relationship used to adjust the BAP threshold in individual frames within a scan. Each marker represents data from one frame, and all frames were from normal control corneas described in Methods. The BAP threshold for a particular frame was determined from properties of the image by using Eq. (4) (solid line).
Cell density in control corneas
The mean cell density, unweighted by thickness of the layer, from all corneas used to determine selection parameters, was 28614 ± 10608 cells mm-3 by manual assessment and 28251 ± 9452 cells mm-3 by automatic assessment (± SD, n = 1247 frames). The mean difference was -363 ± 5214 cells mm-3 (automatic - manual, P = 0.014). In the first frame (anterior stroma) of the pre-PRK group of patients, the mean difference between densities by manual and automatic methods was-16320 cells mm-3 and was greater than mean differences in any layer for any other group. The next smaller difference was lessthan 5000 cells mm-3.Whenthis first frame from the pre-PRK group was excluded, the mean densities of all other frames by manual and automatic assessments were 28088 ± 9939 cells mm-3 and 28051 ± 9373 cells mm-3 respectively, and the difference was -37 ± 4518 cells mm-3 (n = 1222 frames, P = 0.78).
Cell density before and after LASIK
The mean cell densities before and after LASIK, determined by both methods, are given in Table 4. Mean cell densities determined by the two methods were within 7.2% of each other throughout the 5 years of the study.
Table 4.
Mean full-thickness cell densities (unweighted for distance between frames) estimated by manual and automatic methods at each examination before and after LASIK
| Mean Cell Density, cells/mm3 Mean ± SD |
||||||||
|---|---|---|---|---|---|---|---|---|
| Pre-LASIK | 1 month | 3 months | 6 months | 1 year | 2 years | 3 years | 5 years | |
| Number of patients | 17 | 17 | 17 | 17 | 17 | 15 | 17 | 16 |
| Manual | 32765 ± 3944 | 28114 ± 4193 | 28338 ± 4246 | 28903 ± 2,326 | 27492 ± 3568 | 26038 ± 2881 | 26195 ± 1739 | 22920 ± 1728 |
| Automatic | 31422 ± 3564 | 27696 ± 2399 | 28130 ± 3258 | 27368 ± 2161 | 25500 ± 2333 | 26460 ± 1755 | 25139 ± 2554 | 24311 ± 2276 |
| Difference | -1343 ± 3047 | -418 ± 3898 | -208 ± 2997 | -1535 ± 2525 | -1993 ± 3575 | 422 ± 2228 | -1056 ± 1503 | 1392 ± 1780 |
| Difference as percent of manual | -4.1 | -1.5 | -0.7 | -5.3 | -7.2 | 1.6 | -4.0 | 6.1 |
| P:* | 0.06 | 0.19 | 0.80 | 0.02 | 0.007 | 0.44 | 0.02 | <0.001 |
| MDD:a | 1857 | 1776 | 2030 | - | - | 1534 | - | - |
Probability, generalized estimating equation models
MDD : minimum detectable difference, cells mm-3, based on generalized estimating equation models, α = 0.05, β = 0.20.
Significances of differences at each visit with cell density before LASIK are shown in Table 5 for each of six layers for manual and automated methods. The pattern of significance by automated assessment was similar to that of manual assessment; cell density was decreased in the flap at all post-LASIK examinations. Density decreased significantly just posterior to the interface (anterior retro-ablation zone) by the automated method at 1 year and later, while according to the manual method significant differences in this region persisted at all measurements after LASIK. The manual method also detected a few differences that the automated method did not, particularly at 3 and 5 years. Manual assessment had slightly more statistical power; the average minimum detectable difference for the comparisons that were not significant was 3932 cells mm-3 with manual assessment and 4219 cells mm-3 with automated assessment.
Table 5.
Significance of difference between cell density after LASIK and density before LASIK
| Significance of difference in cell density from pre-LASIK |
|||||||
|---|---|---|---|---|---|---|---|
| 1 month | 3 months | 6 months | 1 year | 2 years | 3 years | 5 years | |
| Manual Assessment | |||||||
| Anterior flap | 0.0009 | 0.0008 | 0.0006 | <0.0001 | <0.0001 | <0.0001 | <0.0001 |
| Posterior flap | <0.0001 | 0.0005 | <0.0001 | <0.0001 | <0.0001 | <0.0001 | <0.0001 |
| Anterior RAZ | 0.0029 | 0.0015 | <0.0001 | <0.0001 | <0.0001 | <0.0001 | <0.0001 |
| Posterior RAZ | 0.0037 | ns | ns | ns | ns | 0.0044 | <0.0001 |
| 66-90% | 0.0054 | ns | ns | 0.0059 | ns | 0.0057 | <0.0001 |
| 90-100% | ns | ns | ns | ns | 0.0002 | ns | 0.0004 |
| Automatic Assessment | |||||||
| Anterior flap | <0.0001 | <0.0001 | <0.0001 | <0.0001 | <0.0001 | <0.0001 | <0.0001 |
| Posterior flap | <0.0001 | <0.0001 | <0.0001 | <0.0001 | <0.0001 | <0.0001 | <0.0001 |
| Anterior RAZ | ns | ns | ns | 0.0001 | 0.0021 | 0.0003 | <0.0001 |
| Posterior RAZ | ns | ns | ns | ns | ns | ns | ns |
| 66-90% | ns | ns | ns | 0.0059 | ns | ns | <0.0001 |
| 90-100% | ns | ns | ns | ns | ns | ns | ns |
ns = not significantly different (Generalized estimating equation models, Bonferroni correction for seven comparisons, P>0.05/7).
An example of the relationship between manual and automatic assessments of cell densities at the 5-year visit is shown in Fig. 5. The correlation coefficient of concordance was 0.83 (95% confidence interval: 0.79-0.87; Fig. 5A). The mean difference between methods at 60 months was 1392 ± 3881 cells mm-3 and limits of agreement for this example were -6371-9154 cells mm-3 (Fig. 5B).
Fig. 5.
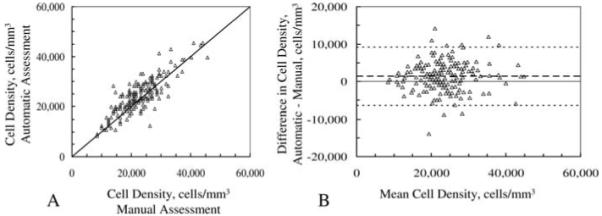
Relationship between automatic and manual assessments of cell density in 16 corneas 5 years after LASIK. Each marker represents densities from one frame. A, correlation between cell densities by automated and manual methods; solid line is identity line. B, difference in estimated cell density between methods vs. mean of both methods, as described by Bland and Altman (Bland & Altman, 1986). Dashed lines represent the limits of agreement, the mean difference ± 2 standard deviations.
Repeated manual assessment
Mean cell densities assessed manually three times in the same frames differed from each other by as much as 3160 cells mm-3 (Table 6). Differences between these three manual assessments and the automatic assessment ranged from -1286 cells mm-3 to 1874 cells mm-3. The relationship between cell densities at 2 and 3 years assessed twice by the same observer is shown in Fig. 6. The correlation coefficient of concordance between the first and second assessment was 0.86 (95% confidence interval: 0.83-0.89; Fig. 6A). The mean difference was 2358 ± 3219 cells mm-3 (P< 0.001) and limits of agreement ranged from -4082 to 8797 cells mm-3 (Fig. 6B).
Table 6.
Mean cell density in three assessments by one observer
| Assessment | Auto | First | Second | Third |
|---|---|---|---|---|
| Cell density, cells mm-3 (± SD) | 24829 ± 6866 | 22956 ± 6676 | 26116 ± 6221 | 23171 ± 6788 |
| Difference in density, cells mm-3a | ||||
| Auto | 1874* ± 4078 | -1286** ± 4187 | 1659* ± 4027 | |
| First | -3160* ± 2947 | -215 ± 3122 | ||
| Second | -2945* ± 2772 |
P<0.0001, paired t-test.
P = 0.002, paired t-test.
Difference in density by assessment indicated in row minus density by assessment indicated in column.
In all assessments n = 108 frames from nine corneas, 3 years after LASIK.
Fig. 6.
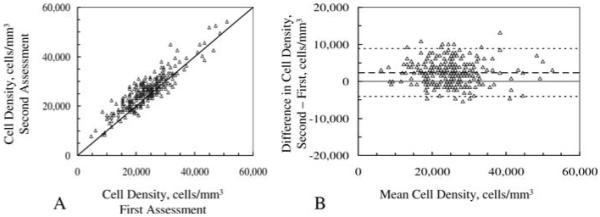
Cell density estimated in same frames by one reviewer in two sessions. A, correlation between two manual assessments of cell density; solid line is identity line. B, difference vs. mean of estimates and limits of agreement. Scans were selected from those recorded 2 and 3 years after LASIK. Variationof differences in two estimates of cell density was similar to variation of differences between one observer and the program (Fig. 5).
Discussion
This program for identifying and counting cells in confocal images of the cornea expands the scope of earlier attempts at estimating cell density automatically. It has a refined algorithm for separating overlapping objects and uses dynamic selection of criteria for discriminating cells from other objects. Selection criteria are based on measurements from each image, and these criteria may vary as characteristics of the microscope and video system vary. The program was designed to emulate a human observer, and the assessment of the large data set from our study of LASIK patients demonstrates that we would have reached a similar conclusion by using the program to assess cell density as we did with manual assessment. Repeatability is the greatest advantage of this program; results will not differ from one assessment to the next as they can with manual assessment. Use of the program also reduces time needed to determine cell density.
Repeatability and accuracy of cell density
Manual assessment of corneal stromal cell density from a clinical confocal image is subjective. An investigator who estimates cell density will rarely identify all of the same objects on repeated assessments of the same frames (Fig. 6). Similarly, two observers who estimate cell density may arrive at considerably different mean densities. Variability from imperfectly identifying all cells in an image determines in part the minimum detectable difference of this measurement in a study.
The subjectivity of manual assessment is partially caused by low contrast between the objects in the field and their background, poorly defined object boundaries, or indistinct texture within an object. Most cell nuclei in a typical stromal image are clearly distinguishable and are identified consistently. However, some nuclei, particularly if they are located near the edge of the focal depth of field, have low contrast or other poorly distinguishing features. An observer might identify low-contrast objects as cell nuclei in one session and as background noise in another session.
A program that uses image processing has the advantage of objectively identifying cell nuclei by using numeric properties of the image. Criteria for identifying cells will always be consistent from frame to frame and subject to subject, and if the image properties remain constant, selection of cells will be consistent, and this is the greatest advantage of using a program for determining cell density. When the image properties changed in our study because of alterations on the microscope, the program was able to select the appropriate BAP threshold based on the image variable Ib-ahe.
The differences between cell densities determined by the program and those determined manually in the same frames were similar to differences between cell density assessed twice by the same investigator (Fig. 5, Table 4). These differences could be attributed to variability in identification of cells by the observer, particularly if many of the cell images are near the limit of visibility.
In spite of these differences, we would have arrived at the same general conclusions concerning the decrease in cell density after LASIK if we had used the program as we did with manual assessment (Table 5). In the flap (layers 1 and 2) densities were decreased significantly by both methods at all times after treatment. In the deeper layers of the stroma the manual method indicated more differences in cell density that were significant, particularly at 3 and 5 years. This is likely a consequence of the slightly lower minimum detectable differences (greater statistical power) that we noted in the manual assessments.
Sources of error
Accurate estimates of cell density, either by manual or automated methods, require high-quality images. Any characteristic that degrades the image, such as poor contrast between cells and background, distortion because of lateral or axial motion, position of the cell near the axial limits of the field, or optical or electronic image noise that degrades boundaries, will render cells less visible and increase the probability that they will be missed by an observer. In the program, the same features could alter the selection variables used by the program and degrade the identification of cells. It is not possible to predict how a particular image change might affect an observer’s ability to identify cells relative to the program’s ability.
Changes in the image properties of the confocal microscope were likely the source of our need to adjust the coefficients of Eqs (4) and (5) after March, 1999. The relationship between the image properties and BAP threshold changed after we had adjusted the microscope and video electronics to optimize the quality of the image. This demonstrates the importance of stability of the confocal images and periodic checks for agreement with manual assessment, particularly after a known adjustment to the microscope. Any change in image characteristics that affects the relationship between the BAP threshold and Ib-ahe could lead to erroneous cell density estimates unless the changes are considered. The equations and coefficients we used to determine BAP threshold are specific for our confocal microscope, and although the principles that we describe can be applied to other systems, the specific selection parameters must be determined for the individual system.
Our model for selecting BAP threshold worked well when we used this method to determine cell density before and after LASIK. At best, this method is only as accurate as our ability to assess cell density manually, however, because the program was designed to emulate manual assessment. This approach is justified by earlier studies where manual assessments of density from confocal images agreed with densities determined histologically in the same corneas (Patel et al., 2001).
Cell densities in one set of images were consistently underestimated by the program, the frames of the anterior-most keratocytes in the pre-PRK subjects. We do not know why these frames were different from others recorded at different times, although the confocal microscope was operating under somewhat different video parameters than it was later, as indicated by the change in selection criteria noted in Table 3. In spite of this mismatch, the program performed well on frames from the same region of stroma in the pre-LASIK patients, images that were recorded at approximately the same time. Differences between manual and automatic methods were not associated with other image variables, such as cell contrast, cell intensity, or Ib-ahe.
The variability of the BAP threshold and its relationship with the image parameter Ib-ahe demonstrates the importance of defining the selection parameters for a particular microscope and camera and any video controls that must be set. Other clinical confocal microscopes, such as the ConfoScan 4 (Nidek Technologies, Srl., Padova, Italy) and the Heidelberg HRT-II with the Rostock Corneal Module (Heidelberg Engineering GmbH, Dossenheim, Germany), produce images with greater contrast between nuclei and background than the Tandem Scanning confocal microscope does. In principle, cell densities determined from these images should be more consistent between automated and manual assessment than from images recorded by microscopes that produce low-contrast images. However, variables used with images from other microscopes to optimize object and cell identification will likely be different from those used in the present study to optimize object identification. Cell selection criteria must be determined or verified by using an independent method of density assessment, such as manually counting cells in a standard image area.
One must recognize that criteria for cell identification may be altered in corneas that are abnormal or have been manipulated as compared to images from normal corneas. For example, if a treatment brings the refractive index of keratocyte nuclei closer to that of the surrounding substance, cell nuclei would become less visible as suggested by Efron et al. (2002a) after overnight contact lens wear. The ability to identify these cells would diminish and the apparent cell density could decrease for both manual and automated assessment. Our best verification of cell density would be to compare density determined by confocal microscopy to that determined by histology in the same tissue. However, this is not an option in most studies, and the next best standard is manual assessment, although as we have shown, manual assessment is variable. Our program is capable of working at least as well as manual assessment in normal and post-LASIK corneas.
Frame selection
In clinical confocal microscopy, some frames are degraded by motion. In these frames, bright objects including cells appear elongated in the direction of movement and faint objects often cannot be distinguished from the background. We selected frames that contained objects with sharp edges and did not show these motion artifacts before we assessed density manually. The automatic selection of high-quality frames for automatic cell density assessment will be another refinement of this program.
In summary, we present an algorithm that identifies bright objects in confocal images of the corneal stroma in vivo. The program was designed to emulate a human observer and its utility was demonstrated by assessing cell density in the same images that were assessed manually in a longitudinal study of LASIK patients. The program detected similar changes in cell density as the manual observer did and we would have arrived at a similar conclusion had we used the automated method. This objective method will improve the repeatability and accuracy of cell density assessment in clinical confocal images of the cornea. The principles of this algorithm can be applied to identifying low-contrast objects in images from other microscopy systems.
Acknowledgement
The authors thank Jon J. Camp, Biomedical Imaging Resource at the Mayo Clinic College of Medicine, for many helpful discussions and for writing the first version of this program.
Supported in part by NIH grant EY 02037 (WM Bourne), Research to Prevent Blindness, Inc., New York, NY, and Mayo Foundation, Rochester, MN.
Footnotes
Presented in part at the annual meeting of the Association for Research in Vision and Ophthalmology, Ft. Lauderdale, FL, May, 2005.
References
- Berlau J, Becker HH, Stave J, Oriwol C, Guthoff RF. Depth and age-dependent distribution of keratocytes in healthy human corneas: a study using scanning-slit confocal microscopy in vivo. J. Cataract Refract. Surg. 2002;28:611–616. doi: 10.1016/s0886-3350(01)01227-5. [DOI] [PubMed] [Google Scholar]
- Bland JM, Altman DG. Statistical methods for assessing agreement between two methods of clinical measurement. Lancet. 1986;1:307–310. [PubMed] [Google Scholar]
- Bourne WM. Cellular changes in transplanted human corneas. Cornea. 2001;20:560–569. doi: 10.1097/00003226-200108000-00002. [DOI] [PubMed] [Google Scholar]
- Efron N, Mutalib HA, Perez-Gomez I, Koh HH. Confocal microscopic observations of the human cornea following overnight contact lens wear. Clin. Exp. Optom. 2002a;85:149–155. doi: 10.1111/j.1444-0938.2002.tb03027.x. [DOI] [PubMed] [Google Scholar]
- Efron N, Perez-Gomez I, Morgan PB. Confocal microscopic observations of stromal keratocytes during extended contact lens wear. Clin. Exp. Optom. 2002b;85:156–160. doi: 10.1111/j.1444-0938.2002.tb03028.x. [DOI] [PubMed] [Google Scholar]
- Erie JC. Corneal wound healing after photorefractive keratectomy: a 3-year confocal microscopy study. Trans. Am. Ophthalmol. Soc. 2003;101:293–333. [PMC free article] [PubMed] [Google Scholar]
- Erie JC, Nau CB, McLaren JW, Hodge DO, Bourne WM. Long-term keratocyte deficits in the corneal stroma after LASIK. Ophthalmology. 2004;111:1356–1361. doi: 10.1016/j.ophtha.2003.10.027. [DOI] [PubMed] [Google Scholar]
- Erie JC, Patel SV, McLaren JW, Hodge DO, Bourne WM. Keratocyte density in the human cornea after photorefractive keratectomy. Arch. Ophthalmol. 2003;121:770–776. doi: 10.1001/archopht.121.6.770. [DOI] [PubMed] [Google Scholar]
- Erie JC, Patel SV, McLaren JW, Hodge DO, Bourne WM. Corneal keratocyte deficits after photorefractive keratectomy and laser in situ keratomileusis. Am. J. Ophthalmol. 2006;141:799–809. doi: 10.1016/j.ajo.2005.12.014. [DOI] [PubMed] [Google Scholar]
- Erie JC, Patel SV, McLaren JW, Maguire LJ, Ramirez M, Bourne WM. Keratocyte density in vivo after photorefractive keratectomy in humans. Trans. Am. Ophthalmol. Soc. 1999;97:221–236. discussion 236-40. [PMC free article] [PubMed] [Google Scholar]
- Erie JC, Patel SV, McLaren JW, Nau CB, Hodge DO, Bourne WM. Keratocyte density in keratoconus. A confocal microscopy study(a) Am. J. Ophthalmol. 2002;134:689–695. doi: 10.1016/s0002-9394(02)01698-7. [DOI] [PubMed] [Google Scholar]
- Frueh BE, Cadez R, Bohnke M. In vivo confocal microscopy after photorefractive keratectomy in humans. A prospective, long-term study. Arch. Ophthalmol. 1998;116:1425–1431. doi: 10.1001/archopht.116.11.1425. [DOI] [PubMed] [Google Scholar]
- Hollingsworth J, Perez-Gomez I, Mutalib HA, Efron N. A population study of the normal cornea using an in vivo, slit-scanning confocal microscope. Optom. Vis. Sci. 2001;78:706–711. doi: 10.1097/00006324-200110000-00010. [DOI] [PubMed] [Google Scholar]
- Imre L, Resch M, Nagymihaly A. In vivo confocal corneal microscopy after keratoplasty. Ophthalmologe. 2005;102:140–146. doi: 10.1007/s00347-004-1083-4. [DOI] [PubMed] [Google Scholar]
- Jalbert I, Stapleton F. Effect of lens wear on corneal stroma: preliminary findings. Aust. N. Z. J. Ophthalmol. 1999;27:211–213. doi: 10.1046/j.1440-1606.1999.00205.x. [DOI] [PubMed] [Google Scholar]
- Kallinikos P, Efron N. On the etiology of keratocyte loss during contact lens wear. Invest. Ophthalmol. Vis. Sci. 2004;45:3011–3020. doi: 10.1167/iovs.04-0129. [DOI] [PubMed] [Google Scholar]
- Kallinikos P, Morgan P, Efron N. Assessment of stromal keratocytes and tear film inflammatory mediators during extended wear of contact lenses. Cornea. 2006;25:1–10. doi: 10.1097/01.ico.0000167877.11687.7e. [DOI] [PubMed] [Google Scholar]
- Kitzmann AS, Winter EJ, Nau CB, McLaren JW, Hodge DO, Bourne WM. Comparison of corneal endothelial cell images from a noncontact specular microscope and a scanning confocal microscope. Cornea. 2005;24:980–984. doi: 10.1097/01.ico.0000159737.68048.97. [DOI] [PubMed] [Google Scholar]
- Lin L. A concordance correlation coefficient to evaluate reproductivity. Biometrics. 1989;45:255–268. [PubMed] [Google Scholar]
- McLaren JW, Nau CB, Kitzmann AS, Bourne WM. Keratocyte density:comparison of two confocal microscopes. Eye Contact Lens: Sci. Clin. Prac. 2005;31:28–33. doi: 10.1097/01.icl.0000151948.92593.c3. [DOI] [PubMed] [Google Scholar]
- McLaren J, Nau CB, Patel SV, Bourne WM. How precisely can we determine keratocyte density by confocal microscopy? Invest. Ophthalmol. Vis. Sci. 2001;42:S281. [Google Scholar]
- Mikek K, Hawlina M, Pfeifer V. Comparative study of human keratocyte density after corneal grafting by using confocal microscopy in vivo. Klin. Monatsbl. Augenheilkd. 2003;220:830–834. doi: 10.1055/s-2003-812554. [DOI] [PubMed] [Google Scholar]
- Mitooka K, Ramirez M, Maguire LJ, Erie JC, Patel SV, McLaren JW, Hodge DO, Bourne WM. Keratocyte density of central human cornea after laser in situ keratomileusis. Am. J. Ophthalmol. 2002;133:307–314. doi: 10.1016/s0002-9394(01)01421-0. [DOI] [PubMed] [Google Scholar]
- Moller-Pedersen T. A comparative study of human corneal keratocyte and endothelial cell density during aging. Cornea. 1997;16:333–338. [PubMed] [Google Scholar]
- Moller-Pedersen T. Keratocyte reflectivity and corneal haze. Exp. Eye Res. 2004;78:553–560. doi: 10.1016/s0014-4835(03)00208-2. [DOI] [PubMed] [Google Scholar]
- Moller-Pedersen T, Cavanagh HD, Petroll WM, Jester JV. Stromal wound healing explains refractive instability and haze development after photorefractive keratectomy: a 1-year confocal microscopic study. Ophthalmology. 2000;107:1235–1245. doi: 10.1016/s0161-6420(00)00142-1. [DOI] [PubMed] [Google Scholar]
- Mustonen RK, McDonald MB, Srivannaboon S, Tan AL, Doubrava MW, Kim CK. Normal human corneal cell populations evaluated by in vivo scanning slit confocal microscopy. Cornea. 1998;17:485–492. doi: 10.1097/00003226-199809000-00005. [DOI] [PubMed] [Google Scholar]
- Patel SV, McLaren JW, Camp JJ, Nelson LR, Bourne WM. Automated quantification of keratocyte density by using confocal microscopy in vivo. Invest. Ophthalmol. Vis. Sci. 1999;40:320–326. [PubMed] [Google Scholar]
- Patel S, McLaren J, Hodge D, Bourne W. Normal human keratocyte density and corneal thickness measurement by using confocal microscopy in vivo. Invest. Ophthalmol. Vis. Sci. 2001;42:333–339. [PubMed] [Google Scholar]
- Patel SV, McLaren JW, Hodge DO, Bourne WM. Confocal microscopy in vivo in corneas of long-term contact lens wearers. Invest. Ophthalmol. Vis. Sci. 2002;43:995–1003. [PubMed] [Google Scholar]
- Perez-Gomez I, Efron N. Change to corneal morphology after refractive surgery (myopic laser in situ keratomileusis) as viewed with a confocal microscope. Optom. Vis. Sci. 2003;80:690–697. doi: 10.1097/00006324-200310000-00010. [DOI] [PubMed] [Google Scholar]
- Pisella PJ, Auzerie O, Bokobza Y, Debbasch C, Baudouin C. Evaluation of corneal stromal changes in vivo after laser in situ keratomileusis with confocal microscopy. Ophthalmology. 2001;108:1744–1750. doi: 10.1016/s0161-6420(01)00771-0. [DOI] [PubMed] [Google Scholar]
- Popper M, Morgado AM, Quadrado MJ, Van Best JA. Corneal cell density measurement in vivo by scanning slit confocal microscopy: method and validation. Ophthalmic Res. 2004;36:270–276. doi: 10.1159/000081207. [DOI] [PubMed] [Google Scholar]
- Prydal JI, Franc F, Dilly PN, Kerr Muir MG, Corbett MC, Marshall J. Keratocyte density and size in conscious humans by digital image analysis of confocal images. Eye. 1998;12:337–342. doi: 10.1038/eye.1998.82. [DOI] [PubMed] [Google Scholar]
- Vanathi M, Tandon R, Sharma N, Titiyal JS, Pandey RM, Vajpayee RB. In-vivo slit scanning confocal microscopy of normal corneas in Indian eyes. Ind. J. Ophthalmol. 2003;51:225–230. [PubMed] [Google Scholar]
- Vesaluoma M, Perez-Santonja J, Petroll WM, Linna T, Alio J, Tervo T. Corneal stromal changes induced by myopic LASIK. Invest. Ophthalmol. Vis. Sci. 2000;41:369–376. [PubMed] [Google Scholar]