

Abstract
Certain polymorphisms reduce serotonin (5-HT) reuptake transporter (5-HTT) function and increase susceptibility to psychiatric disorders. Heterozygous (5-HTT+/−) deficient mice, models for humans with these polymorphisms, have elevated brain 5-HT concentrations and behavioral abnormalities. Since postsynaptic 5-HT2A/2C receptors are coupled to cytosolic phospholipase A2 (cPLA2), which releases arachidonic acid (AA) from membrane phospholipid, 5-HTT deficient mice may have altered brain AA signaling and metabolism. To test this hypothesis, signaling was imaged as an AA incorporation coefficient k* in unanesthetized homozygous knockout (5-HTT−/−), 5-HTT+/− and wild-type (5-HTT+/+) mice, following saline (baseline) or 1.5 mg/kg s.c. DOI, a partial 5-HT2A/2C receptor agonist. Enzyme activities, metabolite concentrations, and head-twitch responses to DOI also were measured. Baseline k* was widely elevated by 20-70% in brains of 5-HTT+/− and 5-HTT−/− compared to 5-HTT+/+ mice. DOI increased k* in 5-HTT+/+ mice, but decreased k* in 5-HTT-deficient mice. Brain cPLA2 activity was elevated in 5-HTT-deficient mice; cyclooxygenase activity and prostaglandin E2 and F2α and thromboxane B2 concentrations were reduced. Head-twitch responses to DOI, while robust in 5-HTT+/+ and 5-HTT+/− mice, were markedly fewer in 5-HTT−/− mice. Pretreatment with para-chlorophenylalanine, a 5-HT synthesis inhibitor, restored head twitches in 5-HTT−/− mice to levels in 5-HTT+/+ mice. We propose that increased baseline values of k* in 5-HTT deficient mice reflect tonic cPLA2 stimulation via 5-HT2A/2C receptors occupied by excess 5-HT, and that reduced k* and head twitch responses to DOI reflected displacement of receptor-bound 5-HT by DOI with a lower affinity. Increased baseline AA signaling in humans having polymorphisms with reduced 5-HTT function might be identified using positron emission tomography.
Keywords: serotonin, arachidonic acid; serotonin transporter; deficient mice; phospholipase A2; eicosanoids
Introduction
Extracellular serotonin (5-hydroxytryptamine, 5-HT) in brain is regulated in part by the presynaptic serotonin reuptake transporter (5-HTT, SLC6A4). Mice with a partial (5-HTT+/−) or complete (5-HTT−/−) 5-HTT deletion, compared with wild-type (5-HTT+/+) mice, differ with regard to brain anatomy; brain concentrations, reuptake, synthesis, and release of 5-HT; 5-HT and GABA receptor densities; programmed cell death, and brain glucose metabolism (Bengel et al, 1998; Esaki et al, 2005; Fox et al, 2007a; Fox et al, 2008a; Mathews et al, 2004; Murphy et al, 2008; Murphy and Lesch 2008). They also demonstrate increased anxiety-and depression-like behaviors and reduced aggressiveness on various tests (Fox et al, 2007a; Murphy et al, 2008; Murphy and Lesch 2008).
Reduced serotonergic function in 5-HTT+/− and 5-HTT−/− mice is thought to be comparable to reduced serotonergic function in humans who carry one or two short (S) compared with long (L) alleles of the promoter-region polymorphism of 5-HTT (5-HTTLPR), or who express rs25531 or rs25532 variants of the 5-HTT allele (Murphy et al, 2008; Murphy and Lesch 2008). Thus, studying 5-HTT deficient mice could elucidate dysfunctional serotonergic neurotransmission in humans with these polymorphisms, and suggest new methods for identifying and quantifying this dysfunction.
For example, humans carrying one “S” 5-HTTLPR allele have 50% reductions in 5-HTT expression and function in lymphocytes, platelets and brain, compared with those with the LL genotype (Hu et al, 2006; Murphy et al, 2008; Murphy and Lesch 2008; Praschak-Rieder et al, 2007; Wendland et al, 2008). They also have comparatively elevated anxiety, depression, and aggression-related personality traits and increased susceptibility to depression associated with major negative life events (Caspi et al, 2003; Uher and McGuffin 2008). They respond poorly to selective serotonin reuptake inhibitors (SSRIs) (Hu et al, 2006; Murphy et al, 2004; Serretti et al, 2005), and are at increased risk for bipolar disorder, comorbid disorders accompanying alcoholism, and suicide (Baca-Garcia et al, 2007; Li and He 2007; Marques et al, 2006; Masoliver et al, 2006). Extracellular striatal 5-HT concentrations are 3- and 6-fold higher, respectively, in 5-HTT+/− and 5-HTT−/− than 5-HTT+/+ mice (Mathews et al, 2004). 5-HT2A receptor density is reduced in the striatum but increased in the hypothalamus and septum of 5-HTT−/− compared with 5-HTT+/+ mice, whereas 5-HT2C receptor density is elevated in the amygdala and choroid plexus (Li et al, 2003).
Elevated extracellular 5-HT concentrations would be expected to increase 5-HT occupancy of the postsynaptic 5-HT2A/2C receptors that are coupled to cytosolic phospholipase A2 (cPLA2), and thereby tonically activate cPLA2 (Berg et al, 1998a; Clark et al, 1995; Felder et al, 1990). cPLA2 when activated selectively releases arachidonic acid (AA, 20:4n-6) from membrane phospholipid, to initiate the AA signaling cascade (Fitzpatrick and Soberman 2001; Shimizu and Wolfe 1990). AA and its metabolites (e.g. prostaglandins and endocannabinoids) can modify sleep, neural firing, neurotransmitter release, nociception, cerebral blood flow and gene transcription (Bosetti 2007). We therefore thought it of interest in this paper to see if this cascade is upregulated in 5-HTT deficient mice.
Brain AA signaling involving cPLA2-coupled neuroreceptors can be imaged in unanesthetized rodents by infusing radiolabeled AA intravenously and measuring tracer uptake into brain with quantitative autoradiography (Rapoport 2001; Robinson et al, 1992). k* for AA at baseline or following drug is independent of changes in cerebral blood flow, thus only reflecting brain AA metabolism (Chang et al, 1997). The flux Jin of AA, which represents the rate of regional brain AA consumption since AA can't be synthesized de novo in vertebrate tissue or converted from its circulating precursor, linoleic acid (18:2n-6) in brain (DeMar et al, 2006; Holman 1986; Rapoport et al, 2001), can be calculated as the product of k* and the unesterified plasma AA concentration.
In this paper, we used in vivo brain AA imaging to test whether the reported high levels of brain extracellular 5-HT in 5-HTT deficient mice would tonically stimulate 5-HT2A/2C receptors to augment cPLA2 activity, and thereby elevate baseline values of k* and Jin, and of AA-derived eicosanoid concentrations. We also examined whether these changes would be accompanied by elevated cyclooxygenase (COX) activity and concentrations of COX-derived eicosanoids, since COX-1 and -2 have been reported to be functionally coupled to cPLA2 in brain (Bosetti and Weerasinghe 2003; Fitzpatrick and Soberman 2001; Kaufmann et al, 1996; Ong et al, 1999; Pardue et al, 2003; Sapirstein et al, 2005; Xu et al, 2008). Additionally, we checked if k* responses to (+/−)-2,5-dimethoxy-4-iodophenyl-2-aminopropane (DOI), a partial 5-HT2A/2C agonist (Marek and Aghajanian 1996), would be reduced in 5-HTT deficient mice by displacing already bound 5-HT. The 1.5 mg/kg s.c. DOI dose that we chose has been reported to increase k* for AA significantly in mouse brain regions rich in 5-HT2A/2C receptors (Qu et al, 2005). Finally, we quantified head-twitch responses (HTRs) to DOI as a behavioral test of 5-HT2A receptor function (Willins and Meltzer 1997), before and after pharmacological alteration of extracellular 5-HT (Cesana et al, 1993; Fox et al, 2007b). Parts of this work have been presented in abstract form (Basselin et al, 2007a).
Materials and Methods
Animals
Experiments were conducted following the “Guide for the Care and Use of Laboratory Animals” (National Institute of Health Publication No. 86-23) and were approved by the Animal Care and Use Committee of the Eunice Kennedy Shriver National Institute of Child Health and Human Development. Five- to 9-month-old male 5-HTT+/− and 5-HTT−/− mice and their littermate 5-HTT+/+ controls, derived from a C57BL/6J genetic background (Bengel et al, 1998), were maintained in an animal facility in which temperature, humidity and light cycle were regulated, with free access to water and a fixed diet (Rodent NIH-31 auto 18-4, Zeigler Bros, Gardners, PA). The diet contained (as percent of total fatty acids) 20.1% saturated, 22.5% monounsaturated, 47.9% linoleic, 5.1% α-linolenic, 0.02% AA, 2.0% eicosapentaenoic, and 2.3% docosahexaenoic acid.
Drugs
Unanesthetized mice received 0.9% NaCl (saline) or 1.5 mg/kg s.c. (±)-1-(2.5-dimethoxy-4-iodophenyl)-2-aminopropane hydrochloride (DOI, Sigma-Aldrich, St. Louis MO). [1-14C]AA in ethanol (53 mCi/mmol; 99.4% pure, Moravek Biomedicals, Brea, CA) was evaporated and resuspended in 5 mM HEPES buffer, pH 7.4, which contained 50 mg/ml of bovine serum albumin essentially fatty acid free (Sigma-Aldrich). Tracer purity was ascertained to exceed 99% by gas chromatography, after converting AA to its methyl ester with 1% sulfuric acid in anhydrous methanol. The 5-HT synthesis inhibitor para-chlorophenylalanine (PCPA, 30 mg/ml prepared in distilled deionized water) and the 5-HT precursor 5-hydroxy-L-tryptophan (5-HTP, 5 mg/ml prepared in 5% Tween 80 in distilled water) were obtained from Sigma-Aldrich.
Surgical procedures and tracer infusion
A mouse was anesthetized with 2-3% halothane in O2, and PE 10 polyethylene catheters were inserted into its right femoral artery and vein as reported (Basselin et al, 2006b; Qu et al, 2005). The wound site was closed with 454 Instant Adhesive (Loctite Corp. Hartford, CT) and the mouse was wrapped loosely, with its upper body remaining free, in a fast-setting plaster cast taped to a wooden block. It was allowed to recover from anesthesia for 3 to 4 h in a warming environment maintained at 25°C. Starting 20 min after s.c. DOI or saline injection, 45 μl [1-14C]AA (300 μCi/kg) was infused for 3 min through the femoral vein at a rate of 15 μl/min, using a Hamilton syringe and an infusion pump (Harvard Apparatus Model 22, Holliston, MA). Ten 15-20 μl arterial blood samples were collected at 0, 0.25, 1.0, 1.5, 2.0, 2.8, 3.2, 5.0, 10 and 19 min to determine radioactivity of unesterified AA in the plasma. At 20 min the mouse was killed by an overdose of Nembutal® (50 mg/kg, i.v.). The brain was removed quickly within < 30 s, frozen in 2-methylbutane in dry ice at −40°C, and stored at −80°C until sectioned.
Chemical analysis
The blood samples collected before, during and after [1-14C]AA infusion were centrifuged immediately (30 s at 18,000 g) to obtain plasma, which was stored at −80°C. Total lipids were extracted from 5 μl of thawed plasma with 1 ml chloroform:methanol (2:1, by vol.) and 0.5 ml 0.1 M KCl, using a modified method of Folch (Folch et al, 1957). Radioactivity was determined in 100 μl of the lower organic phase by liquid scintillation counting. As reported previously, greater than 95-98% of total plasma and brain radioactivity at 5 min was radiolabeled AA (Lee et al, 2007). Concentrations of unlabeled unesterified fatty acids were determined in 100-150 μl of frozen arterial plasma collected by heart puncture. Total lipids were extracted by the modified Folch method, and were separated by thin layer chromatography on silica gel 60 plates using the solvent system: heptane/diethyl ether/acetic acid (60:40:3, by vol). Unesterified fatty acids were scraped from the plate and methylated with 1% sulfuric acid (by vol) in anhydrous methanol for 3 h at 70°C, then separated and quantified by gas chromatography using heptadecanoic acid (17:0) as an internal standard.
Quantitative autoradiography and calculations
Frozen brains were cut in serial 20-μm thick coronal sections on a cryostat at −20°C, then placed for 4 weeks together with calibrated [14C]methylmethacrylate standards (Amersham, Arlington Heights, IL) on Ektascan C/RA film (Eastman Kodak Company, Rochester, NY). Radioactivity (nCi/g of brain) in 92 anatomically identified regions (Franklin and Paxinos 1997) was measured bilaterally six times by quantitative densitometry, using the public domain NIH Image program 1.62 (http://rsb.info.nih.gov/nih-image/). Regional AA incorporation coefficients k* (ml/s/g brain) of AA were calculated as (Robinson et al, 1992),
| (Eq. 1) |
where (nCi/g brain) is brain radioactivity at 20 min after the onset of infusion as determined by densitometry, (nCi/ml plasma) is the arterial plasma concentration of labeled unesterified AA as determined by scintillation counting, and t (min) is time after onset of [1-14C]AA infusion. Integrals of plasma radioactivity (input function in denominator) were determined in each experiment by trapezoidal integration, and divided into to calculate k* for each experiment.
Regional rate of incorporation of unesterified AA from plasma into brain phospholipids, Jin (fmol/s/g), was calculated as,
| (Eq. 2) |
where c plasma (nmol/ml) is the plasma concentration of unlabelled unesterified AA.
Brain cPLA2 activity
In separate experiments, mice were anesthetized with Nembutal® (50 mg/kg, i.p.) and decapitated. The brain was rapidly excised, frozen in 2-methylbutane maintained at −40°C with dry ice, and stored at −80°C. Brain hemispheres were homogenized using a Teflon-glass homogenizer in 2 volumes of ice-cold buffer containing 10 mM HEPES, pH 7.5, 1 mM EDTA, 0.34 M sucrose and protease inhibitor cocktail tablet (Complete, Roche, Mannheim, Germany). Homogenates were centrifuged at 14,000 g for 20 min, then at 100,000 g for 1 h at 4°C. Supernatants corresponding to the cytosolic fraction were assayed for cPLA2 activity, using a cPLA2 assay kit and secretory PLA2 and Ca2+-independent PLA2 inhibitors (Cayman, Ann Arbor MI).
Brain COX activity
Brain hemispheres (see above) were homogenized using a Teflon-glass homogenizer in 1 ml of ice-cold lysate buffer containing 10 mM Tris-HCl, pH 7.8, 1% Igepal CA-630, 0.15 M NaCl, and 1 mM EDTA. Homogenates were centrifuged at 14,000 g for 20 min at 4°C. Brain COX activity was measured as the rate of PGE2 formation (pg PGE2/min/mg cytosolic protein) in homogenate cytosolic fractions diluted 1:5 with lysate buffer in the presence of 10 mM phenol, 18.2 mM (−)-epinephrine, 4.6 mM L-glutathione reduced, and 10 μM porcine hematin. The reaction was started by adding AA (Oxford Biochemical Research, Oxford, MI) to a final concentration of 0.1 mM, and the mixture was incubated at 37°C for 15 min. The reaction was terminated by adding 250 μl of 1M HCl. PGE2 was extracted with ethyl acetate and quantified using a PGE2 immunoassay kit (Oxford Biochemical Research, Oxford, MI). A sample not containing AA was assayed and used for the blank determination.
In the same study, test drugs, Celebrex® (400 mg. Pfizer Inc, New York, NY, obtained from NIH Division of Veterinary Medicine, Bethesda, MD), a specific COX-2 inhibitor, and DOI were dissolved in dimethylsulfoxide at a concentration of 0.1% and in saline, respectively. These drugs were added to the mixture 10 min before adding AA (see above).
Brain PGE2, PGF2α and TXB2 concentrations
In separate experiments, mice were anesthetized with Nembutal® (50 mg/kg, i.p.) and subjected to head-focused microwave irradiation (5.5 kW, 0.9 s; Cober Electronics, Stamford, CT) to stop postmortem changes (Anton et al, 1983). Frozen half-brains were weighed, homogenized with 18 vol of hexane:isopropanol (3:2 by vol) using a glass Tenbroeck homogenizer and the homogenate was centrifuged for 5 min at 800 g. Tissue residues then were rinsed with 3 × 2 vol of the same solvent. The resultant lipid extract was concentrated to dryness under nitrogen and resuspended in enzyme immunoassay buffer provided with the polyclonal PGE2, PGF2α and TXB2 kits (Oxford Biochemical Research, Oxford, MI).
Head-twitch responses
Mice were administered PCPA (300 mg/kg i.p.) or vehicle twice daily for three days (Cesana et al, 1993). On the fourth day, 18 h after the final dose of PCPA, mice were placed in a Plexiglas container. Following 15 min of habituation, DOI (2.5 mg/kg i.p.) was administered. HTR were counted for five 1-min periods starting 5 min after drug administration, and were summed over these five periods. In a separate experiment, HTR following administration of 5-HTP (80 mg/kg i.p.) were assessed in a similar manner (Fox et al, 2007b).
Statistical analysis
A one-way analysis of variance (ANOVA) with a Bonferroni's post-test was used to compare mean body weights, cPLA2 and COX activities and eicosanoid concentrations using GraphPad Prism version 4.0b for Macintosh (GraphPad Software, San Diego CA, www.graphpad.com). A two-way ANOVA was employed to examine the effects of two factors, genotype (5-HTT −/− or 5-HTT +/− vs. 5-HTT +/+) and drug (DOI vs. saline) using SPSS 16.0 (SPSS Inc., Chicago, IL, http://www.spss.com) on the arterial input function, plasma unesterified fatty acid concentrations, k* and Jin. We report all main effect statistics (p and F values), although main effects in the context of a significant interaction may be difficult to interpret (Motulsky 2003; Tabachnick and Fidell 2001). A one-way ANOVA with Bonferroni's post-test with correction for 5 comparisons (5-HTT+/+ plus DOI vs. 5-HTT+/+ saline; 5-HTT+/− saline vs. 5-HTT+/+ saline, 5-HTT+/− plus DOI vs. 5-HTT+/− saline, 5-HTT−/− saline vs. 5-HTT+/+ saline, 5-HTT−/− plus DOI vs. 5-HTT−/− saline) was performed. For k* and Jin, corrections for multiple comparisons across regions were not made because the purpose of this exploratory study was to identify regions that were involved in individual drug effect.
One-way (genotype) or two-way (genotype × drug condition) ANOVAs followed by Bonferroni's post-tests were used to assess differences in 5-HTP- and DOI-induced HTR, respectively. Data are reported as means ± SD, with statistical significance taken as p ≤ 0.05.
Results
Body weight and arterial plasma input function
Mean body weight was significantly higher in 5-HTT−/− (p < 0.01) than 5-HTT+/+ mice (38.9 ± 5.7 g (n = 10) vs. 29.5 ± 5.4 g (n = 11)). Body weight equaled 34.2 ± 2.8 g (n = 10) in 5-HTT+/− mice.
A two-way ANOVA revealed a significant effect of DOI (p = 0.008) on integrated arterial plasma radioactivity (denominator of Eq. 1; plasma input function). Input functions [(nCi/ml x s) ± SD, n = 4-6] are: 5-HTT+/+ plus saline, 135,476 ± 21,938; 5-HTT+/+ plus DOI, 116,030 ± 19,123; 5-HTT+/− plus saline, 130,028 ± 10,446; 5-HTT+/− plus DOI, 106,044 ± 11,708; 5-HTT−/− plus saline, 113,179 ± 18,727 and 5-HTT−/− plus DOI, 105,875 ± 11,947.
Plasma concentrations of unlabelled unesterified fatty acids
A two-way ANOVA showed significant interactions between 5-HTT genotype and DOI for plasma concentrations of unesterified palmitoleic, stearic, oleic, and arachidonic acids (Table 1). Subsequent one-way ANOVAs with Bonferroni's post-tests showed that palmitoleic and oleic acid concentrations were higher in 5-HTT−/− and 5-HTT+/− mice than in 5-HTT+/+ mice by 57% and 34%, respectively, and that DOI compared to saline decreased palmitoleic acid in 5-HTT+/− and 5-HTT−/− mice by 52% and 38%, respectively. The mean unesterified plasma AA concentration did not differ significantly between groups. Where 5-HTT × DOI interactions were insignificant, the 5-HTT genotype had a main effect for palmitic, linoleic and α-linolenic acids, and DOI had a main effect for linoleic and α-linolenic acids.
Table 1.
Unesterified plasma fatty acid concentrations in 5-HTT+/+, 5-HTT+/− and 5-HTT−/− mice after s.c. saline or DOI administration
| 5-HTT+/+ | 5-HTT+/− | 5-HTT−/− | 5-HTT × DOI interaction | 5-HTT effect | DOI effect | ||||
|---|---|---|---|---|---|---|---|---|---|
| Fatty Acid | Saline (n = 5) |
DOI (n = 6) |
Saline (n = 5) |
DOI (n = 5) |
Saline (n = 5) |
DOI (n = 5) |
p-value | p-value | p-value |
| Palmitate (16:0) | 94.0 ± 26.5 | 118.0 ± 37.7 | 104.6 ± 26.9 | 77.3 ± 23.4 | 128.4 ± 21.5 | 128.7 ± 19.6 | 0.118 | 0.016 | 0.923 |
| Palmitoleate (16:1n-7) | 24.8 ± 3.1 | 22.9 ± 3.8 | 32.9 ± 12.2 | 15.8 ± 7.1** | 39.0 ± 6.3* | 24.3 ± 3.2** | 0.031 | ||
| Stearate (18:0) | 37.0 ± 11.9 | 45.5 ± 15.1 | 27.3 ± 5.5 | 33.5 ± 10.1 | 40.8 ± 5.0 | 28.2 ± 5.6 | 0.047 | ||
| Oleate (18:1n-9) | 108.6 ± 15.0 | 119.3 ± 16.7 | 106.0 ± 29.4 | 76.5 ± 11.9 | 145.8 ± 12.9** | 127.2 ± 7.7 | 0.032 | ||
| Linoleate (18:2n-6) | 124.1 ± 14.7 | 118.3 ± 15.9 | 111.4 ± 20.1 | 94.5 ± 28.1 | 165.0 ± 12.9 | 123.9 ± 15.9 | 0.106 | < 0.001 | 0.004 |
| α-Linolenate (18:3n-3) | 8.79 ± 1.34 | 7.27 ± 0.89 | 8.32 ± 2.43 | 6.08 ± 1.56 | 11.6 ± 1.2 | 10.4 ± 1.6 | 0.732 | < 0.001 | 0.007 |
| Arachidonate (20:4n-6) | 8.23 ± 2.15 | 10.2 ± 0.3 | 7.09 ± 1.04 | 5.94 ± 1.55 | 7.80 ± 1.54 | 7.15 ± 0.90 | 0.028 | ||
| Docosahexaenoate (22:6n-3) | 18.1 ± 5.9 | 18.2 ± 4.8 | 18.8 ± 6.6 | 18.6 ± 6.2 | 21.9 ± 7.0 | 22.1 ± 23.4 | 0.997 | 1.000 | 0.280 |
Concentrations are nmol/ml plasma. Values are mean ± SD.
Main effects not reported if statistically significant 5-HTT × DOI interaction. In cases of statistically insignificant 5-HTT × DOI interaction, Bonferroni's post-test was performed.
p < 0.05
p < 0.01
5-HTT+/+ plus DOI versus 5-HTT+/+ saline; 5-HTT+/− saline versus 5-HTT+/+ saline, 5-HTT+/− plus DOI versus 5-HTT+/− saline, 5-HTT−/− saline versus 5-HTT+/+ saline, 5-HTT−/− plus DOI versus 5-HTT−/− saline
Regional brain AA incorporation coefficients k*
Figure 1 illustrates color-coded coronal autoradiographs of k* for AA from brains of 5-HTT+/+, 5-HTT+/− and 5-HTT−/− mice injected with either saline (baseline) or DOI. 5-HTT+/− mice and to a greater extent 5-HTT−/− mice had higher baseline values of k* (Eq. 1) than the 5-HTT+/+ mice. Values of k* were elevated in 5-HTT+/+ mice injected with DOI compared with saline, but reduced in 5-HTT+/− and 5-HTT−/− mice injected with DOI compared with saline.
Figure 1.
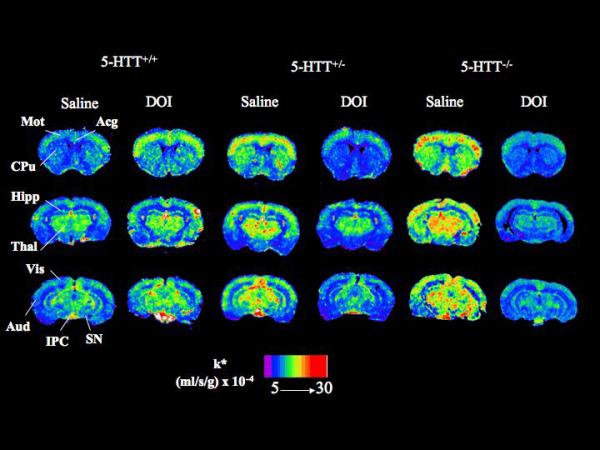
Coronal autoradiographs of brain showing effects of DOI and 5-HTT genotype on regional AA incorporation coefficients k* in mice. Values of k* (ml/s/g brain × 10−4) are given on a color scale from 5 (blue) to 30 (red). Abbreviations: Acg, anterior cingulate cortex; Aud, auditory cortex; CPu, caudate-putamen; Hipp, hippocampus; IPC, interpeduncular nucleus; Mot, motor cortex; SN, substantia nigra; Thal, thalamus; Vis, visual cortex.
Mean AA incorporation coefficients k* in each of 92 brain regions were compared among the different experimental groups and conditions using a two-way ANOVA. As illustrated in Table 2, 90 brain regions (but not the bed nucleus of the stria terminalis and the dorsal raphe nucleus, highlighted) had statistically significant genotype × drug interactions.
TABLE 2.
Arachidonic acid incorporation coefficients (k*) in 5-HTT+/+, 5-HTT+/− and 5-HTT−/− mice at baseline and in response to DOI
| 5-HTT+/+ | 5-HTT+/− | 5-HTT−/− | Genotype × Drug Interaction |
Genotype effect | Drug effect | |||||
|---|---|---|---|---|---|---|---|---|---|---|
| Brain region | Saline (n = 5) |
DOI (n = 6) |
Saline (n = 5) |
DOI (n = 5) |
Saline (n = 5) |
DOI (n = 5) |
p and (F) values | p and (F) values | p and (F) values | |
| Prefrontal cortex layer I | 6.47 ± 0.44 | 8.84 ± 1.59* | 7.90 ± 1.36 | 6.56 ± 1.14 | 9.41 ± 1.44** | 4.89 ± 0.77** | < 0.001 (21.2) | 0.598 (0.53) | 0014 (7.05) | |
| Prefrontal cortex layer IV | 8.29 ± 0.91 | 10.4 ± 1.5 | 10.4 ± 1.0 | 8.70 ± 1.40 | 10.6 ± 1.9* | 6.32 ± 0.71** | < 0.001 (16.2) | 0.162 (1.96) | 0.009 (8.06) | |
| Primary olfactory cortex | 7.34 ± 0.76 | 9.19 ± 1.28* | 9.25 ± 0.78* | 7.93 ± 0.59 | 8.92 ± 1.19 | 5.50 ± 0.62*** | < 0.001 (21.4) | 0.007 (6.05) | 0.008 (8.30) | |
| Frontal cortex (10) | ||||||||||
| Layer I | 7.27 ± 1.12 | 8.14 ± 0.51 | 8.44 ± 0.69 | 7.87 ± 1.06 | 9.80 ± 1.12* | 7.01 ± 1.19* | 0.034 (3.89) | 0.565 (0.58) | 0.137 (2.36) | |
| Layer IV | 9.16 ± 1.30 | 10.4 ± 1.2 | 12.1 ± 0.5* | 9.00 ± 0.83* | 11.8 ± 1.8* | 8.10 ± 1.09* | 0.001 (9.17) | 0.476 (0.76) | 0.002 (12.17) | |
| Frontal cortex (8) | ||||||||||
| Layer I | 7.37 ± 1.00 | 10.3 ± 1.9** | 9.48 ± 1.07 | 8.49 ± 0.42 | 10.3 ± 1.5** | 6.17 ± 0.95*** | < 0.001 (20.62) | 0.388 (0.98) | 0.111 (2.73) | |
| Layer IV | 9.67 ± 1.08 | 13.0 ± 1.9** | 11.8 ± 0.8 | 9.10 ± 0.58* | 13.7 ± 1.9** | 6.48 ± 0.78*** | < 0.001 (23.44) | 0.073 (2.91) | 0.004 (10.34) | |
| Pyriform cortex | 6.11 ± 0.61 | 8.12 ± 1.34* | 7.87 ± 0.86 | 6.91 ± 1.48 | 8.49 ± 1.22** | 3.98 ± 0.44*** | < 0.001 (23.95) | 0.061 (3.14) | 0.006 (8.85) | |
| Anterior cingulate cortex | 9.74 ± 1.00 | 12.3 ± 1.4** | 11.9 ± 0.9* | 10.1 ± 1.2 | 12.7 ± 1.4** | 7.37 ± 1.22*** | < 0.001 (29.10) | 0.124 (2.27) | 0.002 (12.57) | |
| Motor cortex | ||||||||||
| Layer I | 6.42 ± 1.10 | 8.09 ± 0.52 | 8.82 ± 1.57* | 7.76 ± 0.68 | 9.92 ± 2.69** | 7.06 ± 0.91* | 0.006 (6.28) | 0.133 (2.20) | 0.169 (2.00) | |
| Layer II -III | 6.80 ± 0.97 | 9.07 ± 0.71* | 9.67 ± 1.31** | 8.76 ± 1.00 | 10.4 ± 2.0*** | 6.94 ± 0.65*** | < 0.001 (15.77) | 0.059 (3.17) | 0.107 (2.79) | |
| Layer IV | 8.96 ± 1.22 | 12.1 ± 1.3*** | 11.8 ± 0.8** | 10.4 ± 1.3 | 13.0 ± 1.3*** | 7.89 ± 0.73*** | < 0.001 (33.37) | 0.356 (1.078) | 0.013 (7.09) | |
| Layer V | 7.04 ± 0.49 | 9.94 ± 1.17*** | 10.2 ± 1.5*** | 8.80 ± 0.99 | 9.82 ± 1.35** | 6.34 ± 0.75*** | < 0.001 (23.35) | 0.023 (4.42) | 0.113 (2.70) | |
| Layer VI | 6.58 ± 0.53 | 9.59 ± 1.08*** | 9.62 ± 1.14*** | 8.94 ± 1.07 | 9.80 ± 1.08*** | 6.19 ± 1.10*** | < 0.001 (32.08) | 0.008 (5.86) | 0.219 (1.59) | |
| Somatosensory cortex | ||||||||||
| Layer I | 6.99 ± 0.65 | 10.0 ± 0.8*** | 9.38 ± 0.74** | 8.53 ± 0.97 | 10.4 ± 1.2*** | 8.70 ± 1.21* | < 0.001 (18.88) | 0.064 (3.08) | 0.606 (0.274) | |
| Layer II - III | 8.13 ± 0.85 | 11.2 ± 0.7*** | 11.1± 1.1*** | 8.81 ± 0.80** | 10.9 ± 1.3*** | 8.07 ± 1.01*** | < 0.001 (28.65) | 0.567 (0.58) | 0.065 (3.71) | |
| Layer IV | 9.66 ± 0.89 | 13.1 ± 1.9** | 12.2 ± 1.1* | 10.9 ± 0.8 | 12.9 ± 1.8** | 9.86 ± 0.97** | < 0.001 (16.24) | 0.937 (0.07) | 0.549 (0.37) | |
| Layer V | 9.01 ± 1.09 | 12.1 ± 1.7** | 12.0 ± 1.2** | 10.6 ± 1.3 | 11.7 ± 1.7* | 7.92 ± 1.00*** | < 0.001 (16.90) | 0.082 (2.77) | 0.151 (2.19) | |
| Layer VI | 9.19 ± 1.08 | 11.4 ± 0.9* | 11.4 ± 1.0* | 9.92 ± 0.89 | 10.6 ± 1.7 | 8.65 ± 1.02 | < 0.001 (10.56) | 0.138 (2.14) | 0.303 (1.11) | |
| Auditory cortex | ||||||||||
| Layer I | 7.62 ± 1.43 | 9.84 ± 1.11* | 11.3 ± 0.8*** | 8.56 ± 1.15** | 11.2 ± 1.0*** | 6.84 ± 1.01*** | < 0.001 (25.55) | 0.052 (3.34) | < 0.001 (17.21) | |
| Layer IV | 9.23 ± 1.43 | 12.1 ± 1.3** | 12.1 ± 0.9** | 9.76 ± 0.67* | 11.9 ± 1.6** | 7.40 ± 0.34*** | < 0.001 (30.22) | 0.046 (3.48) | 0.003 (10.43) | |
| Layer VI | 8.09 ± 1.21 | 10.0 ± 0.8** | 10.9 ± 0.4*** | 9.07 ± 0.68** | 9.98 ± 1.1** | 6.38 ± 0.25*** | < 0.001 (33.00) | < 0.001 (12.95) | < 0.001 (16.79) | |
| Visual cortex | ||||||||||
| Layer I | 7.17 ± 1.22 | 9.42 ± 1.04* | 9.99 ± 1.71** | 8.26 ± 1.06 | 10.0 ± 0.7** | 6.47 ± 0.31*** | < 0.001 (19.21) | 0.148 (2.07) | 0.017 (6.51) | |
| Layer IV | 8.64 ± 0.65 | 12.3 ± 2.4*** | 11.5 ± 1.1** | 9.04 ± 0.72* | 10.2 ± 1.1 | 7.40 ± 0.34* | < 0.001 (20.78) | 0.015 (5.01) | 0.275 (1.25) | |
| Layer VI | 8.31 ± 0.86 | 10.9 ± 1.9* | 11.6 ± 0.9** | 8.31 ± 0.51** | 10.7 ± 1.8* | 7.03 ± 0.30*** | < 0.001 (20.01) | 0.174 (1.88) | 0.005 (9.69) | |
| Preoptic area (LPO/MPO) | 6.46 ± 0.50 | 7.60 ± 2.07 | 7.89 ± 0.46 | 6.44 ± 0.57 | 6.95 ± 0.71 | 4.58 ± 0.57** | 0.002 (7.87) | 0.011 (5.45) | 0.027 (5.55) | |
| Suprachiasmatic nu | 6.42 ± 0.81 | 8.93 ± 1.85* | 7.44 ± 1.09 | 6.20 ± 1.02 | 7.56 ± 1.45 | 4.12 ± 0.54*** | < 0.001 (15.59) | 0.009 (5.77) | 0.117 (2.63) | |
| Globus pallidus | 5.83 ± 0.65 | 6.33 ± 0.95 | 7.08 ± 0.59 | 6.27 ± 0.54 | 6.77 ± 0.87 | 4.13 ± 0.51*** | < 0.001 (12.80) | 0.003 (7.42) | 0.001 (14.68) | |
| Bed nu stria terminalis | 6.63 ± 0.86 | 7.22 ± 1.21 | 7.09 ± 0.70 | 6.49 ± 1.05 | 7.58 ± 0.45 | 6.50 ± 0.42 | 0.088 (2.68) | 0.801 (0.22) | 0.252 (1.38) | |
| Olfactory tubercle | 8.67 ± 1.06 | 9.91 ± 1.11 | 10.7 ± 0.8* | 8.29 ± 0.94** | 11.1 ± 1.4** | 6.54 ± 0.43*** | < 0.001 (22.5) | 0.352 (1.09) | < 0.001 (28.29) | |
| Diagonal band Dorsal | 7.97 ± 0.37 | 9.00 ± 2.3 | 8.81 ± 0.57 | 7.07 ± 1.09 | 10.9 ± 1.3** | 5.01 ± 0.58*** | < 0.001 (19.32) | 0.551 (0.61) | < 0.001 (22.93) | |
| Ventral | 8.09 ± 0.93 | 8.49 ± 1.83 | 8.59 ± 1.06 | 6.38 ± 1.30* | 11.5 ± 0.7** | 4.23 ± 0.68*** | < 0.001 (22.97) | 0.320 (1.19) | < 0.001 (50.10) | |
| Amygdala | 6.78 ± 0.28 | 7.57 ± 0.79 | 8.70 ± 0.96* | 6.68 ± 1.28* | 8.32 ± 1.1 | 5.38 ± 0.89*** | < 0.001 (11.27) | 0.152 (2.03) | < 0.001 (16.86) | |
| Hippocampus | ||||||||||
| CA1 | 5.91 ± 0.44 | 6.89 ± 0.62* | 8.23 ± 1.10** | 6.31 ± 0.37** | 7.17 ± 0.97 | 5.49 ± 0.27* | 0.001 (9.41) | 0.036 (3.82) | 0.009 (8.06) | |
| CA2 | 6.25 ± 0.39 | 7.27 ± 0.94 | 8.14 ± 0.42*** | 6.83 ± 0.38* | 7.72 ± 0.43* | 5.39 ± 1.06*** | < 0.001 (16.75) | 0.013 (5.18) | 0.002 (12.70) | |
| CA3 | 6.26 ± 0.70 | 7.57 ± 0.56 | 8.15 ± 0.53*** | 7.00 ± 0.70* | 8.29 ± 0.91** | 4.66 ± 0.50*** | < 0.001 (36.45) | 0.004 (7.00) | < 0.001 (23.38) | |
| Dentate gyrus | 7.01 ± 0.70 | 7.83 ± 0.85 | 8.84 ± 0.65** | 7.65 ± 0.64 | 8.71 ± 0.83** | 5.56 ± 0.62*** | < 0.001 (19.47) | 0.006 (6.29) | < 0.001 (20.09) | |
| SLM | 9.27 ± 1.12 | 11.0 ± 1.0 | 11.9 ± 1.2* | 9.74 ± 0.47 | 11.3 ± 1.1 | 7.96 ± 1.46** | 0.001 (9.97) | 0.171 (1.90) | 0.021 (6.12) | |
| Accumbens nu | 6.95 ± 0.69 | 7.72 ± 1.09 | 9.18 ± 0.62** | 7.89 ± 0.92 | 8.73 ± 0.79* | 5.84 ± 0.66*** | < 0.001 (13.07) | 0.003 (7.53) | 0.001 (14.57) | |
| Caudate putamen | ||||||||||
| Dorsal | 7.45 ± 0.91 | 8.66 ± 0.95 | 9.32 ± 1.49* | 7.55 ± 0.30* | 10.2 ± 0.8** | 5.07 ± 0.58*** | < 0.001 (31.28) | 0.161 (1.96) | < 0.001 (33.00) | |
| Ventral | 7.65 ± 0.32 | 9.39 ± 0.91** | 9.21 ± 0.74* | 7.53 ± 0.36* | 11.4 ± 1.4*** | 5.55 ± 0.64*** | < 0.001 (32.41) | 0.951 (0.05) | < 0.001 (24.79) | |
| Lateral | 7.34 ± 0.46 | 8.66 ± 0.75 | 9.67 ± 1.27* | 8.12 ± 0.73 | 11.8 ± 1.9*** | 5.76 ± 0.64*** | < 0.001 (25.09) | 0.192 (1.76) | < 0.001 (23.54) | |
| Medial | 7.28 ± 0.45 | 7.98 ± 0.94 | 9.26 ± 0.88* | 7.90 ± 0.52 | 10.9 ± 1.9*** | 5.24 ± 0.61*** | < 0.001 (26.61) | 0.124 (2.28) | < 0.001 (33.34) | |
| Septal nucleus lateral | 6.46 ± 0.74 | 6.30 ± 0.77 | 7.58 ± 0.74 | 6.19 ± 0.42* | 8.48 ± 0.67*** | 4.69 ± 0.61*** | < 0.001 (19.33) | 0.241 (1.51) | < 0.001 (54.26) | |
| Septal nucleus medial | 8.33 ± 1.01 | 9.22 ± 1.86 | 8.68 ± 0.62 | 7.26 ± 0.72 | 10.9 ± 1.1** | 4.86 ± 0.65*** | < 0.001 (25.32) | 0.146 (2.08) | < 0.001 (29.12) | |
| Diencephalon | ||||||||||
| Habenular nu lateral | 14.0 ± 1.6 | 16.5 ± 2.3 | 15.3 ± 1.7 | 13.8 ± 0.9 | 17.7 ± 2.0** | 9.03 ± 0.91*** | < 0.001 (29.60) | 0.050 (3.38) | < 0.001 (18.81) | |
| Habenular nu medial | 13.2 ± 2.3 | 16.8 ± 2.1 | 18.1 ± 4.8 | 13.7 ± 0.7 | 17.3 ± 1.7** | 8.41 ± 0.37*** | < 0.001 (17.49) | 0.032 (3.98) | 0.001 (13.54) | |
| Lateral geniculate nu | 10.7 ± 1.1 | 13.5 ± 1.0*** | 13.4 ± 1.1** | 10.5 ± 0.8*** | 14.6 ± 1.3*** | 8.13 ± 0.63*** | < 0.001 (55.61) | 0.247 (1.48) | < 0.001 (35.7) | |
| Medial geniculate nu. | 11.0 ± 1.3 | 14.4 ± 0.9*** | 14.4 ± 1.1*** | 11.5 ± 0.7** | 15.3 ± 0.9*** | 10.5 ± 1.8*** | < 0.001 (31.85) | 0.333 (1.15) | 0.017 (6.55) | |
| Thalamus | ||||||||||
| Ventroposterior lateral nu | 10.9 ± 0.9 | 12.7 ± 1.9 | 12.2 ± 1.00 | 9.32 ± 1.16* | 13.3 ± 1.0* | 7.31 ± 1.04*** | < 0.001 (24.22) | 0.034 (3.89) | < 0.001 ((27.53) | |
| Ventroposterior medial nu | 10.1 ± 1.5 | 12.6 ± 1.9 | 12.9 ± 1.5 | 9.62 ± 0.96* | 13.1 ± 1.4* | 7.79 ± 1.18*** | < 0.001 (20.57) | 0.303 (1.25) | 0.001 (14.76) | |
| Paratenial nu | 8.70 ± 1.38 | 10.5 ± 1.1 | 11.5 ± 1.3 | 9.21 ± 0.97 | 12.2 ± 1.9 | 6.73 ± 0.76** | < 0.001 (21.40) | 0.257 (1.44) | < 0.001 (19.40) | |
| Anteroventral nu | 12.8 ± 1.3 | 14.4 ± 1.5 | 16.8 ± 2.5* | 12.4 ± 0.7* | 17.7 ± 2.1* | 10.4 ± 0.5*** | 0.002 (8.28) | 0.786 (0.24) | 0.001 (14.30) | |
| Anteromedial nu | 9.51 ± 1.68 | 10.9 ± 1.1 | 13.2 ± 1.5** | 10.1 ± 1.1* | 13.4 ± 2.5** | 7.23 ± 1.08*** | < 0.001 (15.27) | 0.072 (2.93) | < 0.001 (21.79) | |
| Reticular nu | 9.98 ± 1.23 | 11.6 ± 1.9 | 10.7 ± 1.7 | 10.1 ± 0.7 | 12.7 ± 2.0* | 7.35 ± 0.89*** | < 0.001 (14.55) | 0.521 (0.67) | 0.014 (6.94) | |
| Paraventricular nu | 9.25 ± 1.39 | 10.6 ± 1.0 | 11.5 ± 1.3* | 9.62 ± 0.78 | 12.2 ± 1.9** | 6.73 ± 0.76*** | < 0.001 (19.97) | 0.167 (1.93) | < 0.001 (20.51) | |
| Parafascicular nu | 9.46 ± 1.33 | 11.3 ± 1.3 | 10.8 ± 0.8 | 10.1 ± 1.5 | 12.5 ± 2.7** | 6.17 ± 0.94*** | < 0.001 (19.25) | 0.194 (1.75) | 0.005 (9.66) | |
| Subthalamic nu | 10.4 ± 1.1 | 13.1 ± 1.0* | 12.6 ± 1.1 | 12.2 ± 1.2 | 14.5 ± 2.3*** | 12.4 ± 0.8 | 0.004 (7.06) | 0.044 (3.56) | 0.856 (0.034) | |
| Hypothalamus | ||||||||||
| Supraoptic nu | 7.04 ± 0.67 | 7.24 ± 0.87 | 8.89 ± 0.44** | 7.37 ± 0.46* | 7.75 ± 0.95 | 4.23 ± 0.68*** | < 0.001 (17.76) | < 0.001 (22.63) | < 0.001 (39.58) | |
| Lateral | 6.34 ± 0.21 | 7.23 ± 1.05 | 7.95 ± 0.99 | 6.37 ± 0.35 | 8.19 ± 1.88* | 4.30 ± 0.57*** | < 0.001 (14.64) | 0.145 (2.09) | < 0.001 (17.64) | |
| Anterior | 6.42 ± 0.39 | 7.44 ± 1.27 | 7.96 ± 0.87 | 6.29 ± 0.49 | 9.21 ± 2.28** | 4.83 ± 0.56*** | < 0.001 (13.73) | 0.930 (0.072) | 0.001 (15.62) | |
| Periventricular | 5.20 ± 0.36 | 6.48 ± 1.20 | 7.01 ± 0.65 | 5.05 ± 0.64* | 7.58 ± 1.90** | 4.01 ± 0.47*** | < 0.001 (15.25) | 0.863 (0.148) | 0.001 (14.75) | |
| Arcuate | 6.41 ± 0.90 | 7.77 ± 1.55 | 4.34 ± 1.03 | 6.15 ± 0.29 | 8.01 ± 1.34 | 4.88 ± 0.74*** | < 0.001 (11.41) | 0.406 (0.94) | 0.017 (6.48) | |
| Ventromedial | 6.64 ± 0.82 | 8.04 ± 1.45 | 7.84 ± 1.15 | 6.35 ± 0.28 | 7.98 ± 1.50 | 4.57 ± 0.69*** | < 0.001 (12.94) | 0.086 (2.71) | 0.006 (8.89) | |
| Posterior | 8.91 ± 1.88 | 11.7 ± 1.8 | 9.38 ± 0.56 | 8.07 ± 0.68 | 17.7 ± 3.3*** | 6.74 ± 1.02*** | < 0.001 (39.83) | 0.001 (9.66) | < 0.001 (24.29) | |
| Mammillary nu | 6.45 ± 0.82 | 8.41 ± 1.61 | 9.25 ± 0.78** | 8.15 ± 0.55** | 9.96 ± 1.71*** | 7.39 ± 1.09** | < 0.001 (14.37) | 0.063 (3.09) | 0.008 (8.22) | |
| Mesencephalon | ||||||||||
| Interpeduncular nu | 14.4 ± 2.6 | 23.1 ± 3.2*** | 19.5 ± 3.6 | 15.7 ± 1.1 | 23.6 ± 4.2*** | 13.7 ± 2.2*** | < 0.001 (25.93) | 0.658 (0.43) | 0.137 (2.37) | |
| Substantia nigra | 7.01 ± 0.98 | 9.75 ± 1.20** | 10.8 ± 1.0*** | 8.14 ± 1.06** | 9.68 ± 0.62** | 7.42 ± 1.47* | < 0.001 (20.06) | 0.074 (2.90) | 0.077 (3.39) | |
| Pretectal area | 9.49 ± 1.14 | 12.7 ± 2.5* | 12.1 ± 1.5 | 10.2 ± 1.4 | 13.0 ± 1.9* | 9.81 ± 1.36* | 0.001 (10.01) | 0.918 (0.09) | 0.344 (0.93) | |
| Grey layer Sup colliculus | 9.00 ± 1.56 | 10.5 ± 1.2 | 11.1 ± 0.7 | 9.52 ± 0.76 | 11.1 ± 1.8 | 7.37 ± 1.17*** | < 0.001 (11.10) | 0.181 (1.83) | 0.010 (7.72) | |
| Superior colliculus | 9.70 ± 1.16 | 13.0 ± 2.2* | 14.0 ± 2.5** | 9.68 ± 0.75** | 13.4 ± 1.9* | 8.09 ± 1.23*** | < 0.001 (19.16) | 0.380 (1.06) | 0.003 (11.12) | |
| Inferior colliculus | 14.7 ± 1.3 | 18.0 ± 0.9 | 18.5 ± 2.2 | 15.3 ± 1.7 | 20.5 ± 3.7** | 15.6 ± 2.1* | 0.001 (9.53) | 0.228 (1.57) | 0.063 (3.78) | |
| Median raphe nu | 7.70 ± 1.12 | 10.3 ± 0.9* | 11.3 ± 0.9*** | 11.0 ± 1.5 | 11.3 ± 0.9*** | 11.4 ± 1.5 | 0.016 (4.89) | < 0.001 (13.97) | 0.064 (3.25) | |
| Dorsal raphe nu | 8.56 ± 1.18 | 11.2 ± 1.5 | 10.9 ± 0.8 | 11.1 ± 1.1 | 11.4 ± 1.5 | 10.6 ± 0.9 | 0.173 ((1.89) | 0.585 (0.55) | 0.556 (0.36) | |
| Pedunculopontine tegmental nu | 7.88 ± 0.87 | 9.94 ± 1.48* | 9.56 ± 0.64 | 8.62 ± 0.84 | 9.56 ± 0.64** | 8.89 ± 0.362 | 0.002 (8.49) | 0.737 (0.31) | 0.655 (0.21) | |
| Rhombencephalon | ||||||||||
| Flocculus | 9.46 ± 1.02 | 10.8 ± 0.8 | 10.4 ± 1.1 | 10.3 ± 0.6 | 12.2 ± 1.3** | 8.98 ± 1.43*** | < 0.001 (12.24) | 0.585 (0.55) | 0.099 (2.94) | |
| Cerebellar gray matter | 7.93 ± 0.58 | 10.1 ± 1.2 | 11.4 ± 1.2** | 8.79 ± 0.94* | 12.5 ± 1.5*** | 7.95 ± 1.74*** | < 0.001 (19.67) | 0.062 (3.11) | 0.001 (13.82) | |
| Molecular layer cerebellar gray | 11.2 ± 1.2 | 15.9 ± 1.7** | 14.2 ± 1.8 | 13.0 ± 1.2 | 16.8 ± 2.4*** | 12.3 ± 2.4** | < 0.001 (16.33) | 0.407 (0.93) | 0.602 (0.28) | |
| Raphe magnus nu | 8.12 ± 0.84 | 11.3 ± 1.3* | 11.3 ± 2.1* | 10.5 ± 1.0 | 14.1 ± 2.8*** | 11.2 ± 2.0 | 0.003 (7.66) | 0.004 (6.97) | 0.794 (0.07) | |
| Raphe pallidus nu | 8.08 ± 1.7 | 11.5 ± 1.6* | 10.4 ± 1.0 | 8.96 ± 1.23 | 12.3 ± 3.7* | 8.1 ± 1.0* | 0.001 (10.26) | 0.813 (0.21) | 0.297 (1.13) | |
| Locus coeruleus | 9.09 ± 0.60 | 12.5 ± 1.9* | 11.7 ± 1.3 | 12.6 ± 1.9 | 14.6 ± 2.3*** | 13.8 ± 1.8 | 0.032 (3.98) | 0.001 (9.67) | 0.077 (3.39) | |
| Cochlear nu | 9.92 ± 1.52 | 11.9 ± 1.8 | 11.8 ± 0.5 | 11.7 ± 1.8 | 14.9 ± 1.0 | 12.9 ± 1.3 | 0.012 (5.26) | < 0.001 (12.28) | 0.945 (0.01) | |
| Spinal trigeminal nu, interpolar | 9.68 ± 1.22 | 12.6 ± 1.5 | 13.8 ± 2.1** | 9.53 ± 0.62** | 12.8 ± 1.8 | 9.45 ± 2.32* | < 0.001 (13.20) | 0.782 (0.25) | 0.011 (7.63) | |
| Superior olive | 7.12 ± 0.52 | 11.6 ± 3.1* | 11.9 ± 0.9* | 9.77 ± 1.31 | 11.3 ± 2.8* | 8.86 ± 2.9*** | < 0.001 (12.71) | < 0.001 (18.41) | < 0.001 (17.13) | |
| Medial vestibular nu | 9.84 ± 0.85 | 16.2 ± 3.2*** | 13.1 ± 2.1 | 10.5 ± 0.9 | 14.8 ± 2.6** | 7.60 ± 2.30*** | < 0.001 (25.62) | 0.165 (1.94) | 0.171 (1.98) | |
| White matter | ||||||||||
| Corpus callosum | 5.34 ± 0.60 | 6.06 ± 0.58 | 6.28 ± 0.77 | 5.25 ± 0.40 | 5.39 ± 0.26 | 3.85 ± 0.43*** | < 0.001 (13.01) | < 0.001 (14.52) | 0.004 (10.22) | |
| Zona incerta | 7.55 ± 0.63 | 9.04 ± 1.91 | 8.36 ± 1.07 | 7.84 ± 0.35 | 11.0 ± 1.9** | 7.95 ± 0.75*** | < 0.001 (23.01) | 0.829 (0.190) | 0.001 (12.97) | |
| Internal capsule | 5.09 ± 0.36 | 6.05 ± 1.08* | 5.83 ± 0.57 | 5.32 ± 0.48 | 6.11 ± 0.89* | 3.72 ± 0.88*** | < 0.001 (12.27) | 0.110 (2.42) | 0.028 (5.45) | |
| Cerebellar white matter | 5.66 ± 0.50 | 5.75 ± 0.64 | 5.95 ± 0.39 | 5.91 ± 0.33 | 7.45 ± 1.35** | 3.87 ± 0.65*** | < 0.001 (21.17) | 0.662 (0.42) | < 0.001 (20.41) | |
| Non-blood-brain barrier regions | ||||||||||
| Subfornical organ | 7.41 ± 1.16 | 10.7 ± 1.7* | 8.93 ± 0.81 | 8.59 ± 0.55 | 12.7 ± 3.5*** | 7.92 ± 0.89** | < 0.001 (14.10) | 0.131 (2.21) | 0.352 (0.90) | |
| Median eminence | 5.84 ± 0.78 | 8.17 ± 1.19* | 7.08 ± 0.87 | 5.09 ± 0.90* | 9.11 ± 1.47*** | 4.41 ± 0.70*** | < 0.001 (31.53) | 0.127 (2.25) | 0.001 (15.60) | |
| Choroid plexus (third ventricle) | 28.5 ± 3.2 | 31.0 ± 3.7 | 28.4 ± 6.4 | 29.3 ± 1.7 | 35.5 ± 9.5 | 24.1 ± 3.1** | 0.011 (5.47) | 0.893 (0.11) | 0.174 (1.96) | |
Abbreviations: nu, nucleus; SLM, stratum lacunosum-moleculae of hippocampus
k* = (ml/s/g) × 10−4, DOI: 1.5 mg/kg s.c. Each value is a mean ± S.D.
In cases of statistically significant genotype 5-HTT × drug interaction, Bonferroni' post-test were realized.
p < 0.05
p < 0.01
p < 0.001
5-HTT+/+ plus DOI vs 5-HTT+/+ saline; 5-HTT+/− saline vs 5-HTT+/+ saline, 5-HTT+/− plus DOI vs 5-HTT+/− saline, 5-HTT−/− saline vs 5-HTT+/+ saline, 5-HTT−/− plus DOI vs 5-HTT−/− saline
Effect of 5-HTT genotype on baseline values of k*
A one-way ANOVA with a Bonferroni's post-test showed that partial and total 5-HTT deletion significantly increased mean baseline values of k* for AA in 45 (by 20-67%) and 72 (by 21-71%) regions, respectively. Affected in both genotypes were cerebral cortex, olfactory tubercle, hippocampus, nucleus accumbens, caudate-putamen, geniculate nucleus, thalamus, mammillary nucleus, mesencephalon and rhombencephalon. In the 2 regions with statistically insignificant genotype × drug interactions, 5-HTT genotype did not have any main effect.
Effect of DOI in 5-HTT+/+ mice
DOI compared with saline significantly increased k* for AA (by 17-65%) in 42 of 92 regions of the 5-HTT+/+ mice(Table 2). Positively affected regions included cerebral cortex (21 of 25 regions, average 33%), suprachiasmatic nucleus (39%), hippocampus CA1 (17%), caudate-putamen ventral (23%), geniculate nucleus (29%), subthalamic nucleus (26%), mesencephalon (6 of 9 regions, average 38%), rhombencephalon (6 of 10 regions, average 51%), white matter (1 of 4 regions, 19%) and non-blood barrier regions (2 of 3, average 42%). In the 2 regions with insignificant genotype × drug interactions, DOI did not have any significant main effect.
Effect of DOI in 5-HTT+/− and 5-HTT−/− mice
DOI compared with saline did not significantly increase k* in any of the 42 regions where 5-HTT genotype × drug interactions were statistically significant (Table 2), but significantly reduced k* in 31 (−12 to −31%) and 83 (−16 to −63%) regions in 5-HTT+/− and 5-HTT−/− mice, respectively. In the 2 regions with statistically insignificant genotype × drug interactions, DOI did not have any main effect.
Patterns of significant differences in k*
Figure 2 presents difference patterns of k* responses to DOI in sagittal representations of the mouse brain. The 5-HTT+/− + DOI image compared with the 5-HTT+/+ + saline image illustrates the positive regional effects of DOI in the wild-type mice, whereas the 5-HTT+/− + saline image and the 5-HTT−/− + saline image compared with the 5-HTT+/+ + saline image illustrates the positive effects of a partial and complete deletion of 5-HTT, respectively, on baseline values of k*. The 5-HTT+/− + DOI and the 5-HTT−/− + DOI images compared with the 5-HTT+/− + saline and the 5-HTT−/− + DOI saline images show the negative effects of acute DOI on k* for AA, in mice with a partial and complete deletion of 5-HTT.
Figure 2.
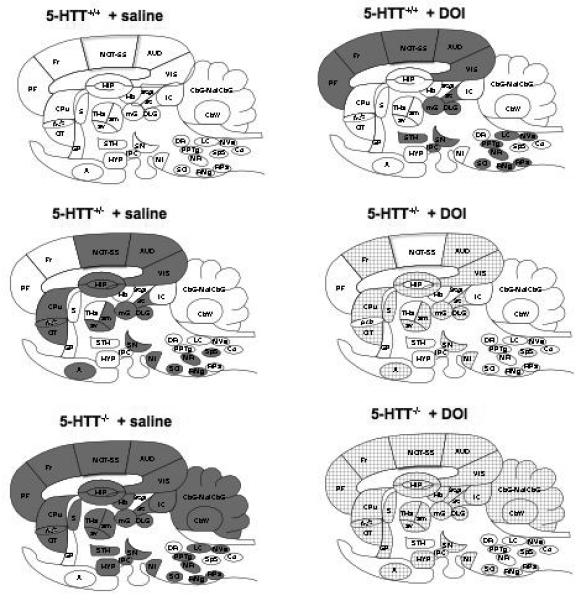
Difference patterns of k* responses to DOI in sagittal representation of 5-HTT mouse brain. Regions in which k* was increased significantly (p < 0.05) are solid grey, regions in which k* was decreased significantly are hatched. The 5-HTT+/− + DOI image is compared with the 5-HTT+/+ + saline image. The 5-HTT+/− + saline and the 5-HTT−/− + saline images are compared with the 5-HTT+/+ + saline image. The 5-HTT+/− + DOI and the 5-HTT−/− + DOI images are compared with the 5-HTT+/− + saline and the 5-HTT−/− + saline, respectively. List of regions: A, amygdala; Acb, nucleus accumbens; AUD, auditory cortex; am, anteromedial thalamic nucleus; av, anteroventral thalamic nucleus; CbG, cerebellar gray matter; CbW, cerebellar white matter; Co, cochlear nucleus; CPu, caudate putamen; DLG, dorsal lateral geniculate nucleus; DR, dorsal raphe; Fr, frontal cortex; GP, globus pallidus; Hb, habenular complex; HIP, hippocampus; HYP, hypothalamus; IC, inferior colliculus; IPC, interpeduncular nucleus; LC, locus coeruleus; MI, mammillary nucleus; mG, medial geniculate nucleus; MolCbG, molecular layer of cerebellar gray matter; MOT, motor cortex; MR, median raphe; MVe, medial vestibular nucleus; OT, olfactory tubercle; PF, prefrontal cortex; PPTg, pedunculopontine tegmental nucleus; SN, substantia nigra; S, septum; SO, superior olive; Sp5, spinal trigeminal nucleus; SS, somatosensory cortex; SC, superior colliculus; SCgl, gray layer of superior colliculus; STH, subthalamic nucleus; THa, thalamus; VIS, visual cortex.
Regional incorporation rates of unlabeled unesterified AA from plasma into brain
Baseline and DOI-induced rates of incorporation of unlabelled unesterified AA from plasma into brain phospholipids, Jin, were calculated by multiplying individual regional values of k* by the plasma concentration of unlabelled unesterified AA (Eq. 2) (data not shown). Each of the 92 regions showed a statistically significant 5-HTT genotype × drug interaction with regard to Jin. In 5-HTT+/+ mice, baseline Jin ranged from 4.19 fmol/s/g in the internal capsule (white matter) to 23.4 fmol/s/g in the choroid plexus. The partial and total 5-HTT deletion significantly increased Jin in 15 and 68 brain regions, respectively. DOI elevated Jin significantly in 71 out of 92 regions in the 5-HTT+/+ mice, whereas the drug significantly decreased Jin in 68 and 83 out of 92 regions in 5-HTT+/− and 5-HTT−/− mice, respectively.
Brain cPLA2 activity
An in vitro assay with calcium chelators showed that brain cPLA2 activity was increased by 29% (p < 0.001) and 34.5% (p < 0.001) in 5-HTT+/− and 5-HTT−/− mice, respectively, compared with 5-HTT+/+ mice (Table 3). Activity did not differ significantly between the 5-HTT+/− and 5-HTT−/− mice. We did not analyze brains following DOI because we could not reproduce the intracellular Ca2+ concentrations associated with DOI in vivo.
Table 3.
Effect of 5-HTT genotype on global brain cPLA2 and COX activities and eicosanoid concentrations
| 5-HTT+/+ | 5-HTT+/− | 5-HTT−/− | |
|---|---|---|---|
| cPLA2 activity (nmol/min/g protein) | |||
| (n = 6) | (n = 7) | (n = 5) | |
| 896.3 ± 83.7 | 1155 ± 95*** | 1207 ± 83*** | |
| COX activity (pg PGE2/min/mg protein) | |||
| (n = 6) | (n = 7) | (n = 5) | |
| 112.4 ± 13.9 | 57.1 ± 9.6*** | 29.0 ± 3.6***B | |
| Eicosanoid concentration | |||
| (n = 4) | (n = 4) | (n = 4) | |
| PGE2 (ng/g brain) | 23.6 ± 1.8 | 6.12 ± 1.18*** | 2.44 ± 0.75*** A |
| PGF2α (pg/g brain) | 63.5 ± 4.3 | 48.5 ± 3.6*** | 41.3 ± 3.1*** |
| TXB2 (pg/g brain) | 102.4 ± 24.3 | 67.4 ± 4.3*** | 28.4 ± 2.4*** A |
Values are means ± SD. Bonferroni's multiple comparison tests were performed:
p < 0.001
5-HTT−/− and 5-HTT+/− versus 5-HTT+/+
p < 0.01
p < 0.001 5-HTT−/− versus 5-HTT+/−
Brain COX activity
Brain COX activity was decreased by 49.2% (p < 0.001) and 74.2% (p < 0.001) in 5-HTT+/− and 5-HTT−/− mice, respectively, compared to 5-HTT+/+ mice (Table 3). COX activity was 49% less in 5-HTT−/− than in 5-HTT+/− mice. Preincubation of 5-HTT+/+ homogenate with 100 μM DOI did not significantly affect COX activity (102.9 ± 9.8 versus 112.4 ± 13.9 pg/min/mg protein), indicating that DOI did not inhibit COX enzymes. On the other hand, 100 μM Celebrex®, a selective COX-2 inhibitor used as a positive control, inhibited COX activity by 68% (35.5 ± 4.2 versus 112.4 ± 13.9 pg/min/mg protein, n = 5, p < 0.001).
Brain PGE2 PGF2α and TXB2 concentrations
As illustrated in Table 3, the basal brain PGE2 concentration was decreased significantly by 74% and 90% in 5-HTT+/− and 5-HTT−/− mice, respectively, compared with 5-HTT+/+ mice. Brain PGF2α was decreased significantly by 23% and 35% in 5-HTT+/− and 5-HTT−/− mice, respectively, and brain TXB2 was decreased significantly by 34% and 72% in 5-HTT+/− and 5-HTT−/− mice, respectively.
Head-twitch responses
After vehicle pretreatment, 5-HTT−/− mice had 86% fewer DOI-induced HTR than 5-HTT +/+ mice (p = 0.006), similar to a previous report (Qu et al, 2005); the number of responses did not differ significantly between 5-HTT +/− and 5-HTT+/+ mice, although 5-HTT+/− mice had an intermediate response (decreased 22% compared to 5-HTT+/+ mice) (Figure 3). PCPA pretreatment increased the number of HTR in 5-HTT−/− mice by 386% (p < 0.0001), with a trend toward an increase in 5-HTT +/− mice (p = 0.08), but had no significant effect in 5-HTT +/+ mice. After PCPA pretreatment, DOI-induced HTR did not differ significantly among the three genotypes. These findings suggest that 5-HT depletion “normalized” DOI-induced HTR in 5-HTT −/− mice (main effect of genotype (F(2,57) = 6.33, p = 0.003), main effect of pretreatment drug [F(1,57) = 3.22, p = 0.078], genotype × pretreatment drug interaction [F(2,57) = 3.13, p = 0.05].
Figure 3.

Effects of brain 5-HT depletion by PCPA pretreatment on DOI-induced head twitches in 5-HTT mice. At baseline (vehicle pretreatment), DOI induced fewer head twitches in 5-HTT−/− mice compared to 5-HTT+/+ mice, whereas DOI-induced head twitches were similar between 5-HTT+/+ and 5-HTT+/− mice. Pretreatment with PCPA, which depletes 5-HT levels, increased DOI-induced head twitches in 5-HTT−/− mice, with a trend toward a significant increase in 5-HTT+/− mice (p = 0.08), compared to their vehicle-pretreated counterparts. Data represent the means ± SEM, n = 7-13 per group. ** p < 0.01 compared to 5-HTT+/+ mice in the same pretreatment condition; ++++p < 0.0001 compared to vehicle-pretreated mice of the same 5-HTT genotype.
Administration of the 5-HT precursor 5-HTP is reported to increase 5-HT syndrome behaviors (Fox et al, 2008a; Fox et al, 2007b) and brain 5-HT concentrations 2-5 fold in 5-HTT+/+ and 5-HTT+/− mice and 4.5-12 fold in 5-HTT−/− mice (Fox et al, 2008a). 5-HTT−/− mice given 5-HTP displayed ∼48% fewer HTR than did 5-HTT+/+ mice (p = 0.037), whereas there was no difference between 5-HTT+/+ and 5-HTT+/− mice given 5-HTP (Figure 4) (main effect of genotype [F(2,36) = 4.24, p = 0.022].
Figure 4.

5-HTP-induced head twitches in 5-HTT mice. The 5-HT precursor 5-HTP, which increases 5-HT levels, induced fewer head twitches in 5-HTT−/− mice compared to 5-HTT+/+ mice, with no difference between 5-HTT+/− and 5-HTT+/+ mice. Data represent the means ± SEM; n = 9-16 per group. * p < 0.05 compared to 5-HTT+/+ mice.
Discussion
Baseline AA incorporation coefficients k* were increased significantly in 5-HTT−/− mice in 72 regions of 92 regions by 21-71%, and in 5-HTT+/− mice in 45 regions by 20-67%, compared with 5-HTT+/+ mice. Comparable increases were found for Jin as well. The increases were accompanied by elevated brain cPLA2 activity (29% and 35% in 5-HTT+/− and 5-HTT−/− mice, respectively), decreased COX activity (−49% and −74%, respectively) and decreased concentrations of the COX-derived AA metabolites, PGE2 (−74% and −90%, respectively), PGF2α (−24% and −35%, respectively) and TXB2 (−34% and −72%, respectively). The partial 5-HT2A/2C agonist DOI increased k* in 42 regions in wild-type mice, but decreased k* in 31 and 83 regions, respectively, in the 5-HTT+/− and 5-HTT−/− mice. DOI-induced HTR were reduced in 5-HTT−/− mice, but this decreased response was “normalized to 5-HTT+/+ levels after 5-HT depletion by pretreatment with PCPA.
Together, these studies suggest that elevated extracellular 5-HT levels in 5-HTT deficient mice, by increasing 5-HT occupancy of PLA2-coupled postsynaptic 5-HT2A/2C receptors, likely tonically activate cPLA2 and increase AA release from membrane phospholipid, thereby increasing baseline values of k* and Jin for AA. Tonic activation of cPLA2-coupled neuroreceptors also has been reported to increase cPLA2 expression (mRNA and activity) in rats treated chronically with a subconvulsive dose of N-methyl-D-aspartic acid (NMDA) to stimulate NMDA receptors (Lee et al, 2008; Rao et al, 2007), or with fluoxetine, a 5-HTT inhibitor, to stimulate 5-HT2A/2C receptors via elevated extracellular 5-HT (Lee et al, 2007; Qu et al, 2006; Stenfors and Ross 2002). In these and the present case, excess neuroreceptor-induced AA release may have activated protein kinase C and nuclear transcription factor-κB, to transcriptionally upregulate cPLA2 expression by a feedback mechanism (Toborek et al, 1999; Xu et al, 2002).
Although the increased Jin for AA in the deficient mice represented increased AA loss by brain metabolism (Demar et al, 2005; Holman 1986; Rapoport et al, 2001), the reduced brain COX activity and PGE2, PGF2α and TXB2 concentrations indicate that AA loss was not via COX-mediated pathways, but by other pathways such as β-oxidation, formation of endocannabinoids, or oxidation by cytochrome P450 epoxygenase or lipoxygenase (Fitzpatrick and Soberman 2001; Shimizu and Wolfe 1990). While a limitation of this study is that we do not know the exact pathways of increased loss, these might be determined in the future by measuring brain COX-2, COX-1, 5-lipoxygenase and cytochrome P450 epoxygenase activities and their metabolic products in the 5-HTT-deficient mice, in relation to altered behavior (Fox et al, 2007a; Murphy and Lesch 2008). In this regard, endocannabinoids derivatives such as anandamide can induce anxiety-like behaviors in rodents (Rubino et al, 2008; Rutkowska et al, 2006). We do not have a ready explanation for the reductions in COX activity and in eicosanoid concentrations, in the face of increased cPLA2 activity, but such “uncoupling” of the enzymes also was noted in COX-2 knockout mice (Bosetti et al, 2004; Zhang et al, 2002). cPLA2 and COX-2 normally are functionally coupled and co-localized on postsynaptic membranes in rodent brain (Bosetti and Weerasinghe 2003; Fitzpatrick and Soberman 2001; Kaufmann et al, 1996; Ong et al, 1999; Pardue et al, 2003; Sapirstein et al, 2005; Xu et al, 2008).
The decreased k* and Jin responses to DOI in the 5-HTT deficient mice are not due to reductions in 5-HT2A/2C receptor density or their availability due to internalization, as binding studies indicate that 5-HT2A receptor density is reduced only in the striatum but is increased in the hypothalamus and septum of the mice, whereas 5-HT2C receptor density is elevated in the amygdala and choroid plexus (Li et al, 2003). The hypothalamus, septum and amygdala belong to the limbic system, which is involved in emotional regulation. Altered 5-HT2A/2C receptors and their signaling may contribute to some of the behavioral changes observed in these mice, such as increased anxiety-like behaviors and reduced aggressiveness on various tests (Fox et al, 2007a; Murphy et al, 2008; Murphy and Lesch 2008).
One possibility for the decreased k* and Jin responses to DOI is that, as a partial agonist, DOI displaced bound 5-HT from cPLA2-coupled 5-HT2A/2C receptors, and produced less activation compared with 5-HT (Marek and Aghajanian 1996). Such displacement also can explain the decreased DOI-induced HTR in 5-HTT−/− mice, replicating an earlier report (Qu et al, 2005)), since PCPA pretreatment, sufficient to deplete extracellular 5-HT by 67-94% in wild-type or 5-HTT−/− mice (Cesana et al, 1993; Fox et al, 2008b), returned the DOI-induced HTR in 5-HTT−/− mice to wild-type levels. Consistent with this interpretation, 5-HTT overexpressing mice have lower levels of extracellular 5-HT and higher DOI-induced HTR than do wild-type mice (Jennings et al, 2008). Postnatal PCPA administration is reported to prevent some aspects of the adult 5-HTT−/− behavioral phenotype (Alexandre et al, 2006) and it would be worthwhile to see if it also prevented some of the differences in the AA signal (Fox et al, 2007a).
The serotonin precursor 5-HTP, which increases 5-HT levels in 5-HTT-deficient mice (Fox et al, 2008a), induces HTR in mice. In the current study, 5-HTP induced fewer HTR in 5-HTT−/− versus 5-HTT+/+ mice, indicating that excessive baseline levels of synaptic 5-HT increases HTR. Brain extracellular concentrations of dopamine, glutamate and acetylcholine are unchanged in 5-HTT-deficient mice and rats (Homberg et al, 2007; Mathews et al, 2004), and likely did not contribute to the elevations in k* and Jin for AA in the 5-HTT deficient mice.
In the 5-HTT+/+ mice, statistically significant elevations in k* for AA in response to DOI occurred in the neocortex, mesencephalon and rhombencephalon, which have high 5-HT2A receptor densities. The olfactory tubercle, hypothalamus, amygdala, hippocampus and choroid plexus, which contain mainly 5-HT2C receptors (Li et al, 2003), were not activated significantly, suggesting that the k* responses to DOI were mediated mainly by 5-HT2A receptors. However, stimulation of 5-HT2A or 5-HT2C receptors by different agonists can activate cPLA2 to release AA (Berg et al, 1998b). Selective 5-HT2A and 5-HT2C antagonists could be used to distinguish the roles of the two receptor subtypes.
Dorsal raphe neurons of 5-HTT−/− and 5-HTT+/− mice exhibit decreased firing rates (Murphy and Lesch 2008), and 5-HTT−/− mice have widespread reductions in brain glucose metabolism, a measure of energy consumption (Esaki et al, 2005; Sokoloff 1999), despite their elevated values of k* and Jin. The obesity of the 5-HTT−/− mice is consistent with published data and is associated with increased plasma levels of insulin, leptin, cholesterol and triglycerides (Murphy and Lesch 2008). Their high plasma unesterified fatty acid concentrations may be related to adrenocorticotropic hormone and corticosterone elevations and to anxiety-related behaviors (Gottschalk et al, 1969; John et al, 1987; Murphy and Lesch 2008).
The baseline values of k* for AA in the 5-HTT+/+ mice agree with published values (Basselin et al, 2006b; Qu et al, 2005). An earlier paper reported that baseline values did not differ significantly between 5-HTT−/− and 5-HTT+/+ mice, unlike the current findings. However, the previous report is likely erroneous. Frozen brain sections in the previous work were exposed to X-ray film for 6-10 weeks, rather than for 4 weeks as was done in the present paper, which resulted in saturation at high optical densities, with loss of linearity and discrimination (Basselin M, unpublished observations).
The 5-HTT+/− mouse is considered a model for humans who carry the “S” compared with “L” allele of the 5-HTTLPR, or who express rs25531 or rs25532 variants of the 5-HTT allele with regard to levels of 5-HTT expression and function (Murphy et al, 2008; Murphy and Lesch 2008). Individuals with these lesser-expressing 5-HTT polymorphisms are at risk for multiple psychiatric disorders, including bipolar disorder (Masoliver et al, 2006; Murphy et al, 2008; Murphy and Lesch 2008). In this regard, elevated brain AA metabolism has been suggested to contribute to and be a risk factor for bipolar disorder (Basselin et al, 2006a; Basselin et al, 2007b; Rao et al, 2008; Rapoport and Bosetti 2002).
The new data in this paper suggest that baseline k* and Jin for AA would be elevated in individuals with the “S” 5-HTTLPR allele. This prediction might be tested with the use of positron emission tomography (PET) in human subjects in the resting state, following the intravenous injection of [1-11C]AA. In such PET studies, the coefficient of variation of k* for AA ranges from 12-16% (Esposito et al, 2008; Giovacchini et al, 2004). A power analysis (http://statpages.org/#Power) shows that statistically significant (α = 5, statistical power = 0.8) resting-state differences of 20% (the lower range of significant elevations in the 5-HTT deficient mice) thus could be demonstrated with 8 subjects each belonging to long and short 5-HTTLPR groups. To date, PET studies assessing acute drug responses of the AA signal have not been performed in humans, but in any case, if DOI were given it would be expected to produce untoward hallucinogenic effects (Marek and Aghajanian 1996).
The present findings extend our knowledge of altered neurotransmission involving 5-HT, which is thought to contribute to depression and anxiety disorders. The data demonstrated that reduced or absent 5-HTT function in mice results in an upregulation of baseline AA signaling involving 5-HT. Given the parallels between phenotypic abnormalities in 5-HTT-deficient mice and in human mood and anxiety disorders, these data provide a model for humans with 5-HTT polymorphisms and mutations that affect 5-HTT expression and function.
Acknowledgments
We thank Alison Stein and Helen French for assisting in the behavioral tests and Dr. Angelo O. Rosa for his helpful comments on this paper.
Abbreviations
- AA
arachidonic acid
- COX
cyclooxygenase
- PLA2
phospholipase A2
- cPLA2
cytosolic PLA2
- PET
positron emission tomography
- PGE2
prostaglandin E2
- PGF2α
prostaglandin F2α
- 5-HT
serotonin
- 5-HTP
5-hydroxy-L-tryptophan
- 5-HTT
serotonin reuptake transporter
- HTR
head-twitch responses
- PCPA
para-chlorophenylalanine
- PET
positron emission tomography
- TXB2
thromboxane B2
- DOI
(±)-1-(2,5-dimethoxy-4-iodophenyl)-2-aminopropane hydrochloride
- SSRI
selective serotonin reuptake inhibitor
Footnotes
Disclosure/Conflict of Interest
The authors have no conflicts of interest. This work was supported by the Intramural Research Programs of the National Institute on Aging and the National Institute of Mental Health, of the National Institutes of Health.
References
- Alexandre C, Popa D, Fabre V, Bouali S, Venault P, Lesch KP, Hamon M, Adrien J. Early life blockade of 5-hydroxytryptamine 1A receptors normalizes sleep and depression-like behavior in adult knock-out mice lacking the serotonin transporter. J Neurosci. 2006;26:5554–64. doi: 10.1523/JNEUROSCI.5156-05.2006. [DOI] [PMC free article] [PubMed] [Google Scholar]
- Anton RF, Wallis C, Randall CL. In vivo regional levels of PGE and thromboxane in mouse brain: effect of decapitation, focused microwave fixation, and indomethacin. Prostaglandins. 1983;26:421–9. doi: 10.1016/0090-6980(83)90177-6. [DOI] [PubMed] [Google Scholar]
- Baca-Garcia E, Vaquero-Lorenzo C, Diaz-Hernandez M, Rodriguez-Salgado B, Dolengevich-Segal H, Arrojo-Romero M, Botillo-Martin C, Ceverino A, Piqueras JF, Perez-Rodriguez MM, Saiz-Ruiz J. Association between obsessive-compulsive disorder and a variable number of tandem repeats polymorphism in intron 2 of the serotonin transporter gene. Prog Neuropsychopharmacol Biol Psychiatry. 2007;31:416–20. doi: 10.1016/j.pnpbp.2006.10.016. [DOI] [PubMed] [Google Scholar]
- Basselin M, Chang L, Bell JM, Rapoport SI. Chronic lithium chloride administration attenuates brain NMDA receptor-initiated signaling via arachidonic acid in unanesthetized rats. Neuropsychopharmacology. 2006a;31:1659–1674. doi: 10.1038/sj.npp.1300920. [DOI] [PubMed] [Google Scholar]
- Basselin M, Murphy DL, Rapoport SI. Increased brain arachidonic acid signaling can be imaged in vivo in serotonin transporter deficient mice: Basis for future clinical PET studies; Abstr. Annual Meeting American College Neuropsychopharmacology; Boca Ratan, FL. December, 9-13; 2007a. Poster session III, number 123. [Google Scholar]
- Basselin M, Villacreses NE, Chen M, Bell JM, Rapoport SI. Chronic carbamazepine administration reduces NMDA receptor-initiated signaling via arachidonic acid in rat brain. Biol Psychiatry. 2007b;62:934–43. doi: 10.1016/j.biopsych.2007.04.021. [DOI] [PMC free article] [PubMed] [Google Scholar]
- Basselin M, Villacreses NE, Langenbach R, Ma K, Bell JM, Rapoport SI. Resting and arecoline-stimulated brain metabolism and signaling involving arachidonic acid are altered in the cyclooxygenase-2 knockout mouse. J Neurochem. 2006b;96:669–79. doi: 10.1111/j.1471-4159.2005.03612.x. [DOI] [PubMed] [Google Scholar]
- Bengel D, Murphy DL, Andrews AM, Wichems CH, Feltner D, Heils A, Mossner R, Westphal H, Lesch KP. Altered brain serotonin homeostasis and locomotor insensitivity to 3, 4-methylenedioxymethamphetamine (“Ecstasy”) in serotonin transporter-deficient mice. Mol Pharmacol. 1998;53:649–55. doi: 10.1124/mol.53.4.649. [DOI] [PubMed] [Google Scholar]
- Berg KA, Maayani S, Goldfarb J, Clarke WP. Pleiotropic behavior of 5-HT2A and 5-HT2C receptor agonists. Ann N Y Acad Sci. 1998a;861:104–10. doi: 10.1111/j.1749-6632.1998.tb10180.x. [DOI] [PubMed] [Google Scholar]
- Berg KA, Maayani S, Goldfarb J, Scaramellini C, Leff P, Clarke WP. Effector pathway-dependent relative efficacy at serotonin type 2A and 2C receptors: evidence for agonist-directed trafficking of receptor stimulus. Mol Pharmacol. 1998b;54:94–104. [PubMed] [Google Scholar]
- Bosetti F. Arachidonic acid metabolism in brain physiology and pathology: lessons from genetically altered mouse models. J Neurochem. 2007;102:577–86. doi: 10.1111/j.1471-4159.2007.04558.x. [DOI] [PMC free article] [PubMed] [Google Scholar]
- Bosetti F, Langenbach R, Weerasinghe GR. Prostaglandin E2 and microsomal prostaglandin E synthase-2 expression are decreased in the cyclooxygenase-2-deficient mouse brain despite compensatory induction of cyclooxygenase-1 and Ca2+-dependent phospholipase A2. J Neurochem. 2004;91:1389–97. doi: 10.1111/j.1471-4159.2004.02829.x. [DOI] [PubMed] [Google Scholar]
- Bosetti F, Weerasinghe GR. The expression of brain cyclooxygenase-2 is down-regulated in the cytosolic phospholipase A2 knockout mouse. J Neurochem. 2003;87:1471–7. doi: 10.1046/j.1471-4159.2003.02118.x. [DOI] [PubMed] [Google Scholar]
- Caspi A, Sugden K, Moffitt TE, Taylor A, Craig IW, Harrington H, McClay J, Mill J, Martin J, Braithwaite A, Poulton R. Influence of life stress on depression: moderation by a polymorphism in the 5-HTT gene. Science. 2003;301:386–9. doi: 10.1126/science.1083968. [DOI] [PubMed] [Google Scholar]
- Cesana R, Ceci A, Ciprandi C, Borsini F. Mesulergine antagonism towards the fluoxetine anti-immobility effect in the forced swimming test in mice. J Pharm Pharmacol. 1993;45:473–5. doi: 10.1111/j.2042-7158.1993.tb05578.x. [DOI] [PubMed] [Google Scholar]
- Chang MC, Arai T, Freed LM, Wakabayashi S, Channing MA, Dunn BB, Der MG, Bell JM, Sasaki T, Herscovitch P, Eckelman WC, Rapoport SI. Brain incorporation of [1-11C]-arachidonate in normocapnic and hypercapnic monkeys, measured with positron emission tomography. Brain Res. 1997;755:74–83. doi: 10.1016/s0006-8993(97)00088-7. [DOI] [PubMed] [Google Scholar]
- Clark JD, Schievella AR, Nalefski EA, Lin LL. Cytosolic phospholipase A2. J Lipid Mediat Cell Signal. 1995;12:83–117. doi: 10.1016/0929-7855(95)00012-f. [DOI] [PubMed] [Google Scholar]
- Demar JC, Jr., Ma K, Chang L, Bell JM, Rapoport SI. alpha-Linolenic acid does not contribute appreciably to docosahexaenoic acid within brain phospholipids of adult rats fed a diet enriched in docosahexaenoic acid. J Neurochem. 2005;94:1063–1076. doi: 10.1111/j.1471-4159.2005.03258.x. [DOI] [PubMed] [Google Scholar]
- Demar JC, Jr., Lee HJ, Ma K, Chang L, Bell JM, Rapoport SI, Bazinet RP. Brain elongation of linoleic acid is a negligible source of the arachidonate in brain phospholipids of adult rats. Biochim Biophys Acta. 2006;1761:1050–1059. doi: 10.1016/j.bbalip.2006.06.006. [DOI] [PubMed] [Google Scholar]
- Esaki T, Cook M, Shimoji K, Murphy DL, Sokoloff L, Holmes A. Developmental disruption of serotonin transporter function impairs cerebral responses to whisker stimulation in mice. Proc Natl Acad Sci U S A. 2005;102:5582–7. doi: 10.1073/pnas.0501509102. [DOI] [PMC free article] [PubMed] [Google Scholar]
- Esposito G, Giovacchini G, Liow J-S, Bhattacharjee AK, Greenstein D, Schapiro M, Hallett M, Hersovitch P, Eckelman WC, Carson RE, Rapoport SI. Imaging neuroinflammation in Alzheimer disease with radiolabeled arachidonic acid and PET. J Nucl Med. 2008;49:1414–21. doi: 10.2967/jnumed.107.049619. [DOI] [PMC free article] [PubMed] [Google Scholar]
- Felder CC, Kanterman RY, Ma AL, Axelrod J. Serotonin stimulates phospholipase A2 and the release of arachidonic acid in hippocampal neurons by a type 2 serotonin receptor that is independent of inositolphospholipid hydrolysis. Proc. Natl. Acad. Sci. USA. 1990;87:2187–2191. doi: 10.1073/pnas.87.6.2187. [DOI] [PMC free article] [PubMed] [Google Scholar]
- Fitzpatrick F, Soberman R. Regulated formation of eicosanoids. J Clin Invest. 2001;107:1347–1351. doi: 10.1172/JCI13241. [DOI] [PMC free article] [PubMed] [Google Scholar]
- Folch J, Lees M, Sloane Stanley GH. A simple method for the isolation and purification of total lipides from animal tissues. J. Biol. Chem. 1957;226:497–509. [PubMed] [Google Scholar]
- Fox MA, Andrews AM, Wendland JR, Lesch K-P, Holmes A, Murphy DL. A pharmacological analysis of mice with a targeted disruption of the serotonin transporter. Psychopharmacology (Berl) 2007a;195:147–166. doi: 10.1007/s00213-007-0910-0. [DOI] [PubMed] [Google Scholar]
- Fox MA, Jensen CL, French HT, Stein AR, Huang SJ, Tolliver TJ, Murphy DL. Neurochemical, behavioral, and physiological effects of pharmacologically enhanced serotonin levels in serotonin transporter (SERT)-deficient mice. Psychopharmacology. 2008a;201:203–218. doi: 10.1007/s00213-008-1268-7. [DOI] [PMC free article] [PubMed] [Google Scholar]
- Fox MA, Jensen CL, Gallagher PS, Murphy DL. Receptor mediation of exaggerated responses to serotonin-enhancing drugs in serotonin transporter (SERT)-deficient mice. Neuropharmacology. 2007b;53:643–56. doi: 10.1016/j.neuropharm.2007.07.009. [DOI] [PubMed] [Google Scholar]
- Fox MA, Stein AS, French HT, Murphy DL. Head twitches in serotonin transporter (SERT)-deficient mice: 5-HT1A and 5-HT2A receptor interactions. Fundam Clin Pharmacol. 2008b;22:S91. [Google Scholar]
- Franklin KBJ, Paxinos G. The mouse brain in stereotaxic coodinates. Academic Press, Inc; San Diego: 1997. [Google Scholar]
- Giovacchini G, Lerner A, Toczek MT, Fraser C, Ma K, DeMar JC, Herscovitch P, Eckelman WC, Rapoport SI, Carson RE. Brain incorporation of [11C]arachidonic acid, blood volume, and blood flow in healthy aging: a study with partial-volume correction. J Nucl Med. 2004;45:1471–9. [PubMed] [Google Scholar]
- Gottschalk LA, Stone WM, Gleser GC, Iacono JM. Anxiety and plasma free fatty acids (FFA) Life Sci. 1969;8:61–8. doi: 10.1016/0024-3205(69)90118-0. [DOI] [PubMed] [Google Scholar]
- Holman RT. Control of polyunsaturated acids in tissue lipids. J Am Coll Nutr. 1986;5:183–211. doi: 10.1080/07315724.1986.10720125. [DOI] [PubMed] [Google Scholar]
- Homberg JR, Olivier JD, Smits BM, Mul JD, Mudde J, Verheul M, Nieuwenhuizen OF, Cools AR, Ronken E, Cremers T, Schoffelmeer AN, Ellenbroek BA, Cuppen E. Characterization of the serotonin transporter knockout rat: A selective change in the functioning of the serotonergic system. Neuroscience. 2007;146:1662–1676. doi: 10.1016/j.neuroscience.2007.03.030. [DOI] [PubMed] [Google Scholar]
- Hu XZ, Lipsky RH, Zhu G, Akhtar LA, Taubman J, Greenberg BD, Xu K, Arnold PD, Richter MA, Kennedy JL, Murphy DL, Goldman D. Serotonin transporter promoter gain-of-function genotypes are linked to obsessive-compulsive disorder. Am J Hum Genet. 2006;78:815–26. doi: 10.1086/503850. [DOI] [PMC free article] [PubMed] [Google Scholar]
- Jennings KA, Sheward WJ, Harmar AJ, Sharp T. Evidence that genetic variation in 5-HT transporter expression is linked to changes in 5-HT2A receptor function. Neuropharmacology. 2008;54:776–83. doi: 10.1016/j.neuropharm.2007.12.001. [DOI] [PubMed] [Google Scholar]
- John TM, Viswanathan M, Etches RJ, Pilo B, George JC. Influence of corticosterone infusion on plasma levels of catecholamines, thyroid hormones, and certain metabolites in laying hens. Poult Sci. 1987;66:1059–63. doi: 10.3382/ps.0661059. [DOI] [PubMed] [Google Scholar]
- Kaufmann WE, Worley PF, Pegg J, Bremer M, Isakson P. COX-2, a synaptically induced enzyme, is expressed by excitatory neurons at postsynaptic sites in rat cerebral cortex. Proc Natl Acad Sci U S A. 1996;93:2317–21. doi: 10.1073/pnas.93.6.2317. [DOI] [PMC free article] [PubMed] [Google Scholar]
- Lee HJ, Rao JS, Chang L, Rapoport SI, Bazinet RP. Chronic N-methyl-D-aspartate administration increases the turnover of arachidonic acid within brain phospholipids of the unanesthetized rat. J Lipid Res. 2008;49:162–8. doi: 10.1194/jlr.M700406-JLR200. [DOI] [PubMed] [Google Scholar]
- Lee HJ, Rao JS, Ertley RN, Chang L, Rapoport SI, Bazinet RP. Chronic fluoxetine increases cytosolic phospholipase A2 activity and arachidonic acid turnover in brain phospholipids of the unanesthetized rat. Psychopharmacology (Berl) 2007;190:103–115. doi: 10.1007/s00213-006-0582-1. [DOI] [PubMed] [Google Scholar]
- Li D, He L. Meta-analysis supports association between serotonin transporter (5-HTT) and suicidal behavior. Mol Psychiatry. 2007;12:47–54. doi: 10.1038/sj.mp.4001890. [DOI] [PubMed] [Google Scholar]
- Li Q, Wichems CH, Ma L, Van de Kar LD, Garcia F, Murphy DL. Brain region-specific alterations of 5-HT2A and 5-HT2C receptors in serotonin transporter knockout mice. J Neurochem. 2003;84:1256–65. doi: 10.1046/j.1471-4159.2003.01607.x. [DOI] [PubMed] [Google Scholar]
- Marek GJ, Aghajanian GK. LSD and the phenethylamine hallucinogen DOI are potent partial agonists at 5-HT2A receptors on interneurons in rat piriform cortex. J Pharmacol Exp Ther. 1996;278:1373–82. [PubMed] [Google Scholar]
- Marques FZ, Hutz MH, Bau CH. Influence of the serotonin transporter gene on comorbid disorders among alcohol-dependent individuals. Psychiatr Genet. 2006;16:125–31. doi: 10.1097/01.ypg.0000199449.07786.7d. [DOI] [PubMed] [Google Scholar]
- Masoliver E, Menoyo A, Perez V, Volpini V, Rio ED, Perez J, Alvarez E, Baiget M. Serotonin transporter linked promoter (polymorphism) in the serotonin transporter gene may be associated with antidepressant-induced mania in bipolar disorder. Psychiatr Genet. 2006;16:25–9. doi: 10.1097/01.ypg.0000180684.26288.d7. [DOI] [PubMed] [Google Scholar]
- Mathews TA, Fedele DE, Coppelli FM, Avila AM, Murphy DL, Andrews AM. Gene dose-dependent alterations in extraneuronal serotonin but not dopamine in mice with reduced serotonin transporter expression. J Neurosci Methods. 2004;140:169–81. doi: 10.1016/j.jneumeth.2004.05.017. [DOI] [PubMed] [Google Scholar]
- Motulsky H. Prism 4 Statistics Guide-Statistical analyses for laboratory and clinical researchers. GraphPad Software Inc.; San Diego: 2003. pp. 82–84. [Google Scholar]
- Murphy DL, Fox MA, Timpano KR, Moya P, Ren-Patterson R, Andrews AM, Holmes A, Lesch KP, Wendland JR. How the serotonin story is being rewritten by new gene-based discoveries principally related to SLC6A4, the serotonin transporter gene, which functions to influence all cellular serotonin systems. Neuropharmacology. 2008;55:932–60. doi: 10.1016/j.neuropharm.2008.08.034. [DOI] [PMC free article] [PubMed] [Google Scholar]
- Murphy DL, Lerner A, Rudnick G, Lesch KP. Serotonin transporter: gene, genetic disorders, and pharmacogenetics. Mol Interv. 2004;4:109–23. doi: 10.1124/mi.4.2.8. [DOI] [PubMed] [Google Scholar]
- Murphy DL, Lesch KP. Targeting the murine serotonin transporter: insights into human neurobiology. Nat Rev Neurosci. 2008;9:85–96. doi: 10.1038/nrn2284. [DOI] [PubMed] [Google Scholar]
- Ong WY, Sandhya TL, Horrocks LA, Farooqui AA. Distribution of cytoplasmic phospholipase A2 in the normal rat brain. J. Hirnforsch. 1999;39:391–400. [PubMed] [Google Scholar]
- Pardue S, Rapoport SI, Bosetti F. Co-localization of cytosolic phospholipase A2 and cyclooxygenase-2 in Rhesus monkey cerebellum. Brain Res Mol Brain Res. 2003;116:106–14. doi: 10.1016/s0169-328x(03)00262-6. [DOI] [PubMed] [Google Scholar]
- Praschak-Rieder N, Kennedy J, Wilson AA, Hussey D, Boovariwala A, Willeit M, Ginovart N, Tharmalingam S, Masellis M, Houle S, Meyer JH. Novel 5-HTTLPR allele associates with higher serotonin transporter binding in putamen: a [11C] DASB positron emission tomography study. Biol Psychiatry. 2007;62:327–31. doi: 10.1016/j.biopsych.2006.09.022. [DOI] [PubMed] [Google Scholar]
- Qu Y, Chang L, Klaff J, Seemann R, Greenstein D, Rapoport SI. Chronic fluoxetine upregulates arachidonic acid incorporation into the brain of unanesthetized rats. Eur Neuropsychopharmacol. 2006;16:561–71. doi: 10.1016/j.euroneuro.2006.01.008. [DOI] [PubMed] [Google Scholar]
- Qu Y, Villacreses N, Murphy DL, Rapoport SI. 5-HT2A/2C receptor signaling via phospholipase A2 and arachidonic acid is attenuated in mice lacking the serotonin reuptake transporter. Psychopharmacology (Berl) 2005;180:12–20. doi: 10.1007/s00213-005-2231-5. [DOI] [PubMed] [Google Scholar]
- Rao JS, Ertley RN, Rapoport SI, Bazinet RP, Lee H-J. Chronic NMDA administration to rats up-regulates frontal cortex cytosolic phospholipase A2 and its transcription factor, activator protein-2. J Neurochem. 2007;102:1918–1927. doi: 10.1111/j.1471-4159.2007.04648.x. [DOI] [PubMed] [Google Scholar]
- Rao JS, Lee HJ, Rapoport SI, Bazinet RP. Mode of action of mood stabilizers: is the arachidonic acid cascade a common target? Mol Psychiatry. 2008;13:585–96. doi: 10.1038/mp.2008.31. [DOI] [PubMed] [Google Scholar]
- Rapoport SI. In vivo fatty acid incorporation into brain phospholipids in relation to plasma availability, signal transduction and membrane remodeling. J. Mol. Neurosci. 2001;16:243–261. doi: 10.1385/JMN:16:2-3:243. [DOI] [PubMed] [Google Scholar]
- Rapoport SI, Bosetti F. Do lithium and anticonvulsants target the brain arachidonic acid cascade in bipolar disorder? Arch. Gen. Psychiatry. 2002;59:592–596. doi: 10.1001/archpsyc.59.7.592. [DOI] [PubMed] [Google Scholar]
- Rapoport SI, Chang MCJ, Spector AA. Delivery and turnover of plasma-derived essential PUFAs in mammalian brain. J. Lipid Res. 2001;42:678–685. [PubMed] [Google Scholar]
- Robinson PJ, Noronha J, DeGeorge JJ, Freed LM, Nariai T, Rapoport SI. A quantitative method for measuring regional in vivo fatty-acid incorporation into and turnover within brain phospholipids: Review and critical analysis. Brain Res. Brain Res. Rev. 1992;17:187–214. doi: 10.1016/0165-0173(92)90016-f. [DOI] [PubMed] [Google Scholar]
- Rubino T, Realini N, Castiglioni C, Guidali C, Vigano D, Marras E, Petrosino S, Perletti G, Maccarrone M, Di Marzo V, Parolaro D. Role in anxiety behavior of the endocannabinoid system in the prefrontal cortex. Cereb Cortex. 2008;18:1292–301. doi: 10.1093/cercor/bhm161. [DOI] [PubMed] [Google Scholar]
- Rutkowska M, Jamontt J, Gliniak H. Effects of cannabinoids on the anxiety-like response in mice. Pharmacol Rep. 2006;58:200–6. [PubMed] [Google Scholar]
- Sapirstein A, Saito H, Texel SJ, Samad TA, O'Leary E, Bonventre JV. Cytosolic phospholipase A2α regulates induction of brain cyclooxygenase-2 in a mouse model of inflammation. Am J Physiol Regul Integr Comp Physiol. 2005;288:R1774–82. doi: 10.1152/ajpregu.00815.2004. [DOI] [PubMed] [Google Scholar]
- Serretti A, Benedetti F, Zanardi R, Smeraldi E. The influence of Serotonin Transporter Promoter Polymorphism (SERTPR) and other polymorphisms of the serotonin pathway on the efficacy of antidepressant treatments. Prog Neuropsychopharmacol Biol Psychiatry. 2005;29:1074–84. doi: 10.1016/j.pnpbp.2005.03.013. [DOI] [PubMed] [Google Scholar]
- Shimizu T, Wolfe LS. Arachidonic acid cascade and signal transduction. J. Neurochem. 1990;55:1–15. doi: 10.1111/j.1471-4159.1990.tb08813.x. [DOI] [PubMed] [Google Scholar]
- Sokoloff L. Energetics of functional activation in neural tissues. Neurochem Res. 1999;24:321–9. doi: 10.1023/a:1022534709672. [DOI] [PubMed] [Google Scholar]
- Stenfors C, Ross SB. Evidence for involvement of 5-hydroxytryptamine1B autoreceptors in the enhancement of serotonin turnover in the mouse brain following repeated treatment with fluoxetine. Life Sci. 2002;71:2867–80. doi: 10.1016/s0024-3205(02)02138-0. [DOI] [PubMed] [Google Scholar]
- Tabachnick BG, Fidell LS. Computer-assisted research design and analysis. Allyn and Bacon; Boston: 2001. pp. 184–188. [Google Scholar]
- Toborek M, Malecki A, Garrido R, Mattson MP, Hennig B, Young B. Arachidonic acid-induced oxidative injury to cultured spinal cord neurons. J Neurochem. 1999;73:684–92. doi: 10.1046/j.1471-4159.1999.0730684.x. [DOI] [PubMed] [Google Scholar]
- Uher R, McGuffin P. The moderation by the serotonin transporter gene of environmental adversity in the aetiology of mental illness: review and methodological analysis. Mol Psychiatry. 2008;13:131–46. doi: 10.1038/sj.mp.4002067. [DOI] [PubMed] [Google Scholar]
- Wendland JR, Moya PR, Kruse MR, Ren-Patterson RF, Jensen CL, Timpano KR, Murphy DL. A novel, putative gain-of-function haplotype at Slc6a4 associates with obsessive-compulsive disorder. Hum Mol Genet. 2008;17:717–23. doi: 10.1093/hmg/ddm343. [DOI] [PubMed] [Google Scholar]
- Willins DL, Meltzer HY. Direct injection of 5-HT2A receptor agonists into the medial prefrontal cortex produces a head-twitch response in rats. J Pharmacol Exp Ther. 1997;282:699–706. [PubMed] [Google Scholar]
- Xu J, Weng YI, Simonyi A, Krugh BW, Liao Z, Weisman GA, Sun GY. Role of PKC and MAPK in cytosolic PLA2 phosphorylation and arachadonic acid release in primary murine astrocytes. J Neurochem. 2002;83:259–70. doi: 10.1046/j.1471-4159.2002.01145.x. [DOI] [PubMed] [Google Scholar]
- Xu L, Han C, Lim K, Wu T. Activation of cytosolic phospholipase A2α through nitric oxide-induced S-nitrosylation. Involvement of inducible nitric-oxide synthase and cyclooxygenase-2. J Biol Chem. 2008;283:3077–87. doi: 10.1074/jbc.M705709200. [DOI] [PubMed] [Google Scholar]
- Zhang J, Goorha S, Raghow R, Ballou LR. The tissue-specific, compensatory expression of cyclooxygenase-1 and -2 in transgenic mice. Prostaglandins Other Lipid Mediat. 2002;67:121–35. doi: 10.1016/s0090-6980(01)00177-0. [DOI] [PubMed] [Google Scholar]