

Abstract
The frontal eye field (FEF) is a cortical structure involved in cognitive aspects of eye movement control. Neurons in the FEF, as in most of cerebral cortex, primarily represent contralateral space. They fire for visual stimuli in the contralateral field and for saccadic eye movements made to those stimuli. Yet many FEF neurons engage in sophisticated functions that require flexible spatial representations such as shifting receptive fields and vector subtraction. Such functions require knowledge about all of space, including the ipsilateral hemifield. How does the FEF gain access to ipsilateral information? Here, we provide evidence that one source of ipsilateral information may be the opposite superior colliculus (SC) in the midbrain. We physiologically identified neurons in the FEF that receive input from the opposite SC, same-side SC, or both. We found a striking structure–function relationship: the laterality of the response field of an FEF neuron was predicted by the laterality of its SC inputs. FEF neurons with input from the opposite SC had ipsilateral fields, whereas neurons with input from the same-side SC had contralateral fields. FEF neurons with input from both SCs had lateralized fields that could point in any direction. The results suggest that signals from the two SCs provide each FEF with information about all of visual space, a prerequisite for higher level sensorimotor computations.
Introduction
Previous reports indicate that the frontal eye field (FEF), a cortical region involved in vision and eye movements, codes predominately for contralateral space (Bruce and Goldberg, 1985; Bruce et al., 1985; Schall et al., 1995; Tehovnik et al., 2000). However, some FEF neurons possess ipsilateral response fields (RFs), and many FEF neurons perform operations that require visual and motor information about both hemifields. These operations include shifting RFs (Umeno and Goldberg, 1997, 2001; Sommer and Wurtz, 2006) and vector subtraction (Goldberg and Bruce, 1990; Tian et al., 2000). What are the sources of the ipsilateral information, and how does it reach the FEF?
There are a number of potential routes for ipsilateral signals to reach the FEF. One route would be the corpus callosum, which could provide signals from the FEF on the opposite side of the brain (Pandya and Vignolo, 1971; Gould et al., 1986). This scenario is unlikely because functions such as omni-shifting RFs and transhemifield saccadic sequences survive transection of the corpus callosum (Berman et al., 2005; Colby et al., 2005; Heiser et al., 2005; Berman et al., 2007) and the result of one FEF acting on the other seems to be mostly inhibitory (Schlag et al., 1998; Seidemann et al., 2002; Izawa et al., 2004). Although this does not exclude the possibility that the opposite FEF is partially involved in providing ipsilateral signals, it does suggest that the main function of interhemispheric FEF connections is to enforce motor act consensus (Schlag et al., 1998).
Ascending pathways from subcortical structures may also provide ipsilateral information. One candidate is the superior colliculus (SC) on the opposite side of the brain (see Fig. 1). The SC, a sensorimotor structure in the midbrain, is interconnected with the FEF (Fries, 1984; Stanton et al., 1988; Lynch et al., 1994). Each SC codes for contralateral space (Schiller and Koerner, 1971; Wurtz and Goldberg, 1972) and is known to excite FEF neurons on the same side of the brain via a relay in the mediodorsal (MD) nucleus of the thalamus (Sommer and Wurtz, 1998, 2004a). Similarly, signals from the opposite SC could reach the FEF and do so by way of at least three possible routes (outlined in Fig. 1). Physiological techniques provide a feasible means to test these anatomical possibilities.
Figure 1.
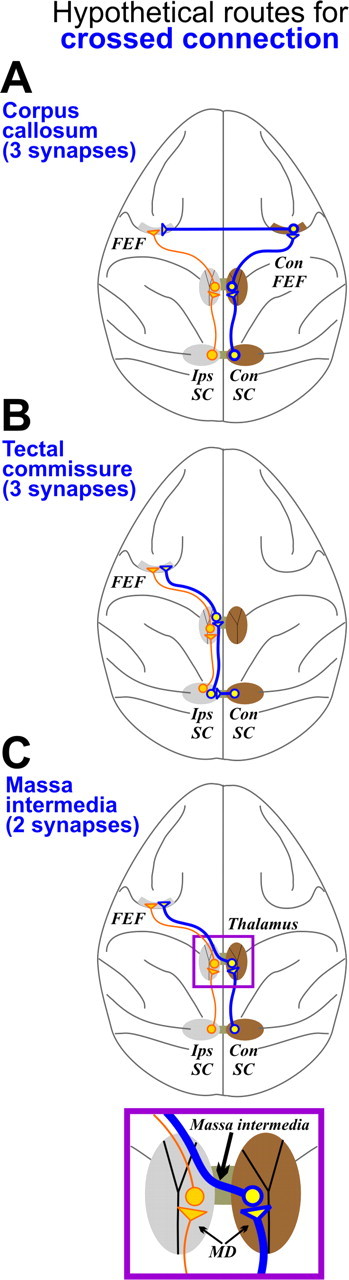
Three hypothetical routes for a crossed SC to FEF connection. The blue pathways show the possible crossed routes, and orange pathways show the known uncrossed route. A, Corpus callosum hypothesis. According to this hypothesis, ipsilateral information reaches the FEF by way of a trisynaptic pathway: the contralateral SC (Con SC) excites the contralateral FEF (Con FEF), which in turn transcallosally excites the FEF of the opposite hemisphere. B, Tectal commissure hypothesis. Like the corpus callosum hypothesis, this hypothesis implies at least three synaptic interruptions but differs at the point of decussation: the tectal commissure. After crossing to the ipsilateral SC (Ips SC), the ipsilateral coding signals would ascend to the FEF adjacent to the pathways that encode contralateral space. C, Massa intermedia hypothesis. This hypothesis predicts that the ipsilateral signals cross at the level of the MD thalamus via a commissural track known as the massa intermedia (see inset). On crossing, the MD relay neuron would project directly to the FEF. Anatomically, a crossed thalamocortical projection to prefrontal cortex has been demonstrated (Preuss and Goldman-Rakic, 1987). The massa intermedia route consists of only two synapses, implying a faster transmission time compared with the corpus callosum or tectal commissure-mediated pathways, both of which require at least three synapses (Swadlow et al., 1978; Lamantia and Rakic, 1990; Takahashi et al., 2007). In principle, these pathways are not mutually exclusive; all could be functional to varying degrees.
The objectives of this study were threefold. First, we aimed to determine whether FEF neurons receive input from the contralateral SC and which of the three crossed pathways likely provided the input. Second, we sought to characterize the signals conveyed by the crossed pathway and understand how they relate to the spatial representations of recipient FEF neurons. Specifically, we examined whether the inputs were excitatory and whether the recipient FEF neurons were tuned for ipsilateral space. Third, we aimed to compare the FEF neurons that received input from the crossed pathway with those that received input from the same-side SC pathway, to clarify how inputs from the two SCs may interact to provide the FEF with information about all of space.
Materials and Methods
Surgery and region identification.
In four monkeys (Macaca mulatta), we implanted scleral search coils for measuring eye position, recording chambers for accessing FEF and SC, and a post for immobilizing the head during recording experiments (for details, see Sommer and Wurtz, 2004a). The locations of FEF and SC were determined stereotaxically and verified by physiological means: the recording of saccade-related neurons and the evocation of saccades at <50 μA threshold (Bruce and Goldberg, 1985). One or more tungsten microelectrodes for stimulation were semichronically implanted in the intermediate layers of each SC (termed “ipsilateral” and “contralateral” relative to the recorded FEF). We positioned the stimulating electrodes near the middle of each SC (i.e., ∼12° amplitude and within a few degrees of the horizontal meridian on the topographic map). We recorded from single FEF neurons by conventional extracellular means while attempting to activate them with SC simulation (single biphasic pulse, 0.15 ms/phase).
Behavioral tasks.
During recording sessions, each monkey sat in a primate chair facing a tangent screen onto which visual stimuli were backprojected. Once a neuron was sufficiently isolated, we characterized its activity with several oculomotor tasks (described below). In all tasks, the monkey was required to fixate a spot of light projected onto the center of the screen. Then, with timings that depended on task contingency, the monkey was required to execute an appropriate eye movement for a liquid reward.
First, we determined the directional tuning of the RF with a direction series task. The monkey made saccades to targets in eight different locations, along cardinal axes and diagonals, using an amplitude that seemed optimal from initial qualitative testing. Second, with the preferred direction of the RF determined, we aligned targets along this direction during an amplitude series task. The monkey made saccades of eight different amplitudes (2, 5, 10, 20, 30, 40, 50, and 60°) along the preferred direction of the neuron. If the optimal amplitude for evoking a maximal response differed substantially from that estimated with initial qualitative testing, we repeated the direction series task at the newly determined amplitude. We iterated between these tasks, if necessary, to firmly establish the range and center of the neuronal RF. Both the direction series and amplitude series tasks involved visually guided saccades; the fixation spot disappeared, and, simultaneously, a single visual target appeared. Saccades were made after a reaction time (typically 150–250 ms) with no imposed delay.
After determining the center of the RF of the neuron, we had monkeys make memory-guided saccades to that location. The monkey fixated a spot of light, and then a target flashed for 50 ms at the center of the RF. The monkey was not allowed to look at the target location until the fixation spot disappeared 500–1000 ms later. Then the monkey had to make a saccade to the remembered location of the target (for details, see Sommer and Wurtz, 2004a). The memory-guided task was used because it permitted temporal dissociation of visual responses from saccadic responses (Mays and Sparks, 1980; Hikosaka and Wurtz, 1983).
Neurophysiology.
We recorded only from single FEF neurons activated orthodromically from the left or right SC. Our search strategy was to inspect the multiunit activity while stimulating one or the other SC. If we detected signs of stimulation-triggered activation, we manipulated the electrode depth to isolate one of the activated neurons. If we succeeded in isolating an activated neuron, we mapped its RF and studied its other task-related properties. Otherwise, we moved on. A neuron was considered orthodromically activated if it discharged consistently (≥50% of stimulation attempts) at a comparable latency (variability of ∼2–4 ms). Detailed procedures were described previously (Sommer and Wurtz, 1998, 2004a). To rule out antidromic activation, we only accepted neurons that failed the collision test. Once orthodromic activation of a neuron was suitably verified from one SC, we would attempt to activate the neuron from the other SC. Our searching current was 600 μA, but if a neuron was activated from one SC and apparently not the second SC, we tried current levels up to 1500 μA in the second SC before concluding that the FEF neuron could not be activated from it.
Our strategy did not permit quantification of the fraction of activated versus nonactivated neurons. Qualitatively, SC-activated neurons seemed to be in the minority, ∼1 of every 15 neurons encountered. Since we mapped RFs only after identifying a neuron as activated, we could not estimate the fraction of FEF neurons with ipsilaterally tuned RFs that were not drivable from the contralateral SC. All questions like these, relating to nonactivated neurons, are not answerable with our techniques.
Data analysis.
All neuronal data were converted from raw spike rasters to average firing rates during defined task epochs for off-line analysis. Our first goal was to determine whether an orthodromically activated neuron was significantly task modulated, and if so, in which aspect of the task it was modulated. To determine this, we divided each memory-guided task trial into a series of analysis epochs. A neuron was considered visual if it exhibited neuronal activity during a visual epoch (50–150 ms after target onset) that was significantly greater than baseline activity (300–0 ms before target onset). A neuron was considered to be movement related if it exhibited activity during a saccadic epoch (50 ms before to 50 ms after saccade initiation) that was significantly greater than both the intervening delay epoch (last 300 ms of the delay period) and the baseline epoch.
Our second goal was to determine the spatial tuning curves of the task-modulated neurons. For this, we divided each directional series task trial into visual and saccadic epochs as defined above, and measured mean firing rates as a function of visual target location and saccade direction (Sommer and Wurtz, 2004a). The visual and saccadic activities for each direction were individually compared, and the maximum value of each comparison was used for constructing the final tuning curve. The resultant tuning curve was thus a composite representing the boundary of the visual field and movement field (supplemental Fig. 3, available at www.jneurosci.org as supplemental material). For some analyses (see Results), we considered the separate visual and movement fields independently, in neurons that had both fields.
Using the tuning curves, we constructed an index for each neuron that summarized the laterality of its RF. First, we found the average firing rate for saccades made to targets in contralateral space (FRC) and ipsilateral space (FRI). Vertical targets were excluded, so each of the averages included three target locations (at the diagonal and horizontal directions). Then we calculated an RF laterality index (RFLI) as the contrast ratio of the average firing rates: (FRC − FRI)/(FRC + FRI). The RFLI ranged from −1 (completely ipsilateral tuning) to 1 (completely contralateral tuning), with 0 representing symmetric tuning. We used the RFLI to determine whether biases in the laterality of the RF of a neuron varied continuously with biases in the laterality of its collicular inputs. An SC laterality index (SCLI) compared the current thresholds for activating a neuron from contralateral SC (IC) versus ipsilateral SC (II) using the contrast ratio (II − IC)/(II + IC). The SCLI ranged from −1 (activation was from ipsilateral SC only) to 1 (activation was from contralateral SC only). Neurons activated from both SCs had SCLI values between −1 and 1, and the special case of SCLI of 0 represented equal activation from the two SCs. To analyze whether RF laterality was related to input laterality from the two SCs, we performed a Spearman correlation test on the RFLI and SCLI data.
Statistics.
All data were statistically analyzed using conventional parametric, nonparametric, and circular statistics with p < 0.05 as the criterion for significance.
Results
Excitatory activation of the FEF from the two SCs
We recorded from single neurons throughout the FEF and attempted to orthodromically activate them by stimulating each SC. The FEF was sampled from the ventrolateral small saccade zone (∼2° amplitude saccades) to the dorsomedial large saccade zone (∼30° amplitude saccades) as determined by the eccentricities of visuomovement response fields and the vectors of stimulation-evoked saccades (Bruce and Goldberg, 1985; Bruce et al., 1985; Sommer and Wurtz, 2000, 2004). Successful orthodromic activation of an FEF neuron provided physiological evidence for connectivity (Sommer and Wurtz, 1998, 2002, 2004a,b, 2006). We were able to orthodromically activate a total of 55 FEF neurons. Of these, 12 were driven from the contralateral SC alone (ConSC-only neurons), 16 from both SCs (BothSC neurons), and 27 from the ipsilateral SC alone (IpsSC-only neurons). All three types of neurons were found throughout the FEF, presumably in layer IV, the principal thalamic recipient zone (Giguere and Goldman-Rakic, 1988). All of the neurons were identified as receiving input from the SC, but none seemed to project to the SC [i.e., all of the neurons were orthodromically but not antidromically activated from the SC; also found by Sommer and Wurtz (2004a)].
Every instance of detected orthodromic activation from the SC was excitatory as evidenced by the reliable evocation of short-latency spikes. We found no evidence for stimulation-evoked inhibition. Although we feel confident that we could have identified stimulation-evoked pauses in the spontaneous activity of most of the neurons (the average baseline firing rate of the drivable neurons was 17 sp/s), it is possible that some inhibition occurred that escaped our detection. Figure 2A depicts example action potential waveforms from a ConSC-only neuron. The stimulus artifact is at time 0. This neuron fired with a latency of 5.8–6.8 ms in response to stimulation from the contralateral SC (top), but not from the ipsilateral SC (bottom). IpsSC-only neurons showed similar activations but solely from stimulation of the ipsilateral SC (data not shown). We refer to these neurons as Con- or Ips-“only,” although the failure to activate them from the other SC is a negative result and should be interpreted cautiously (e.g., larger currents may have revealed activation; we tried up to 1.5 mA) (for more about this issue, see penultimate paragraph of Discussion).
Figure 2.
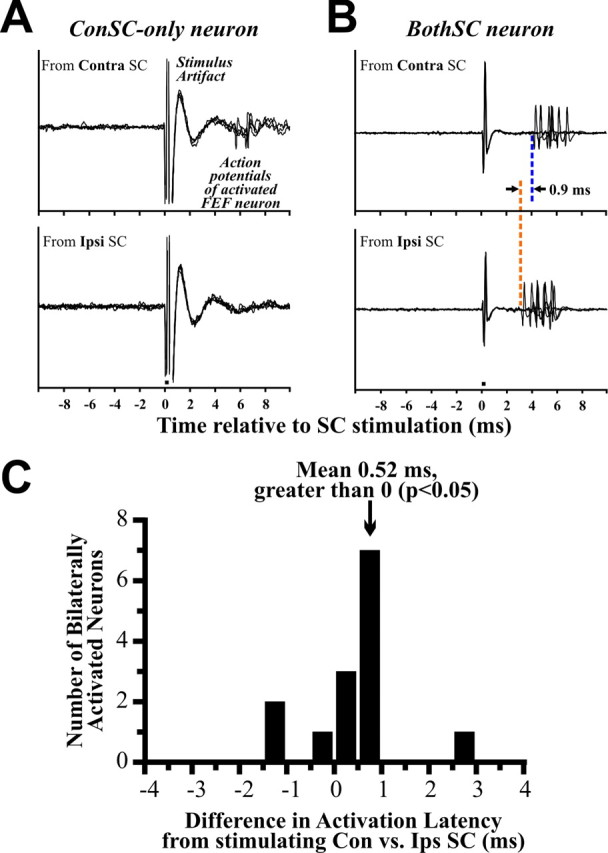
Orthodromic activation of FEF neurons. A, Some neurons were activated from only one SC. Action potentials evoked from such a neuron are shown. It fired in response to stimulation of the contralateral SC (top) but not the ipsilateral SC (bottom). The small bar below the lower stimulus artifact represents duration of SC stimulation (0.3 ms). B, Other neurons were activated from both SCs. The minimal activation latency from each SC was measured using dozens of trials (only a few are shown here for clarity). This example neuron fired 0.9 ms later for Contra SC stimulation than for Ipsi SC stimulation. C, Comparison of activation latencies for 14 neurons activated from both SCs. On average, the activation took 0.52 ms longer from the contralateral SC, significantly longer than from the ipsilateral SC. The slightly longer time is expected from a longer axonal length required to cross hemispheres, but it does not seem long enough to suggest additional synapses.
Other FEF neurons, in contrast, were clearly activated from both SCs. The action potentials from one example are shown in Figure 2B. This neuron fired 0.9 ms later for Contra SC stimulation (top) than for Ipsi SC stimulation (bottom). Our first main result, therefore, was that FEF neurons may be orthodromically activated from the contralateral SC, the ipsilateral SC, or both, and that this activation is excitatory.
Route of activation from the contralateral SC
Input to the FEF from the contralateral SC could ascend by way of at least three potential routes. Three synapses are predicted by the corpus callosum hypothesis (Fig. 1A) and tectal commissure hypothesis (Fig. 1B) but only two synapses for the massa intermedia hypothesis (Fig. 1C). The same-side pathway (from the ipsilateral SC) involves two synapses as well, and thus the massa intermedia hypothesis predicts that activation latencies from the contralateral SC should exceed activation latencies from the ipsilateral SC by only a small amount attributable to different axon lengths. In contrast, the other two hypotheses predict that activation latencies from the contralateral SC should exceed activation latencies from the ipsilateral SC by a larger amount, attributable to both longer axons plus an extra synapse.
To test among these three hodological hypotheses, we analyzed the activation latencies of the neurons. We focused on the BothSC neurons since they could be activated through both the same-side and crossed pathways and thus provide the most direct temporal comparison of same-side versus crossed connectivity. We found that signals from the contralateral SC took an average of 3.87 ms to reach the BothSC neurons, whereas signals from the ipsilateral SC took an average of 3.35 ms, resulting in a significant average latency difference of 0.52 ms (t test, p < 0.05) (Fig. 2C). This latency difference implies slightly longer axons. At an estimated conduction speed of 15 m/s, for example, the extra 0.52 ms would imply an extra 7.8 mm, approximately the distance needed to traverse the massa intermedia (Olszewski, 1952). The latency difference seems far too short, however, to account for the additional synapse in the other two potential paths. Transmission times across the corpus callosum or tectal commissure and through a synapse are on the order of 1–10 ms (Swadlow et al., 1978; Takahashi et al., 2007). Our data suggest that the primary, functional route from the contralateral SC to the FEF (although not necessarily the only route) involves a thalamic crossing point with no extra synapses.
Response fields of FEF neurons driven from one SC
Next, we evaluated whether structure predicted function in the sense that the laterality of connections from the SCs predicts the laterality of the RF of an FEF neuron. We did not examine finer details such as the correspondence between stimulation location within an SC map and RF direction of activated FEF neurons. Examining such details would have necessitated systematic changes in stimulating electrode locations across the topographic maps of both SCs (Robinson, 1972), which seemed like too much of a risk in an already challenging experiment.
Each SC represents contralateral visual space and saccades, and therefore the most parsimonious prediction was that FEF neurons with solely crossed SC input would have ipsilateralized fields, FEF neurons with solely same-side input would have contralateralized fields, and FEF neurons with convergent input from both SCs would have bilateralized fields (i.e., fields that extend equally into either hemifield). While we recorded from identified FEF neurons, monkeys performed oculomotor tasks designed to characterize the visuosaccadic activity of each neuron and its spatial tuning (for details of measuring visual and movement fields, see Materials and Methods).
We began our analysis with the simplest sets of FEF neurons, those activated from only one SC. Figure 3A shows data from an example ConSC-only neuron (pathway depicted at top). Shown are the raw activity plots for visually guided saccades in eight directions (middle) as well as a summary tuning curve (bottom). The neuron exhibited a spatially selective increase in firing rate for visuosaccadic tasks and coded predominately for ipsilateral space (relative to the recorded FEF). Most neurons of the ConSC-only set (11 of 12) had RFs tuned ipsilaterally (all summary tuning curves are shown in supplemental Fig. 1, available at www.jneurosci.org as supplemental material). To quantify this RF laterality, we represented each tuning curve with its mean vector (Fig. 3, bottom, red arrow) and plotted the vectors from the entire population (Fig. 4A, left). The average mean vector for the ConSC-only group (brown arrow) was 10.7 spikes/s in magnitude (represented by vector length), which was significantly different from zero (p < 0.01; the significance of a mean vector is established by constructing the 99% confidence ellipse of the tips of all the vectors and showing that zero falls outside of the ellipse) (Batschelet, 1981). The mean vector was directed almost purely ipsilaterally (angle was 169.9°). For confirmation of this circular statistics approach, we also constructed a more traditional population tuning curve (Fig. 4B, left) by averaging all of the individual tuning curves. This population tuning curve was significantly biased (ANOVA, p < 0.01) toward ipsilateral space. We also normalized the curves to remove any influences of neurons with particularly high firing rates and found a comparable bias (ANOVA, p < 0.01) for ipsilateral space (Fig. 4C).
Figure 3.
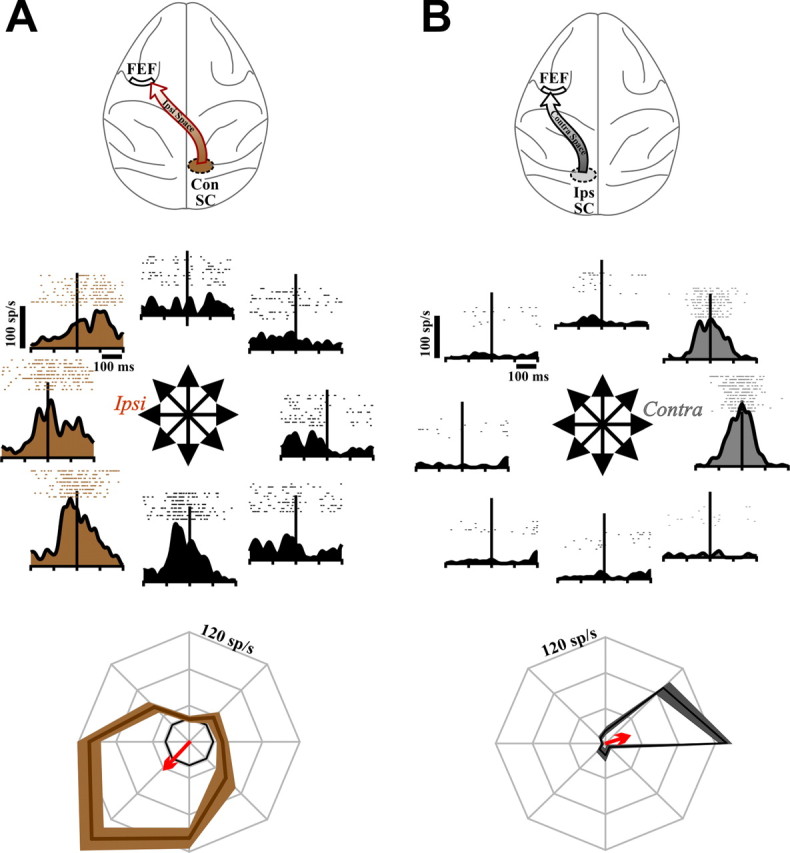
FEF neurons orthodromically activated from the contralateral SC only (A) and the ipsilateral SC only (B). In both panels, diagrams show route of activation at top. Below that is a directional series depicting the firing rates for an example single neuron. Rasters and spike density functions are aligned to saccade onset. The brown shading emphasizes the ipsilateral directions in A, and the gray shading, the contralateral directions in B. At bottom are polar plots that summarize the example data (colored curves, mean ± SE). The arrows represent the mean tuning vectors in each case. The inner concentric curves (where visible) show baseline firing rates.
Figure 4.

Population results for tuning curves in all three samples of neurons. A, The mean tuning curve vectors for all individual neurons (thin black arrows) are shown, along with the overall resultant mean vectors and 99% confidence ellipses for each sample (bold colored arrows and ellipses). B, The population average tuning curves for each sample (mean and SE), calculated from raw firing rate data. C, The population tuning curves for each sample (mean and SE), calculated from normalized data in which the activity of each neuron was set to 1.0 for the direction associated with maximal firing. *p < 0.01 by ANOVA for the entire tuning curve. The gray inner concentric curves show baseline firing rates. See Results for details.
Results from an example IpsSC-only neuron are represented in Figure 3B. This neuron coded for contralateral space and movements, activity reflective of sole input from the SC of the same side. Nearly all of the IpsSC-only FEF neurons (25 of 27) had contralateral fields. The mean vector for this set of neurons was significant (amplitude, 13.97 spikes/s; p < 0.01) and directed almost purely contralaterally (angle, 8.17°) (Fig. 4A, right). This tuning was confirmed in the population average curve (Fig. 4B,C, right) (ANOVA, p < 0.01).
These results support the parsimonious structure–function hypothesis: FEF neurons have lateralized RFs that are directed in strict accordance with their SC input laterality. Neurons with only crossed input had ipsilateralized fields and neurons with only same-side input had contralateralized fields. Next, we examined whether this structure–function relationship extended to BothSC neurons, those with bilateral SC input.
RFs of FEF neurons driven from both SCs
The RFs are lateralized, pandirectional, monolobed, and independent of relative weightings of SC inputs
The simplest hypothesis is that convergent input from both SCs would cause recipient FEF neurons to have bilateral RFs. The possible shapes of such RFs include omnidirectional (circular with no distinct lobes), vertically oriented (one lobe on the vertical axis), or bilobed (two similar lobes with one pointing left and one pointing right). We studied the RF structure of BothSC neurons and found, first, that RF tuning was not omnidirectional. It was spatially biased for most (15 of 16) of the BothSC neurons (ANOVA, p < 0.05 criterion) (supplemental Figs. 1, center; 2, available at www.jneurosci.org as supplemental material). The individual tuning directions covered virtually every portion of space (Fig. 4A, middle), however, so that the mean vector of the population was not significant (99% confidence ellipse included zero) and the average tuning curve of the population was unbiased (ANOVA, p > 0.05) (Fig. 4B,C, middle). Hence the RFs of BothSC neurons are lateralized and pandirectional (i.e., they collectively represent all directions).
Second, we tested whether the range of tuning directions exhibited a bias toward vertical orientations. Such an effect might be expected because the vertical meridian of the visual field is common to both SCs. To search for a vertical tuning bias, we calculated the angles of the RF mean vectors in two ways: relative to the horizontal axis and relative to the vertical axis. A vertical bias would be evident in a significantly smaller average angle relative to vertical than to horizontal. No significant difference was found, however (average angle relative to horizontal, 40.7°; average angle relative to vertical, 49.3°; t test, p = 0.293).
Third, we searched for signs of bilobed RFs, which might be expected from summing sharply tuned directional information from the two SCs. It was clear from a qualitative inspection of the data, however, that bilobed RFs (similar extensions into contralateral and ipsilateral space) were present in only a small fraction of neurons, perhaps 3 of the 16 (supplemental Fig. 2C,D,P, available at www.jneurosci.org as supplemental material).
Finally, we tested whether the direction of RF laterality in individual BothSC neurons was related to the weighting of input from the two SCs. Some BothSC neurons were activated from one SC with much lower current threshold than from the other SC, implying stronger input from the first SC. In principle, this could explain how direction tuning is determined in BothSC neurons. Those neurons with ipsilaterally tuned RFs, for example, might have stronger input from the contralateral SC. To test this hypothesis, we calculated for each neuron a RFLI and a SCLI (see Materials and Methods). The critical test was on BothSC neurons, which had SCLI values between −1 and 1. If RF laterality varies smoothly with bias of SC input, then in the BothSC class there should be an inverse correlation between RFLI and SCLI. We found no correlation, however (p = 0.80). To check the method, we calculated the RFLI index for the groups in which SCLI is 1 (ConSC-only neurons) or −1 (IpsSC-only neurons). Confirming the reliability of the indices, the RFLI of ConSC-only neurons was significantly less than zero (median, −0.628; Wilcoxon's signed rank sum test, p < 0.001) and the RFLI of IpsSC-only was significantly greater than zero (median, 0.892; p < 0.001).
The movement fields and visual fields are relatively broad and misaligned
Overall, then, the RF shapes of BothSC neurons can be described as follows: they are lateralized, can point in any direction independently of SC input strength, and are monolobed. These findings refute our hypothesis that the RFs would be bilateral. The RF shapes of BothSC neurons were remarkably similar to the RF shapes of neurons driven from only one or the other SC (ConSC-only and IpsSC-only neurons). This unexpected result led us to ask, does the second SC input received by the BothSC neurons have any discernable influence on RF structure?
To answer this question, we compared the tuning curves of BothSC neurons with the tuning curves of IpsSC-only and ConSC-only neurons. First, we normalized each RF to its maximal firing rate, so that we could focus on RF shape regardless of absolute intensity of activity (Fig. 5A). For comparison, we pooled IpsSC-only and ConSC-only neurons into one “unilaterally driven” category. Then we rotated every curve so that its best direction was aligned to the right (Fig. 5B, top) and computed the average for the curves (Fig. 5B, bottom). It appeared that BothSC neurons (Fig. 5B, left) had broader tuning curves (larger areas) than neurons with unilateral SC input (Fig. 5B, right). To quantify this difference, we represented the area enclosed by each individual tuning curve as a ratio of the maximal possible area it could enclose (i.e., an equilateral octagon of radius 1). The distributions of these relative areas, expressed as percentages of maximal area, are shown in Figure 5C. We found that the average area of tuning curves for BothSC neurons (Fig. 5C, left) was 29% of maximal, significantly larger (t test, p < 0.005) than the average area of neurons with unilateral SC input (19% of maximal) (Fig. 5C, right). This suggested that the BothSC tuning curves were broader than the others.
Figure 5.
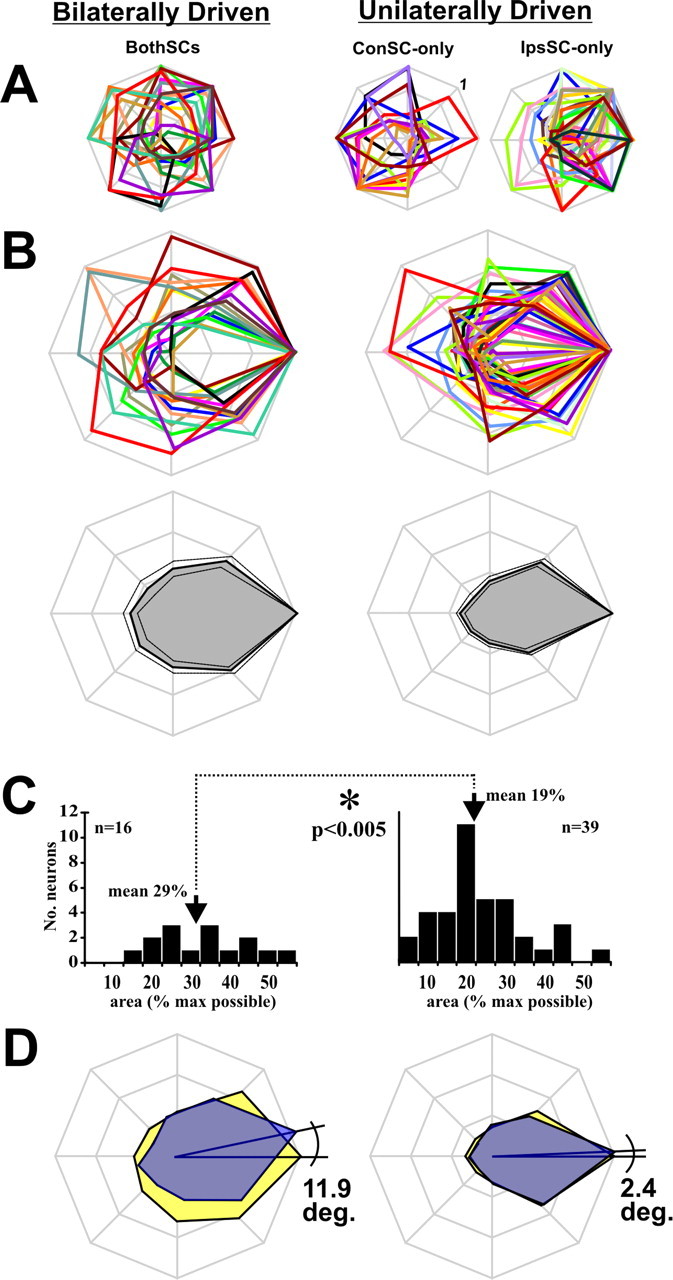
Shapes of the tuning curves. A, Normalized tuning curves for neurons in all three samples. B, Top, Same tuning curves but rotated with peak firing rate to the right. The ConSC-only and IpsSC-only populations are combined to form a single unilaterally driven category. Bottom, Average tuning curve for BothSC (left) and unilaterally driven (right) categories (mean and SEs). C, Histograms of the relative areas enclosed by the tuning curves, expressed as a percentage of the maximal possible area. The average relative area enclosed by BothSC neuron response fields (left) was significantly larger (p < 0.005) than that enclosed by unilaterally driven neuron response fields (right). D, Average tuning curves of the visual receptive fields (yellow) and movement fields (blue) for neurons that had both. The angles depict the average VM differences, which are standardized to appear as counterclockwise angular rotations of the movement fields (on a neuron-by-neuron basis a movement field could be rotated either clockwise or counterclockwise relative to the visual receptive field).
To study this breadth result in more detail, we analyzed the component visual receptive fields and movement fields. Until this point, we have considered the visual receptive fields and movement fields together, as a composite field (see Materials and Methods), because we were interested in the basic issue of tuning laterality. But the relatively broad composite fields of BothSC neurons raised the question of whether their individual visual and movement fields were unusually broad, or just less well aligned in neurons with both fields. We found, first, that the individual visual receptive fields were in fact broader for BothSC neurons (n = 14 neurons with a visual receptive field, 32% of maximal possible area) than for unilaterally driven neurons (n = 36, 19%; p = 0.002). The movement fields were broader, as well (n = 13 BothSC neurons, and n = 19 unilaterally driven neurons; 30 vs 20% of maximal possible area, respectively; p = 0.023). These differences in breadth can be seen in Figure 5D, which shows the average visual receptive field (yellow) and movement field (blue) for BothSC (left) and unilaterally driven neurons (right). The differences in breadth were not related to trivial factors such as general firing rate differences between the BothSC and unilaterally driven neurons (ANOVAs, p > 0.10 for both peak firing rate and baseline firing rate).
Finally, we quantified the alignment of visual fields and movement fields for each neuron that had both fields (“visuomovement” neurons as discussed in the next section; BothSC neurons, n = 11; unilaterally driven neurons, n = 16). We calculated the VM difference (i.e., the difference in angle between the preferred directions of the visual field and movement field) (Fig. 5D). Although the VM difference was always small, quantitatively it was larger for BothSC neurons (median, 11.9°) (Fig. 5D, left) than for unilaterally driven neurons (median, 2.4°; p < 0.001) (Fig. 5D, right).
In summary, the composite RFs of BothSC neurons were relatively broad, as were the component visual receptive fields and movement fields. In visuomovement BothSC neurons, the fields were relatively misaligned. These results suggest that the impact of the second SC input on BothSC neurons frees the directional range of tuning at the expense of sharp tuning and tight alignment of the visual and motor components of the RFs.
Visual and saccadic activity
As implied in our analysis of separate visual and movement fields above, we categorized the neurons of each population according to the types of task-related signals they carried. We found that, regardless of SC input laterality or RF laterality, the FEF neurons could be visual-only, movement-only, or visuomovement in nature (Bruce and Goldberg, 1985) (Table 1). We found no neurons that were unmodulated. The ConSC-only and IpsSC-only groups were each divided between approximately equal numbers of visual and visuomovement neurons. The BothSC group had an apparent bias for more visuomovement neurons, but this was not significant (Fisher's exact test, p = 0.104). Although many neurons had saccade-related activity, pure movement neurons (those lacking any visual response) were rare (n = 5), consistent with previous results (Sommer and Wurtz, 2004a).
Table 1.
Distribution of FEF neuron types activated from each SC
| FEF neuron type | ConSC-only | BothSC | IpsSC-only | Totals |
|---|---|---|---|---|
| Visual | 6 | 3 | 14 | 23 |
| Movement | 2 | 2 | 1 | 5 |
| Visuomovement | 4 | 11 | 12 | 27 |
| Totals | 12 | 16 | 27 | 55 |
We examined the timing of activity in the neurons, since previous reports of ipsilateral tuning in the FEF have emphasized postsaccadic activity (Bruce and Goldberg, 1985; Goldberg and Bruce, 1990) (but see Schlag et al., 1998). Figure 6A depicts the average activity profiles of ipsilaterally tuned neurons and contralaterally tuned neurons. Figure 6B is the same except that it was constructed from normalized firing rate data. The main point is that, regardless of tuning laterality, the average saccade-aligned activity (Fig. 6A,B, right) was presaccadic: it started before and peaked near saccade initiation. Visual responses, as well, were comparable regardless of response field laterality (Fig. 6A,B, left).
Figure 6.
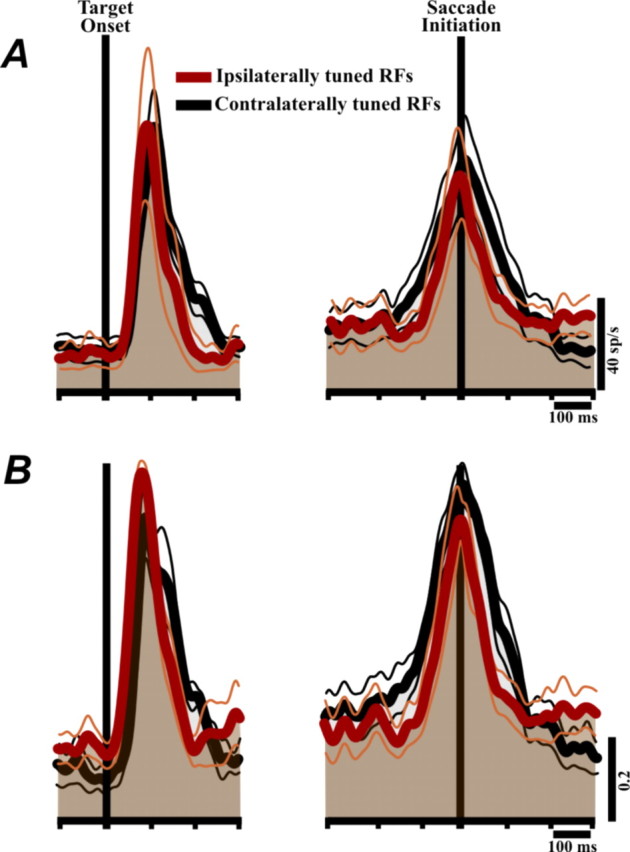
Activity profiles of the neurons, aligned to visual target onset (left) and saccade initiation (right). A, The average activity profiles of ipsilaterally tuned and contralaterally tuned neurons. B, Same as A, but for each neuron the activity profile was normalized to the peak firing rate within the respective (visual or presaccadic) epoch before averaging. Neurons pooled for this analysis were those with a significant visual (left) or saccade-related response (right). The ipsilaterally tuned data were from ConSC-only neurons and the contralaterally tuned data from IpsSC-only neurons. Calibration is at bottom right.
The visual and presaccadic bursts of contralaterally tuned neurons appeared to be slightly wider than those of ipsilaterally tuned neurons (Fig. 6A, averages of raw activity; B, averages of peak-normalized activity). To test for significance, we measured the width of each burst at half-height. For the visual burst, the width difference was significant in the normalized data (Mann–Whitney rank sum, p < 0.05), although not in the raw data (p = 0.3). For the saccadic bursts, the width difference was significant in both the raw (p < 0.005) and normalized data (p < 0.001).
Discussion
In this study, we provided evidence for a functional crossed pathway linking the opposite SC to the FEF. We identified FEF neurons that receive input from the contralateral SC and compared them with FEF neurons receiving input from the ipsilateral SC. We found that the connections were excitatory and that the activation latencies implied a thalamic decussation point for the crossed pathway. FEF neurons with SC inputs were found to have lateralized, presaccadic RFs that in toto represented visual stimuli and saccades in all directions. In large part, the laterality of the RFs of each neuron was predicted by its SC input laterality. The exception to this rule occurred for FEF neurons with bilateral SC input.
Properties of FEF neurons with input from the opposite SC
Many neurons in the FEF seem to have simple representations of stimulus locations or saccadic vectors, and they code primarily for contralateral space. Other FEF neurons, however, exhibit more complex signals. They may have presaccadically shifting RFs or activity attributable to vector subtraction, phenomena that occur for any direction. Such neurons require information about contralateral and ipsilateral visual targets and saccades. It has been unknown how neurons with such properties gain access to ipsilateral information. A main result of our study was to show that one physiologically defined set of neurons in the FEF, those with SC input, have clear presaccadic, ipsilateral information. We found that, as long as a neuron could be driven from the contralateral SC, it could have an ipsilateral RF. If it was driven exclusively from the contralateral SC, the chance of it having an ipsilateral RF was nearly 100%, whereas if it was driven from both the contralateral and ipsilateral SC, the chance dropped to ∼50%. If we could not drive it from the contralateral SC, the chance of it having an ipsilateral RF approached zero. These data suggest that the opposite SC sends information that may be used by FEF neurons with ipsilateral spatial representations.
Neurons in the primate cerebral cortex receive many inputs from numerous parts of the brain (Felleman and Van Essen, 1991; Douglas and Martin, 2004), so there was little reason to expect that the RF tuning of FEF neurons would be predicted almost entirely by a single subset of their inputs, the afferents arriving from a structure of the midbrain, the SC. Nonetheless, that is what we found. The clear structure–function relationship, illustrated in Figure 4, is a deceptively simple result with intriguing implications. One is that the SC inputs may dictate the RF laterality of the FEF neurons by serving as powerful drivers for the neurons (Sherman and Guillery, 1998). An alternative possibility is that the SC inputs do not dictate the RF laterality, but seek out and connect with FEF neurons that have compatible RF lateralities. In this case, the inputs could exert their influence in a more subtle, context-dependent way. These hypotheses are testable by recording from FEF neurons with crossed SC input, and then inactivating the crossed pathway (e.g., at the level of the SC or thalamus) and studying how the FEF RFs change. Similar experiments were performed on the same-side SC–FEF pathway (Sommer and Wurtz, 2006). In that circuit, it appeared that the SC input did not create the classical FEF RFs but helped to spatiotemporally modulate them around the time of the saccade (“shifting receptive fields”). However, because of the presumed rarity of ipsilaterally tuned visual and presaccadic information arriving at the FEF, it seems reasonable to speculate that SC input arriving through the crossed pathway may have a more causal role in governing the RF structure of recipient FEF neurons.
Our data suggest that signals from the opposite SC cross at the level of the diencephalon via the massa intermedia (Olszewski, 1952). The crossed projection would involve an MD neuron that sends its axon directly to the opposite FEF, providing a conduit for ipsilateral information and the means for generating a full-field representation in a single FEF. This interpretation is consistent with anatomical reports of crossed thalamo-frontal cortical projections (Preuss and Goldman-Rakic, 1987).
Other sources of ipsilateral information may be present. A pioneering study showed that some ipsilateral information potentially arrives from the opposite FEF (Schlag et al., 1998). One possibility is that information from different sources subserves different functions. Interestingly, much of the ipsilateral information from the opposite FEF is accompanied by inhibition of the recipient neurons (Schlag et al., 1998). The function of this information may be to silence saccadic plans that would interfere with unity of purpose. In contrast, it appears that ipsilateral information from the opposite SC is accompanied by excitation of the recipient neurons. This provides a potential means of creating ipsilateral RFs.
The crossed projections also may provide an alternate route of interhemispheric communication. A host of lesion studies implicate subcortical structures as potential sources of information that may provide for recovery of function in event of cerebral damage (Poppel et al., 1973; Boire et al., 2001; Herter and Guitton, 2004). It is well known that many V1-lesioned or cerebral hemispherectomy patients exhibit remarkably persistent visuomotor capabilities (i.e., blind sight). Our data demonstrate that information about the contralesional hemifield is available to cerebral cortex from the opposite SC via crossed projections. Visuomotor signals that may mediate blind sight could reach and influence intact cortical areas through this route.
Structure–function relationship in the SC–FEF circuit
We found that the RF laterality of FEF neurons connected with a single SC was mostly predicted by the laterality of that SC. It is possible that we could have found a finer-scale relationship between direction tuning in the FEF and spatial location of stimulation in the SC. Direction tuning within a hemifield is likely correlated with electrode placement along the mediolateral dimension of the SC, just as amplitude tuning of SC-recipient FEF neurons is correlated with electrode placement in the rostrocaudal dimension of the SC (Sommer and Wurtz, 2004a). As predicted by our stimulation electrode placements on the horizontal meridian of the SC, our FEF neurons showed average direction tunings that were close to horizontal (Fig. 4A, left and right). We did not systematically vary stimulation along the mediolateral dimension of the SC because the experiment was technically daunting already, requiring stimulation within both SCs plus recording in the FEF.
Similar isomorphic mappings between RF lateralities and anatomical inputs exist elsewhere in the primate brain. Most primary sensory and motor centers, for example, exhibit topographically preserved signaling (Canedo, 1997; Smith, 2000). Moreover, physiologically confirmed instances of structure–function relationships have been identified within the brainstem (Gandhi and Keller, 1997), between cortical and subcortical structures (Schlag-Rey et al., 1992; Hoffmann et al., 2002; Nambu et al., 2002), and within the cortical network itself (Movshon and Newsome, 1996; Schlag et al., 1998). The common finding of these studies is that the functionality of projection and recipient neurons is often highly correlated, and most parsimoniously explained by mutual connectivity.
We think the present results qualify as an additional example of a structure–function relationship. The SC–FEF pathway seems to mediate a “motor-to-sensory” rather than “sensory-to-motor” transformation that conveys corollary discharge (CD) from midbrain to cortex (Sommer and Wurtz, 2008). A major implication of our results is to demonstrate for the first time that feedback from motor to sensory networks in the primate brain feature just as much structural organization in the mediation of functional purpose as feedforward pathways from sensory to motor networks. Clear topographical organization of CD transmission was predicted in the classic literature (Holst and Mittelstaedt, 1950; Sperry, 1950), and had been identified in other animals (Poulet and Hedwig, 2006; Crapse and Sommer, 2008), but had not been demonstrated previously in primates.
Special case of bilateral SC input
The structure–function relationship that we found for ConSC-only and IpsSC-only neurons was more complicated for BothSC neurons, those identified as receiving bilateral SC input. We expected that these neurons would feature RFs that were bilateral. We found instead that the RFs of BothSC neurons were lateralized and could point in any direction. Compared with the RF of neurons with unilateral SC input, the RFs of the BothSC neurons were broader, and the visuomovement class of BothSC neurons had visual and movement fields that were more misaligned. These two characteristics, greater breadth and relative misalignment, might not provide the BothSC neurons with any functional advantage. More likely, they are residual consequences of the FEF neuron having to process conflicting signals arriving from the two SCs. Analyses of the relationship between the weighting of SC inputs and the RF laterality of FEF neurons uncovered no correlations. Hence we found no discernable principle governing the RF directionality of the BothSC neurons. We speculate that the RF structure of BothSC neurons is established during development through a gain mechanism that acts on the two SC inputs to determine the overall laterality of the RFs, as well as breadth and visual-movement field alignment.
There seemed to be a categorical difference, therefore, between the BothSC neurons (RF laterality unrelated to SC input laterality) and the ConSC-only and IpsSC-only neurons (RF laterality predicted by SC input laterality). Additional evidence for a categorical difference was the broader RF tuning of BothSC neurons and the relative misalignment of the visual and movement fields. These categorical differences have an important implication for interpreting our stimulation results. One could argue that our ConSC-only and IpsSC-only terminology, although objective as a description of our ability to drive the neurons from a single SC, may be unreliable as a description of the true balance of SC inputs. The apparently unilaterally driven neurons may have actually received a weak input from the other SC that we failed to detect because of inadequate stimulating electrode placement or current level. We think that the categorical differences between unilaterally activated neurons and known bilaterally connected (BothSC) neurons undermine this objection.
Furthermore, neurophysiological evidence in the literature supports the idea that ConSC-only and IpsSC-only FEF neurons receive input from only one SC. The evidence was documented in the study by Sommer and Wurtz (2004a), their Figure 9. Without getting into the technical details, the take-home message was that, if an FEF neuron is activated orthodromically from one place on the SC map, it can be activated from elsewhere on the map (although perhaps with a different current requirement). Hence the yes-or-no question of whether an FEF neuron can be orthodromically activated from an SC should depend little on stimulation location within that SC. This is likely because the activated elements, initial segments of thalamic-projecting SC neurons, are highly sensitive. Therefore, when we orthodromically activated an FEF neuron from one SC but not the other SC, the lack of activation from the other SC was probably not attributable to suboptimal stimulating electrode placement. We tried up to 1.5 mA, and if a connection had been present, we feel that we would have found it. Lack of activation may truly represent a lack of connection in this particular situation.
In sum, the results illustrate a means by which each FEF receives information about the entire visual field and all saccades. We think these findings supply an important piece of the puzzle for modeling how the FEF and interrelated regions perform perisaccadic omnidirectional functions such as shifting RFs and vector subtraction.
Footnotes
This work was supported by National Institutes of Health Grant EY017592 and the Alfred P. Sloan Foundation (M.A.S.). We thank Robert H. Wurtz for advice and support, and our colleagues at the University of Pittsburgh and the Center for the Neural Basis of Cognition for their helpful comments on this manuscript.
References
- Batschelet E. Circular statistics in biology. London: Academic; 1981. [Google Scholar]
- Berman RA, Heiser LM, Saunders RC, Colby CL. Dynamic circuitry for updating spatial representations. I. Behavioral evidence for interhemispheric transfer in the split-brain macaque. J Neurophysiol. 2005;94:3228–3248. doi: 10.1152/jn.00028.2005. [DOI] [PubMed] [Google Scholar]
- Berman RA, Heiser LM, Dunn CA, Saunders RC, Colby CL. Dynamic circuitry for updating spatial representations. III. From neurons to behavior. J Neurophysiol. 2007;98:105–121. doi: 10.1152/jn.00330.2007. [DOI] [PMC free article] [PubMed] [Google Scholar]
- Boire D, Théoret H, Ptito M. Visual pathways following cerebral hemispherectomy. Prog Brain Res. 2001;134:379–397. doi: 10.1016/s0079-6123(01)34025-6. [DOI] [PubMed] [Google Scholar]
- Bruce CJ, Goldberg ME. Primate frontal eye fields. I. Single neurons discharging before saccades. J Neurophysiol. 1985;53:603–635. doi: 10.1152/jn.1985.53.3.603. [DOI] [PubMed] [Google Scholar]
- Bruce CJ, Goldberg ME, Bushnell MC, Stanton GB. Primate frontal eye fields. II. Physiological and anatomical correlates of electrically evoked eye movements. J Neurophysiol. 1985;54:714–734. doi: 10.1152/jn.1985.54.3.714. [DOI] [PubMed] [Google Scholar]
- Canedo A. Primary motor cortex influences on the descending and ascending systems. Prog Neurobiol. 1997;51:287–335. doi: 10.1016/s0301-0082(96)00058-5. [DOI] [PubMed] [Google Scholar]
- Colby CL, Berman RA, Heiser LM, Saunders RC. Corollary discharge and spatial updating: when the brain is split, is space still unified? Prog Brain Res. 2005;149:187–205. doi: 10.1016/S0079-6123(05)49014-7. [DOI] [PubMed] [Google Scholar]
- Crapse TB, Sommer MA. Corollary discharge across the animal kingdom. Nat Rev Neurosci. 2008;9:587–600. doi: 10.1038/nrn2457. [DOI] [PMC free article] [PubMed] [Google Scholar]
- Douglas RJ, Martin KA. Neuronal circuits of the neocortex. Annu Rev Neurosci. 2004;27:419–451. doi: 10.1146/annurev.neuro.27.070203.144152. [DOI] [PubMed] [Google Scholar]
- Felleman DJ, Van Essen DC. Distributed hierarchical processing in the primate cerebral cortex. Cereb Cortex. 1991;1:1–47. doi: 10.1093/cercor/1.1.1-a. [DOI] [PubMed] [Google Scholar]
- Fries W. Cortical projections to the superior colliculus in the macaque monkey: a retrograde study using horseradish peroxidase. J Comp Neurol. 1984;230:55–76. doi: 10.1002/cne.902300106. [DOI] [PubMed] [Google Scholar]
- Gandhi NJ, Keller EL. Spatial distribution and discharge characteristics of superior colliculus neurons antidromically activated from the omnipause region in monkey. J Neurophysiol. 1997;78:2221–2225. doi: 10.1152/jn.1997.78.4.2221. [DOI] [PubMed] [Google Scholar]
- Giguere M, Goldman-Rakic PS. Mediodorsal nucleus: areal, laminar, and tangential distribution of afferents and efferents in the frontal lobe of rhesus monkeys. J Comp Neurol. 1988;277:195–213. doi: 10.1002/cne.902770204. [DOI] [PubMed] [Google Scholar]
- Goldberg ME, Bruce CJ. Primate frontal eye fields. III. Maintenance of a spatially accurate saccade signal. J Neurophysiol. 1990;64:489–508. doi: 10.1152/jn.1990.64.2.489. [DOI] [PubMed] [Google Scholar]
- Gould HJ, 3rd, Cusick CG, Pons TP, Kaas JH. The relationship of corpus callosum connections to electrical stimulation maps of motor, supplementary motor, and the frontal eye fields in owl monkeys. J Comp Neurol. 1986;247:297–325. doi: 10.1002/cne.902470303. [DOI] [PubMed] [Google Scholar]
- Heiser LM, Berman RA, Saunders RC, Colby CL. Dynamic circuitry for updating spatial representations. II. Physiological evidence for interhemispheric transfer in area LIP of the split-brain macaque. J Neurophysiol. 2005;94:3249–3258. doi: 10.1152/jn.00029.2005. [DOI] [PubMed] [Google Scholar]
- Herter TM, Guitton D. Accurate bidirectional saccade control by a single hemicortex. Brain. 2004;127:1393–1402. doi: 10.1093/brain/awh158. [DOI] [PubMed] [Google Scholar]
- Hikosaka O, Wurtz RH. Visual and oculomotor functions of monkey substantia nigra pars reticulata. III. Memory-contingent visual and saccade responses. J Neurophysiol. 1983;49:1268–1284. doi: 10.1152/jn.1983.49.5.1268. [DOI] [PubMed] [Google Scholar]
- Hoffmann KP, Bremmer F, Thiele A, Distler C. Directional asymmetry of neurons in cortical areas MT and MST projecting to the NOT-DTN in macaques. J Neurophysiol. 2002;87:2113–2123. doi: 10.1152/jn.00488.2001. [DOI] [PubMed] [Google Scholar]
- Holst EV, Mittelstaedt H. The reafference principle. Naturwissenschaften. 1950;37:464–467. [Google Scholar]
- Izawa Y, Suzuki H, Shinoda Y. Suppression of visually and memory-guided saccades induced by electrical stimulation of the monkey frontal eye field. I. Suppression of ipsilateral saccades. J Neurophysiol. 2004;92:2248–2260. doi: 10.1152/jn.01021.2003. [DOI] [PubMed] [Google Scholar]
- Lamantia AS, Rakic P. Cytological and quantitative characteristics of four cerebral commissures in the rhesus monkey. J Comp Neurol. 1990;291:520–537. doi: 10.1002/cne.902910404. [DOI] [PubMed] [Google Scholar]
- Lynch JC, Hoover JE, Strick PL. Input to the primate frontal eye field from the substantia nigra, superior colliculus, and dentate nucleus demonstrated by transneuronal transport. Exp Brain Res. 1994;100:181–186. doi: 10.1007/BF00227293. [DOI] [PubMed] [Google Scholar]
- Mays LE, Sparks DL. Dissociation of visual and saccade-related responses in superior colliculus neurons. J Neurophysiol. 1980;43:207–232. doi: 10.1152/jn.1980.43.1.207. [DOI] [PubMed] [Google Scholar]
- Movshon JA, Newsome WT. Visual response properties of striate cortical neurons projecting to area MT in macaque monkeys. J Neurosci. 1996;16:7733–7741. doi: 10.1523/JNEUROSCI.16-23-07733.1996. [DOI] [PMC free article] [PubMed] [Google Scholar]
- Nambu A, Kaneda K, Tokuno H, Takada M. Organization of corticostriatal motor inputs in monkey putamen. J Neurophysiol. 2002;88:1830–1842. doi: 10.1152/jn.2002.88.4.1830. [DOI] [PubMed] [Google Scholar]
- Olszewski J. The thalamus of the Macaca mulatta. Basel: Karger; 1952. [Google Scholar]
- Pandya DN, Vignolo LA. Intra- and interhemispheric projections of the precentral, premotor and arcuate areas in the rhesus monkey. Brain Res. 1971;26:217–233. [PubMed] [Google Scholar]
- Poppel E, Held R, Frost D. Leter: residual visual function after brain wounds involving the central visual pathways in man. Nature. 1973;243:295–296. doi: 10.1038/243295a0. [DOI] [PubMed] [Google Scholar]
- Poulet JF, Hedwig B. The cellular basis of a corollary discharge. Science. 2006;311:518–522. doi: 10.1126/science.1120847. [DOI] [PubMed] [Google Scholar]
- Preuss TM, Goldman-Rakic PS. Crossed corticothalamic and thalamocortical connections of macaque prefrontal cortex. J Comp Neurol. 1987;257:269–281. doi: 10.1002/cne.902570211. [DOI] [PubMed] [Google Scholar]
- Robinson DA. Eye movements evoked by collicular stimulation in the alert monkey. Vision Res. 1972;12:1795–1808. doi: 10.1016/0042-6989(72)90070-3. [DOI] [PubMed] [Google Scholar]
- Schall JD, Hanes DP, Thompson KG, King DJ. Saccade target selection in frontal eye field of macaque. I. Visual and premovement activation. J Neurosci. 1995;15:6905–6918. doi: 10.1523/JNEUROSCI.15-10-06905.1995. [DOI] [PMC free article] [PubMed] [Google Scholar]
- Schiller PH, Koerner F. Discharge characteristics of single units in superior colliculus of the alert rhesus monkey. J Neurophysiol. 1971;34:920–936. doi: 10.1152/jn.1971.34.5.920. [DOI] [PubMed] [Google Scholar]
- Schlag J, Dassonville P, Schlag-Rey M. Interaction of the two frontal eye fields before saccade onset. J Neurophysiol. 1998;79:64–72. doi: 10.1152/jn.1998.79.1.64. [DOI] [PubMed] [Google Scholar]
- Schlag-Rey M, Schlag J, Dassonville P. How the frontal eye field can impose a saccade goal on superior colliculus neurons. J Neurophysiol. 1992;67:1003–1005. doi: 10.1152/jn.1992.67.4.1003. [DOI] [PubMed] [Google Scholar]
- Seidemann E, Arieli A, Grinvald A, Slovin H. Dynamics of depolarization and hyperpolarization in the frontal cortex and saccade goal. Science. 2002;295:862–865. doi: 10.1126/science.1066641. [DOI] [PubMed] [Google Scholar]
- Sherman SM, Guillery RW. On the actions that one nerve cell can have on another: distinguishing “drivers” from “modulators.”. Proc Natl Acad Sci U S A. 1998;95:7121–7126. doi: 10.1073/pnas.95.12.7121. [DOI] [PMC free article] [PubMed] [Google Scholar]
- Smith CUM. Biology of sensory systems. New York: Wiley; 2000. [Google Scholar]
- Sommer MA, Wurtz RH. Frontal eye field neurons orthodromically activated from the superior colliculus. J Neurophysiol. 1998;80:3331–3335. doi: 10.1152/jn.1998.80.6.3331. [DOI] [PubMed] [Google Scholar]
- Sommer MA, Wurtz RH. Composition and topographic organization of signals sent from the frontal eye field to the superior colliculus. J Neurophysiol. 2000;83:1979–2001. doi: 10.1152/jn.2000.83.4.1979. [DOI] [PubMed] [Google Scholar]
- Sommer MA, Wurtz RH. A pathway in primate brain for internal monitoring of movements. Science. 2002;296:1480–1482. doi: 10.1126/science.1069590. [DOI] [PubMed] [Google Scholar]
- Sommer MA, Wurtz RH. What the brain stem tells the frontal cortex. I. Oculomotor signals sent from superior colliculus to frontal eye field via mediodorsal thalamus. J Neurophysiol. 2004a;91:1381–1402. doi: 10.1152/jn.00738.2003. [DOI] [PubMed] [Google Scholar]
- Sommer MA, Wurtz RH. What the brain stem tells the frontal cortex. II. Role of the SC-MD-FEF pathway in corollary discharge. J Neurophysiol. 2004b;91:1403–1423. doi: 10.1152/jn.00740.2003. [DOI] [PubMed] [Google Scholar]
- Sommer MA, Wurtz RH. Influence of the thalamus on spatial visual processing in frontal cortex. Nature. 2006;444:374–377. doi: 10.1038/nature05279. [DOI] [PubMed] [Google Scholar]
- Sommer MA, Wurtz RH. Brain circuits for the internal monitoring of movements. Annu Rev Neurosci. 2008;31:317–338. doi: 10.1146/annurev.neuro.31.060407.125627. [DOI] [PMC free article] [PubMed] [Google Scholar]
- Sperry R. Neural basis of the spontaneous optokinetic response produced by visual inversion. J Comp Physiol Psychol. 1950;43:482–489. doi: 10.1037/h0055479. [DOI] [PubMed] [Google Scholar]
- Stanton GB, Goldberg ME, Bruce CJ. Frontal eye field efferents in the macaque monkey: II. Topography of terminal fields in midbrain and pons. J Comp Neurol. 1988;271:493–506. doi: 10.1002/cne.902710403. [DOI] [PubMed] [Google Scholar]
- Swadlow HA, Rosene DL, Waxman SG. Characteristics of interhemispheric impulse conduction between prelunate gyri of the rhesus monkey. Exp Brain Res. 1978;33:455–467. doi: 10.1007/BF00235567. [DOI] [PubMed] [Google Scholar]
- Takahashi M, Sugiuchi Y, Shinoda Y. Commissural mirror-symmetric excitation and reciprocal inhibition between the two superior colliculi and their roles in vertical and horizontal eye movements. J Neurophysiol. 2007;98:2664–2682. doi: 10.1152/jn.00696.2007. [DOI] [PubMed] [Google Scholar]
- Tehovnik EJ, Sommer MA, Chou IH, Slocum WM, Schiller PH. Eye fields in the frontal lobes of primates. Brain Res Brain Res Rev. 2000;32:413–448. doi: 10.1016/s0165-0173(99)00092-2. [DOI] [PubMed] [Google Scholar]
- Tian J, Schlag J, Schlag-Rey M. Testing quasi-visual neurons in the monkey's frontal eye field with the triple-step paradigm. Exp Brain Res. 2000;130:433–440. doi: 10.1007/s002219900282. [DOI] [PubMed] [Google Scholar]
- Umeno MM, Goldberg ME. Spatial processing in the monkey frontal eye field. I. Predictive visual responses. J Neurophysiol. 1997;78:1373–1383. doi: 10.1152/jn.1997.78.3.1373. [DOI] [PubMed] [Google Scholar]
- Umeno MM, Goldberg ME. Spatial processing in the monkey frontal eye field. II. Memory responses. J Neurophysiol. 2001;86:2344–2352. doi: 10.1152/jn.2001.86.5.2344. [DOI] [PubMed] [Google Scholar]
- Wurtz RH, Goldberg ME. Activity of superior colliculus in behaving monkey. III. Cells discharging before eye movements. J Neurophysiol. 1972;35:575–586. doi: 10.1152/jn.1972.35.4.575. [DOI] [PubMed] [Google Scholar]