Abstract
Phylogenetic analyses of the family Trypanosomatidae have been conducted using both 18S rRNA gene sequences and a variety of protein sequences. Using a variety of phylogenetic methods, 18S rRNA phylogenies indicate that the genus Trypanosoma is not monophyletic. Rather, they suggest that the American and African trypanosomes constitute distinct clades. By contrast, phylogenetic analyses of available sequences in 42 protein families gene generally supported monophyly of the genus Trypanosoma. One possible explanation for these conflicting results is poor taxon sampling in the case of protein coding genes, most of which have been sequenced for only a few species of Trypanosomatidae.
Introduction
The family Trypanosomatidae (Euglenozoa: Kinetoplastida) includes several of the most serious vector-borne protist parasites of humans, numerous species parasitic on non-human vertebrates, and numerous parasites of insects, other invertebrates, and plants. The major human parasites include a number of species in the genera Leishmania and Trypanosoma. In Trypanosoma, the two major human parasites are T. cruzi, the causative agent of Chagas' disease, and T. brucei, the causative agent of African sleeping sickness. T. cruzi belongs to a major grouping within the genus Trypanosoma known as the American trypanosomes (or Stercoraria), while T. brucei belongs to another major grouping known as the African trypanosomes (or Salivaria).
As with most other single celled organisms, evolutionary relationships within Trypanosomatidae were very poorly known prior to the availability of molecular data because there are few morphological characters documenting relationships within this family. The advent of molecular sequence data provided many additional characters for phylogenetic analysis, but so far evolutionary relationships within the family remain poorly resolved even by molecular data [1-7]. Here we briefly review some of the major results of previous molecular phylogenetic analyses of Trypanosomatidae and present new analyses based on 42 protein families. In particular, we address the issue of the relationship between American and African trypanosomes and whether or not the genus Trypanosoma, as currently recognized, represents a clade or monophyletic group (i.e., whether Trypanosoma includes all the descendants of a single ancestral species and only the descendants of that ancestral species).
This question is of more than theoretical interest because Trypanosoma includes both African and American trypanosome parasites of humans. If these species are not closely related, it may have important implications for our understanding of these species' basic biology. This in turn may have implications for the development of potential new strategies of prophylaxis and treatment. We will show that phylogenies based on 18S ribosomal RNA (18S rRNA) genes have provided an answer to this question that appears inconsistent with the results of the majority of phylogenies based on available protein sequences. We then discuss possible explanations for this discrepancy.
18S rRNA Phylogenies
In one of the earliest 18S rRNA phylogenies of trypanosomes, T. brucei clustered outside a group that included T. cruzi, other American trypanosomes, and members of Leishmania and six other genera of Trypanosomatidae [1]. According to this phylogeny, the American and African trypanosomes do not form a monophyletic group. However, sequences from only a relatively small number of species were available at the time of this analysis. In addition, the tree was rooted with sequences from two members of the family Bodonidae, a family of free-living kinetoplastids believed to be closely related to Trypanosomatidae. However, if the family Trypanosomatidae itself is not monophyletic, this rooting might not be valid.
Subsequent studies, including additional 18S rRNA sequences, tended to support the monophyly of the genus Trypanosoma [2-6]. However, most of these phylogenies were also rooted with Bodonidae, thus raising questions regarding the validity of the rooting. However, Wright and colleagues [5] rooted their phylogenetic tree with certain species of Euglenida and stramenopiles (Chrysophyceae and Eustigmatophyceae). Since theses species are unquestioned outgroups to both Trypanosomatidae and Bodonidae, the phylogeny of Wright et al. [5] provided the strongest support yet for monophyly of Trypanosoma. However, this phylogeny included only a small number of species.
In addition to the question of the relationship between American and African trypanosomes, 18S rRNA phylogenies of Trypanosomatidae have addressed the question of the phylogenetic relationships of Trypanosoma vivax. T. vivax was isolated from a cow in Africa, but its 18S rRNA sequence is divergent from those of other African trypanosomes [8]. In certain phylogenetic analyses, T. vivax has clustered with other African trypanosomes [6]; however, Haag and colleagues [3] excluded it from their analysis because they believed that its 18S rRNA gene has evolved more rapidly than those of other Trypanosoma. Stevens and Rambaut [8] presented evidence of a high rate of evolution in the 18S rRNA gene of T. vivax by comparisons with an outgroup. However, the outgroup these authors used consisted of members of the genera Crithidia, Endotrypanum, and Leishmania, all of which belong to the family Trypanosomatidae. If the genus Trypanosoma does not constitute a monophyletic group, this is not a valid outgroup, since some Trypanosoma may be closer to these three genera than are others.
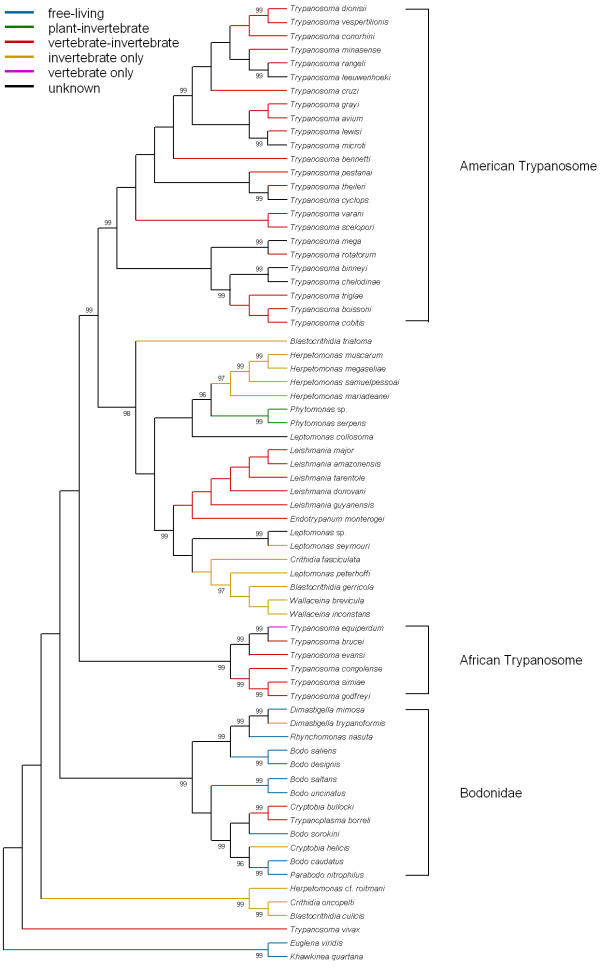
Hughes and Piontkivska [7] conducted the most extensive analysis to date of 18S rRNA sequences from Trypanosomatidae and Bodonidae; and they applied several different phylogenetic methods. The phylogenetic trees were rooted with species of Euglenida, which constitute an appropriate outgroup. Although details of the phylogenetic trees differed depending on the methods used, none of the phylogenies supported monophyly of the genus Trypanosoma. Support for paraphyly of Trypanosoma was strongest in the case of the tree reconstructed by the minimum evolution (ME) method [9], illustrated in Figure 1. In this tree, the African trypanosomes fell outside a clade including the American trypanosomes, along with members of Leishmania and seven other genera (Figure 1). The statistical support for the branch establishing this pattern was highly significant (Figure 1).
Figure 1.
Minimum evolution (ME) tree of 18S rRNA sequences from Trypanosomatidae and Bodonidae based on the Tamura-Nei [20] distance at 1431 aligned nucleotide sites. Numbers on the branches are significance levels of the standard error test of the branch lengths; only values ≥ to 95% are shown.
In the same tree, T. vivax clustered apart from the other African trypanosomes and indeed outside all other Trypanosomatidae and Bodonidae (Figure 1). However, statistical support for this pattern was weak (Figure 1). The phylogenetic tree also did not support monophyly of the genus Leptomonas (Trypanosomatidae) and did not support monophyly of several genera in Bodonidae (Figure 1).
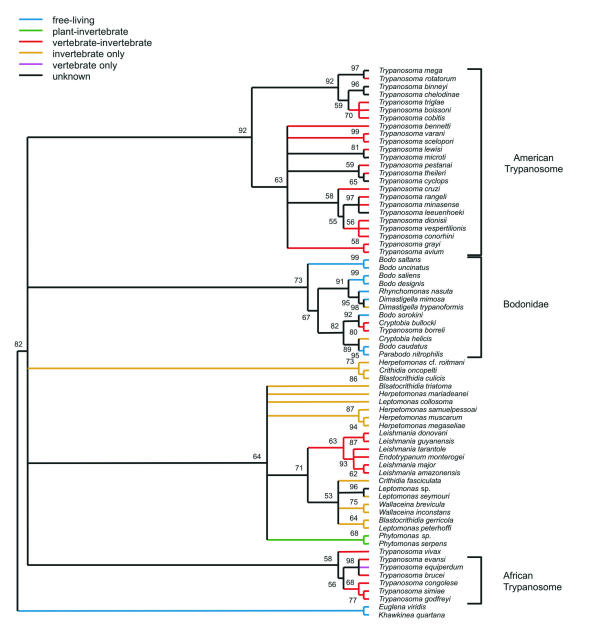
Figure 2 shows a phylogeny of the same 18S rRNA sequences reconstructed by the quartet maximum likelihood (QML) method [10]. In this case, the deeper branches of the phylogeny were largely unresolved. T. vivax clustered with the African trypanosomes, but the American and African trypanosomes did not cluster together (Figure 2). Thus, the QML analysis also did not support monophyly of the genus Trypanosoma. As in the ME tree, monophyly of Herpetomonas was not supported in the QML analysis (Figure 2). Similarly, maximum parsimony (MP) [11] and Bayesian [12] analysis did not support monophyly of Trypanosoma or Herpetomonas [7].
Figure 2.
Quartet maximum likelihood (QML) tree of 18S rRNA sequences from Trypanosomatidae and Bodonidae, constructed using the Tamura-Nei model. Numbers on the branches represent the percentage of puzzling steps supporting the branch.
The 18S rRNA phylogeny suggests that the evolution of host specificity in Trypanosomatidae has been complex. It seems a plausible hypothesis that the ancestors of kinetoplastids were free-living. Subsequently, it seems plausible that parasitism on invertebrates evolved, followed by more complex life cycles involving both an invertebrate host and either a vertebrate or a plant host. However, the phylogenies (Figures 1 and 2) suggest that life cycles involving a vertebrate host have evolved more than once independently. The ME tree strongly supports (with statistically significant internal branches) the hypothesis that a life cycle involving a vertebrate host may have evolved independently in the American trypanosomes, and in the African trypanosomes (Figure 1).
Protein Phylogenies
Phylogenetic studies of Trypanosomatidae using the sequences of protein-coding genes or their predicted amino acid sequences have been comparatively few. Alvarez and colleagues [13] published phylogenies of four protein-coding genes: ATPase subunit 6, α tubulin, glyceraldehyde-3-phosphate dehydrogenase, and trypanothione reductase. Three of these phylogenies could not address the question of monophyly of Trypanosoma because no outgroup outside the Trypanosomatidae was used to root the tree. The α tubulin phylogeny was rooted with a sequence from Euglena gracilis [13]. This phylogeny supported monophyly of Trypanosoma, in that T. cruzi clustered with T. brucei and apart from one sequence from the genus Leishmania [13]. Phylogenetic analyses of heat shock protein 90 (HSP90) by Simpson and colleagues [14] likewise supported monophyly of Trypanosoma, in that sequences from T. brucei and T. cruzi clustered together and apart from sequences of two Leishmania species. Interestingly, these analyses did not support monophyly of Bodonidae [14].
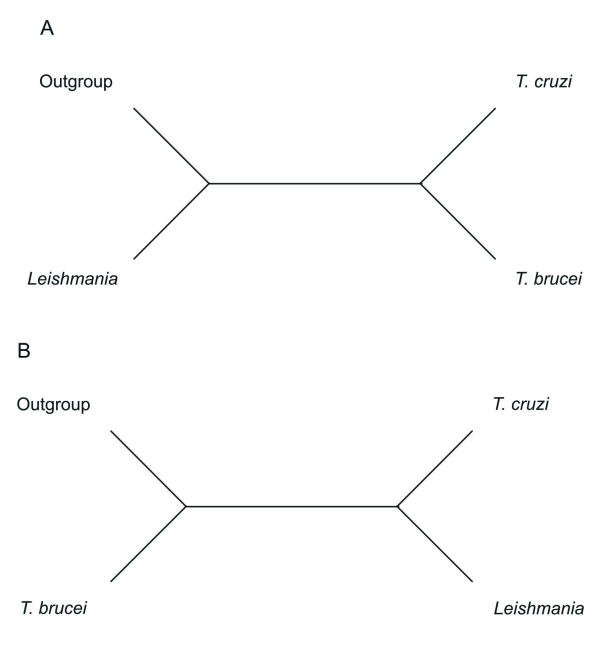
Because relatively few amino acid sequences for Trypanosomatidae are available at the present time, use of these sequences to address the question of monophyly of Trypanosoma reduces in many cases to a choice between the two topologies illustrated in Figure 3. As in previous studies [13,14], monophyly of Trypanosoma is supported when T. cruzi and T. brucei cluster together (Figure 3A). The most frequently observed alternative topology is one where T. cruzi clusters with Leishmania (Figure 3B). The latter topology corresponds to that seen in the ME tree of 18S rRNA genes (Figure 1).
Figure 3.
Alternative topologies of trees including an American trypanosome (T. cruzi), and African trypanosome (T. brucei or a closely related species), one or more species of the genus Leishmania, and an outgroup used to root the tree. In (A) monophyly of Trypanosoma is supported, whereas in (B) it is not supported.
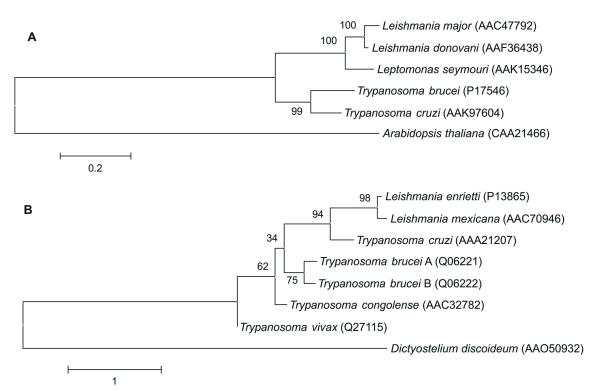
In Table 1, we summarize the results of phylogenetic analyses of 42 protein families using three different methods. Further details of these analyses, including accession numbers and alignments, are provided in supplemental text [see additional file 1 "supplement.txt']. Contrary to the results of 18S rRNA analyses [7], the majority of these analyses supported monophyly of Trypanosoma (Table 1). In 29 families (69%), all three methods supported monophyly of Trypanosoma; i.e., a topology like that of Figure 3A (Table 1). Furthermore, in 16 of these families, support for this topology was statistically significant (at the 95% level) by all three methods (Table 1). An example (the DNA-directed RNA polymerase II, large subunit family) of a topology of this form that received highly significant support is shown in Figure 4a.
Table 1.
Support for monophyly of the genus Trypanosoma in protein phylogenies constructed by three different methods.
| Family | Aligned sites | Trypanosoma species 1 | ME 2 | MP | QML |
| Actin | 375 | Tb, Tcr | yes (A,71) 3 | yes (A,71) | yes (A,100) |
| Adenylate cyclase | 1142 | Tb,Tcr | yes (A, 63) | yes (A, 94) | no |
| ATPase, subunit 6 | 225 | Tb,Tcr | no (B,37) | yes (A, 92) | no |
| α tubulin | 451 | Tb,Tcr | yes (A,99) | yes (A,99) | yes (A,100) |
| β tubulin | 442 | Tb,Tcr | yes (A,98) | yes (A,96) | yes (A,100) |
| Calreticulin | 393 | Tco,Tcr | yes (A,95) | yes (A,97) | yes (A,100) |
| Cdc2-related kinase 3 | 290 | Tb,Tcr | yes (A,97) | yes (A,68) | yes (A,99) |
| CDKRS | 73 | Tb,Tcr | yes (A,96) | yes (A,72) | yes (A,100) |
| CRK1 | 289 | Tb,Tco,Tcr | yes (A,100) | yes (A,99) | yes (A,98) |
| Cyclophilin A | 164 | Tb,Tco,Tcr, Tvi | no (B,34) | no (B,49) | no |
| Cysteine proteinase | 223 | Tb,Tco,Tcr,Tr | yes (A,98) | yes (A,98) | yes (A,98) |
| Cytochrome b | 171 | Tb,Tcr | no | no (B,60) | no |
| Cytochrome-c oxidase II | 198 | Tb,Tcr | no (B,66) | no (B,35) | no (B,87) |
| DHFR-TS | 455 | Tb,Tcr,Tve | no (B,49) | no (B,65) | yes (A,100) |
| DNA-directed RNA polymerase II, large subunit | 1599 | Tb,Tcr | yes (A,99) | yes (A,100) | yes (A,100) |
| DNA topoisomerease II | 1171 | Tb,Tcr | yes (A,100) | yes (A,100) | yes (A,100) |
| EFH5 | 147 | Tb,Tcr | yes (A,78) | yes (A,67) | no |
| EF-1a | 444 | Tb,Tcr | yes (A,99) | yes (A,93) | yes (A,100) |
| GAPDH | 337 | Tb,Tcr,Tev, Tr,Tvi | yes (A,98) | yes (A,94) | yes (A,100) |
| Glucose-6-phosphate isomerase | 550 | Tb,Tcr | yes (A,97) | yes (A,70) | yes (A,100) |
| GRP78 | 624 | Tb,Tco,Tcr | yes (A,98) | yes (A,97) | yes (A,100) |
| HEXBP | 161 | Teq,Tcr | yes (A,100) | yes (A,100) | yes (A,100) |
| HGPRT | 177 | Tb,Tcr | yes (A,96) | yes (A,60) | yes (A,94) |
| HSP60 | 557 | Tb,Tcr | yes (A,85) | yes (A,96) | yes (A,100) |
| HSP70 | 511 | Tb,Tcr | yes (A,79) | yes (A,50) | yes (A,100) |
| HSP90 | 613 | Tb,Tcr | yes (A,99) | yes (A,100) | yes (A,100) |
| Malate dehydrogenase | 310 | Tb,Tcr | yes (A,64) | yes (A,57) | no |
| MDR-A | 877 | Tb,Tcr | yes (A,99) | yes (A,100) | yes (A,100) |
| MDR-E | 877 | Tb,Tcr | yes (A,100) | yes (A,100) | yes (A,100) |
| Oligopeptidase B | 667 | Tb,Tcr | yes (A,99) | yes (A,100) | yes (A,100) |
| PAR-2 | 328 | Tb,Tcr | yes (A,81) | yes (A,81) | no (B,87) |
| PAR-3 | 328 | Tb,Tcr | yes (A,58) | yes (A,66) | yes (A,51) |
| Periredoxin | 188 | Tb,Tcr | yes (A,90) | yes (A,51) | yes (A,99) |
| Proteasome subunit α-5 | 237 | Tb,Tcr | yes (A100) | yes (A,99) | yes (A,100) |
| Protein kinase A reg. subunit | 372 | Tb,Tcr | yes (A,97) | yes (A,99) | yes (A,100) |
| Pteridine reductase | 238 | Tb,Tcr | yes (A,94) | yes (A,55) | yes (A,100) |
| P-type H+-ATPase | 832 | Tb,Tcr | yes (A,76) | no (B,53) | no (B,91) |
| Ribosomal protein P0 | 312 | Tb,Tcr | yes (A,97) | yes (A,97) | yes (A,100) |
| S-adenosyl methionine decarboxylase | 324 | Tb,Tcr | yes (A,63) | no (B,68) | yes (A,72) |
| THT | 432 | Tb,Tco,Tcr, Tvi | no (B,94) | no (B,86) | no (B,96) |
| TPIS | 247 | Tb,Tcr | yes (A,98) | yes (A,95) | yes (A,92) |
| Trypanothione reductase | 407 | Tb, Tco, Tcr, Tve | yes (A,100) | no (B,100) | yes (A,100) |
1 Species abbreviations: Tb = Trypanosoma brucei; Tco = T. congolense; Tcr = T. cruzi; Teq = T. equiperdum; Tev = T. evansi; Tr = T. rangeli; Tve = T. vespertilionis; Tvi = T. vivax. 2 Phylogenetic methods: ME = minimum evolution [9]; MP = maximum parsimony [11]; QML = quartet maximum likelihood [10]. ME trees were constructed using the gamma-corrected amino acid distance [15], and the parameter of the gamma distribution was estimated by the TREEPUZZLE program [10]. QML trees were constructed assuming the JTT model of amino acid evolution [21] and that rates varied among sites following a gamma distribution. Amino acid sequences were aligned using the CLUSTALW program [22]. 3 Table entries indicate whether tree supported ("yes") or did not support ("no") monophyly of Trypanosoma. "A" and "B" refer to the alternative topologies illustrated in Figure 3. The numbers indicate the confidence level for the interior branch in the trees. For ME and MP, support is the percentage of 1000 bootstrap pseudo-samples supporting the interior branch. For QML, support is the percent of puzzling steps supporting the interior branch.
Figure 4.
ME trees for two protein families: (A) DNA-directed RNA polymerase II, large subunit, which supports monophyly of Trypanosoma; and (B) THT, which does not support monophyly of Trypanosoma. Numbers on the branches represent the percentage of 1000 bootstrap pseudo-samples supporting the branch.
In only four families, monophyly of Trypanosoma was not supported by at least one of the three methods (Table 1). An example (the THT family) is shown in Figure 4b. In the phylogenetic trees of the THT family, T. cruzi clustered with Leishmania rather than with T. brucei (Figure 5b). Furthermore, T. vivax clustered outside all other sequences from Trypanosoma and Leishmania. This topology was thus reminiscent of the 18S rRNA ME tree (Figure 1). Interestingly, a T. vivax sequence was available for two of the four families for which monophyly of Trypanosoma was not supported by any method (Table 1).
Figure 5.
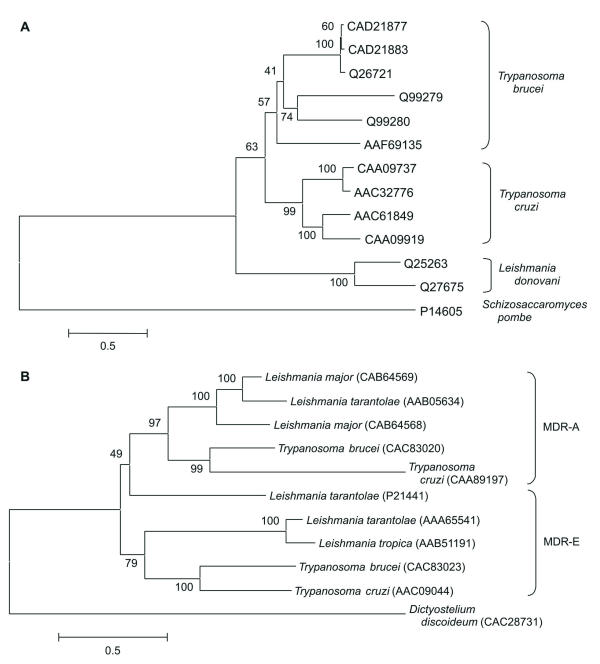
ME trees for (A) adenylate cyclase; and (B) multi-drug resistance proteins (MDR-A and MDR-E). . Numbers on the branches represent the percentage of 1000 bootstrap pseudo-samples supporting the branch.
Some of the protein families analyzed are encoded by multi-gene families in at least some of the species analyzed. In these cases, it was still possible to use these families to address the issue of monophyly of Trypanosoma if the branch order in the phylogeny made clear when the gene duplications occurred relative to speciation events. For example, in the case of S-adenosyl methionine decarboxylase, the phylogeny suggested that multiple gene duplication events occurred after the divergence of the three species of Trypanosomatidae for which sequences were available (Figure 5a). In the case of multi-drug resistance proteins, on the other hand, the phylogeny suggested that there were two separate subfamilies (MDR-A and MDR-E), which arose by a gene duplication prior to speciation within the Trypanosomatidae (Figure 5b). In this case, each subfamily provided separate evidence regarding the relationships among T. cruzi, T. brucei, and Leishmania (Figure 5b). Similarly, the paraflagellar rod components PAR-2 and PAR-3 represented separate subfamilies that arose before speciation of Trypanosomatidae (Table 1).
Discussion
Phylogenetic analyses of 42 protein families generally contradicted the results based on 18S rRNA sequences. Here we briefly discuss some of the considerations that may help lead to a resolution of this contradiction. There are a number of factors that might lead any tree based on a specific gene or protein to produce a phylogeny that is not identical to the phylogeny of the organisms sampled [15]. One such factor is stochastic error; since gene sequences are finite in length, a given gene may by chance yield results contrary to the species tree. In the case of gene families, it is possible that genes that are compared may not truly be orthologous (i.e., descended from an ancestral gene without gene duplication); if paralogous genes are mistaken for orthologous genes, the gene tree is likely to be very different from the species tree. Finally, there may be certain biases inherent in methods of phylogenetic reconstruction.
For example, it is well known that ME and MP methods can be prone to the problem known as "long-branch attraction" (or "short-branch attraction") [15]. This describes a tendency for long branches to cluster together, and likewise for short branches to cluster together. Maximum likelihood (ML) methods (including QML and Bayesian methods) are less prone to long-branch attraction. However, ML methods can be subject to a tendency that might be called "opposite-branch attraction." In opposite-branch attraction, short branches tend to cluster with long branches [15]. In a given data set, if ME and MP yield a topology consistent with long-branch attraction, while ML yields a topology consistent with opposite-branch attraction, it may be impossible to determine which topology is real and which is artifactual.
It might be argued that the phylogenies not supporting monophyly of Trypanosoma are explainable by stochastic error. In support of this interpretation, it might be noted that only a minority of protein families do not support monophyly (Table 1). Furthermore, those protein families that show strongest support for monophyly are often proteins with a large number of residues that are highly conserved because they play important cellular functions. Examples include DNA-directed RNA polymerase II, large subunit (Figure 4a); DNA topoisomerase II; and HSP90 (Table 1). By contrast, the proteins not supporting monophyly include a number that are quite short, such as cyclophilin A and cytochrome b (Table 1). Furthermore, in those families showing topologies inconsistent with monophyly, statistical support for that topology tends to be relatively weak.
On the other hand, it does not appear likely that biases of phylogenetic methods have played a major role in the outcome of either 18S rRNA or protein phylogenies. Different methods agreed in not supporting monophyly of Trypanosoma in the case of 18S rRNA [7]. In the case of protein phylogenies, all three methods used showed agreement in 35 of 42 (83.3%) of families. In the case of the 18S rRNA, comparisons of the pattern of nucleotide substitution between kinetoplast and outgroup sequences showed no striking rate differences among different members of the genus Trypanosoma [7]. This observation suggests that long-branch attraction of African trypanosomes toward the root was probably not a factor in the 18S rRNA phylogeny [7].
For each of the 42 protein families analyzed here, we computed the mean proportion of amino acid difference (p) between (1) T. cruzi and available Leishmania species; and (2) T. brucei and available Leishmania species. The mean p between T. cruzi and Leishmania (0. 297 ± 0.026 S.E.) was slightly lower than that between T. brucei and Leishmania (0. 311 ± 0.025 S.E.); and the difference was statistically significant (paired sample t-test; P = 0.037). However, this observation cannot be used to resolve the phylogenetic issue, since it can be interpreted differently depending on which phylogeny one accepts. If Trypanosoma is monophyletic (Figure 3A), then this result suggests that there is a slightly higher average rate of amino acid evolution in T. brucei than in T. cruzi. On the other hand, if T. cruzi is more closely related to Leishmania than it is to T. brucei (Figure 3B), it would not be unexpected that T. brucei proteins are more divergent from Leishmania proteins than are T. cruzi proteins.
A number of authors have suggested that taxon sampling – the choice of taxa to include in a phylogeny – may have a substantial impact on the results of phylogenetic analyses [16-18]. Some recent computer simulations have suggested that the effects of taxon sampling may not be as large as has been supposed [19], but the random sampling process used in these simulations may not correspond to the biased sampling of taxa that often occurs in actual data sets. Sampling of a diverse array of taxa is expected to improve the accuracy of phylogenetic reconstruction primarily because inclusion of numerous taxa is expected to break up long branches within the tree. Thus, inclusion of numerous can help to minimize the problems of long-branch attraction and of opposite-branch attraction.
In the case of Trypanosomatidae, it seems plausible that taxon sampling may have played a role in causing the different outcomes of 18S rRNA and protein analyses. Of the 29 data sets for which all methods supported monophyly of Trypanosoma, 25 included representatives of only a single American trypanosome species (T. cruzi) and a single African trypanosome species (usually T. brucei) (Table 1). It may be that the results would have been different in many of these families if more taxa had been available.
The role of T. vivax seems particularly important with regard to the issue of taxon sampling. Two of the three families for which T. vivax sequences were available did not support monophyly of Trypanosoma (Table 1). The THT family (Figure 4b) was particularly interesting in this regard. In this family, T. cruzi clustered with Leishmania; and this pattern received strong statistical support with all methods used (Table 1). Also, it is of interest that five of the families for which at least one method did not support monophyly of Trypanosoma included sequences either from Bodonidae (cytochrome b and cytochrome-c oxidase II) or from other genera of Trypanosomatidae besides Trypanosoma and Leishmania (ATPase, subunit 6, DHFR-TS, and trypanothione reductase).
Conclusion
Phylogenetic analyses of 18S rRNA genes from a large number of species and of much smaller data sets for 42 protein families have failed to provide a consistent answer regarding the question of whether or not the genus Trypanosoma is monophyletic. A majority of the protein data sets supported monophyly of Trypanosoma while 18S rRNA and a few proteins did not. One possible explanation for this discrepancy is the poor taxon sampling in most of the protein data sets. An accurate phylogeny of the Trypanosomatidae will require sequencing of protein-coding genes from more species of Trypanosomatidae and from the related family Bodonidae. It will be particularly important to sequence from more genes from Trypanosoma vivax, which seems to be a highly divergent member of this group. Only when a substantial number of taxa have been sampled for a large number of genes will it be possible to resolve the evolutionary relationships of this important group of parasites.
Abbreviations Used
ME = minimum evolution; MP = maximum parsimony; p = proportion of amino acid difference; QML = quartet maximum likelihood; rRNA = ribosomal RNA.
Competing Interests
None declared.
Authors' Contributions
AH wrote the manuscript and conducted computational analyses. HP assisted with the writing and with computational analyses.
Supplemental text
The text file Additional file: 1 includes accession numbers, alignments, and quartet puzzling trees for the 42 families used in protein phylogenies and summarized in Table 1.
Supplementary Material
Supplement
Acknowledgments
Acknowledgments
This research was supported by grant GM34940 from the National Institutes of Health.
Contributor Information
Austin L Hughes, Email: austin@biol.sc.edu.
Helen Piontkivska, Email: elena@biol.sc.edu.
References
- Maslov DA, Lukeš J, Jirku M, Simpson L. Phylogeny of trypanosomes as inferred from the small and large subunit rRNAs: implications for the evolution of parasitism in the trypanosomatid protozoa. Mol Biochem Parasitol. 1996;75:197–205. doi: 10.1016/0166-6851(95)02526-X. [DOI] [PubMed] [Google Scholar]
- Lukeš J, Jirku M, Doležel D, Kral'ová I, Hollar L, Maslov DA. Analysis of ribosomal RNA genes suggests that trypanosomes are monophyletic. J Mol Evol. 1997;44:521–527. doi: 10.1007/pl00006176. [DOI] [PubMed] [Google Scholar]
- Haag J, O'hUigin C, Overath P. The molecular phylogeny of trypanosomes: evidence for an early divergence of the Salivaria. Mol Biochem Parasitol. 1998;91:37–49. doi: 10.1016/S0166-6851(97)00185-0. [DOI] [PubMed] [Google Scholar]
- Stevens J, Noyes AH, Gibson W. The evolution of trypanosomes infecting humans and primates. Mem Inst Oswaldo Cruz. 1998;93:669–676. doi: 10.1590/s0074-02761998000500019. [DOI] [PubMed] [Google Scholar]
- Wright A-DG, Sen L, Feng S, Martin SS, Lynn DH. Phylogenetic position of the kinetoplastids, Cryptobia bullocki, Cryptobia catastomi, and Cryptobia salmositica and monophyly of the genus Trypanosoma inferred from small subunit ribosomal RNA sequences. Mol Biochem Parasitol. 1999;99:69–76. doi: 10.1016/S0166-6851(98)00184-4. [DOI] [PubMed] [Google Scholar]
- Stevens JR, Noyes AH, Schofield CJ. The molecular evolution of Trypanosomatidae. Adv Parasitol. 2001;48:1–56. doi: 10.1016/s0065-308x(01)48003-1. [DOI] [PubMed] [Google Scholar]
- Hughes AL, Piontkivska H. Phylogeny of Trypanosomatidae and Bodonidae (Kinetoplastida) based on 18S rRNA: evidence for paraphyly of Trypanosoma and six other genera. Mol Biol Evol. 2003;20:644–652. doi: 10.1093/molbev/msg062. [DOI] [PubMed] [Google Scholar]
- Stevens J, Rambaut A. Evolutionary rate differences in trypanosomes. Infection, Genetics and Evolution. 2001;1:143–150. doi: 10.1016/S1567-1348(01)00018-1. [DOI] [PubMed] [Google Scholar]
- Rzhetsky A, Nei M. A simple method for estimating and testing minimum evolution trees. Mol Biol Evol. 1992;9:945–967. [Google Scholar]
- Strimmer K, van Haeseler A. Quartet puzzling: a quartet maximum-likelihood method for reconstructing tree topologies. Mol Biol Evol. 1996;13:964–969. [Google Scholar]
- Swofford DL. PAUP*: phylogenetic analysis using parsimony (* and other methods) Sunderland MA: Sinauer; 2002. [Google Scholar]
- Huelsenbeck JP, Ronquist F. MRBAYES: Bayesian inference of phylogenetic trees. Bioinformatics. 2001;17:745–755. doi: 10.1093/bioinformatics/17.8.754. [DOI] [PubMed] [Google Scholar]
- Alvarez F, Cortinas MN, Musto H. The analysis of protein coding genes suggests monpophyly of Trypanosoma. Mol Phyl Evol. 1996;5:333–343. doi: 10.1006/mpev.1996.0028. [DOI] [PubMed] [Google Scholar]
- Simpson AGB, Lukeš J, Roger AJ. The evolutionary history of kinetoplastids and their kinetoplasts. Mol Biol Evol. 2002;19:2071–2083. doi: 10.1093/oxfordjournals.molbev.a004032. [DOI] [PubMed] [Google Scholar]
- Nei M, Kumar S. Molecular evolution and phylogenetics. New York, Oxford University Press; 2000. [Google Scholar]
- Omland KE, Lanyon SM, Fritz SJ. A molecular phylogeny of the New Word orioles (Icterus): the importance of dense taxon sampling. Mol Phyl Evol. 1999;12:224–139. doi: 10.1006/mpev.1999.0611. [DOI] [PubMed] [Google Scholar]
- Van Tuinen M, Sibley CG, Hedges SB. The early history of modern birds inferred from DNA sequences of nuclear and mitochondrial ribosomal genes. Mol Biol Evol. 2000;17:451–457. doi: 10.1093/oxfordjournals.molbev.a026324. [DOI] [PubMed] [Google Scholar]
- Murphy WJ, Eizirik E, Johnson WE, Zhang YP, Ryder OA, O'Brien SJ. Molecular phylogenetics and the origins of placental mammals. Nature. 2001;409:614–618. doi: 10.1038/35054550. [DOI] [PubMed] [Google Scholar]
- Rosenberg MS, Kumar S. Incomplete taxon sampling is not a problem for phylogenetic inference. Proc Natl Acad Sci USA. 2001;98:10751–10758. doi: 10.1073/pnas.191248498. [DOI] [PMC free article] [PubMed] [Google Scholar]
- Tamura K, Nei M. Estimation of the number of nucleotide substitutions in the control region of mitochondrial DNA in humans and chimpanzees. Mol Biol Evol. 1993;10:512–526. doi: 10.1093/oxfordjournals.molbev.a040023. [DOI] [PubMed] [Google Scholar]
- Jones DT, Taylor WR, Thornton JM. The rapid generation of mutation data matrices from protein sequences. Comput Appl Biosc. 1999;8:275–282. doi: 10.1093/bioinformatics/8.3.275. [DOI] [PubMed] [Google Scholar]
- Thompson JD, Higgins DG, Gibson TJ. CLUSTAL W: improving thesensitivity of progressive multiple sequence alignment through sequence weighting, position-specific gap penalties and weight matrix choice. Nucleic Acids Res. 1994;22:4673–4680. doi: 10.1093/nar/22.22.4673. [DOI] [PMC free article] [PubMed] [Google Scholar]
Associated Data
This section collects any data citations, data availability statements, or supplementary materials included in this article.
Supplementary Materials
Supplement


