

Summary
Temporal frequency is a fundamental sensory dimension in audition and touch. In audition, analysis of temporal frequency is necessary for speech and music perception [1]; in touch, the spectral analysis of vibratory signals has been implicated in texture perception [2, 3] and in sensing the environment through tools [4–7]. Environmental oscillations impinging upon the ear are generally thought to be processed independently of oscillations impinging upon the skin. Here, we show that frequency channels are perceptually linked across audition and touch. In a series of psychophysical experiments, we demonstrate that auditory stimuli interfere with tactile frequency perception in a systematic manner. Specifically, performance on a tactile frequency-discrimination task is impaired when an auditory distractor is presented with the tactile stimuli, but only if the frequencies of the auditory and tactile stimuli are similar. The frequency-dependent interference effect is observed whether the distractors are pure tones or band-pass noise, so an auditory percept of pitch is not required for the effect to be produced. Importantly, distractors that strongly impair frequency discrimination do not interfere with judgments of tactile intensity. This surprisingly specific crosstalk between different modalities reflects the importance of supramodal representations of fundamental sensory dimensions.
Results and Discussion
Mechanical oscillations in the environment are transduced by specialized receptors in the ear or the skin. Auditory spectral analysis is critical for perceiving auditory objects, especially in the context of music and speech [1]. Spectral analysis of tactile signals in isolation [2] or in conjunction with auditory signals [3, 8–12] plays an important role in texture perception. Despite the frequent co-occurrence of congruent acoustical and vibrotactile signals, the relationship between auditory and tactile spectral analysis has never been systematically studied. In a series of human psychophysical experiments, we report differential influence of auditory distractors on the perceptual readout of the frequency and intensity of tactile stimuli. Both auditory pure tones (aPT) and auditory band-pass noise (aBPN) impaired and biased judgments of perceived tactile frequency, but not perceived intensity, in a frequency-dependent manner.
Tactile frequency discrimination was tested using a two-alternative forced-choice (2AFC) design (Fig. 1A). On each trial, a pair of vibrotactile pure tones (tPT), equated for perceived intensity, was delivered sequentially to the participant’s right index finger; his or her task was to report which of the two tones was higher in frequency (Experiment 1; see Experimental Procedures in Supplemental Data (SD) for a complete description of the Methods). The stimuli were each presented for 1-sec and were separated by a 1-sec inter-stimulus interval. One interval always contained a 200-Hz tPT (standard stimulus); the frequency of the tPT presented during the other interval (comparison stimulus) ranged from 100 to 300Hz in 40-Hz increments. On most trials, an aPT distractor was presented at the same time as the tPT comparison stimulus (In a control experiment, aPT distractors were presented during both the comparison and standard stimuli, yielding similar results (SD; Fig. S2)). Participants were instructed to ignore the auditory distractors. The aPTs ranged in frequency from 100 to 1500Hz and were equated to one another in perceived intensity. On the remaining trials, no auditory distractor was presented in order to establish a baseline against which we could compare performance achieved in the presence of auditory distractors. Great care was taken to ensure that the tactile stimuli were inaudible (SD).
Figure 1.
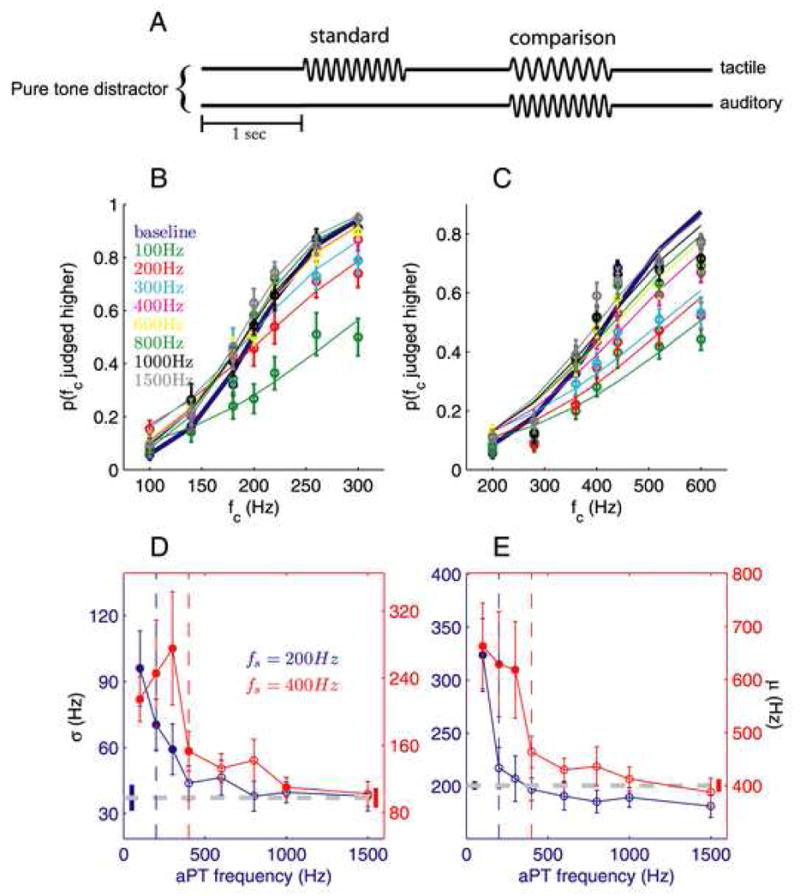
Tactile frequency discrimination in the presence of auditory pure tone (aPT) distractors (14 and 20 subjects for the 200-Hz and 400-Hz standards, respectively). (A) Experimental design. (B,C) Proportions of trials the comparison was judged higher in frequency, averaged across all participants, as a function of the comparison frequency fc, tested with the 200- (B) and 400-Hz (C) standards. Each colored trace corresponds to a different aPT distractor (blue denotes baseline performance). Error bars indicate s.e.m. (D) Mean sensitivity (σ) as a function of distractor frequency (filled points indicate means that are significantly different from baseline). The gray dashed line and untethered bars correspond to baseline and s.e.m, respectively. The blue and red vertical dashed lines correspond to the frequency of the standards (200- and 400-Hz respectively). With the 200-Hz standard (blue trace), aPT distractors ranging from 100 to 300Hz significantly reduced sensitivity (i.e. yielded a larger σ) (t(13) = 4.3, P = 0.0009, t(13) = 4.0, P = 0.002, and t(13) = 3.35, P = 0.005, respectively). With the 400-Hz standard (red trace), the 100-, 200-, 300-, 400-, and 1000-Hz aPT distractors significantly decreased sensitivity (t(17) = 4.5, P = 0.0003, t(17) = 3.8, P = 0.001, t(18) = 3.8, P = 0.001, t(18) = 2.9, P = 0.009, and t(19) = 3.0, P = 0.008, respectively). (E) Mean bias (μ) as a function of distractor frequency (conventions as in (D)). With the 200-Hz standard, only the 100-Hz aPT significantly biased perceived tactile frequency (t(13) = 3.58, P = 0.003). With the 400-Hz standard, aPT distractors ranging from 100 to 300Hz significantly biased perceived tactile frequency (t(17) = 4.6, P = 0.0003, t(17) = 3.7, P = 0.002, and t(18) = 3.0, P = 0.007).
We found that auditory distractors differentially affected tactile discrimination performance depending on their frequency (Fig. 1B). We quantified the effect of the distractors by fitting psychometric functions to individual participant’s data. We then compared the sensitivity (σ) and bias (μ) obtained in each distractor condition to that obtained in the baseline condition. Sensitivity is a measure of participants’ ability to discriminate the stimuli (the change in frequency, with respect to the standard, that is discriminable 73% of the time) and bias corresponds to the point of subjective equality (the comparison frequency perceived to be equal to the standard frequency). Auditory distractors reduced participants’ sensitivity to differences in tactile frequency (repeated-measures ANOVA, F8,104 = 10.9, P < 10−4; Fig. 1D, blue trace) and did so in a frequency-dependent manner (F7,91 = 11.4, P < 10−4). Specifically, the 100-, 200-, and 300-Hz aPT distractors reduced sensitivity (2-tailed paired t-test, all P values < 0.01, with Bonferroni correction), the 100-Hz distractor by a factor of approximately three. The aPT distractors also biased the perceived frequency of the comparison tPT (F8,104 = 10.1, P < 10−4; Fig. 1E, blue trace); the magnitude of the bias also depended on distractor frequency (F7,91 = 10.8, P < 10−4). In general, the perceived frequency of the tactile stimuli tended to be pulled towards the frequency of the aPT; however, only the bias induced by the 100-Hz distractor achieved statistical significance (P = 0.003). Given that the subjects were instructed to ignore the auditory distractors, the bias seems to reflect an automatic and unconscious influence of auditory stimuli on the perception of their tactile counterparts, an effect loosely analogous to the McGurk or ventriloquism effects [13]. The degree to which auditory distractors affected individual participants’ performance varied (SD; Fig. S3). In summary, perception of tactile frequency is both impaired and biased by low-frequency but not high-frequency aPT distractors.
We then tested whether audio-tactile interference depends on the similarity in frequency of the auditory and tactile stimuli, or whether only low-frequency aPT distractors influence the tactile processing of stimulus frequency. To this end, we repeated the experiment using a 400-Hz tactile standard with comparison stimuli ranging in frequency from 200 to 600Hz (in the presence of the same aPT distractors). In this condition, aPTs impaired and biased perceived tactile frequency over a wider range of distractor frequencies (F8,152 = 5.2, P < 10−4 and F8,152 = 9.9, P < 10−4, respectively; Fig. 1D,E, red traces). The magnitude of the impairment and bias again depended on distractor frequency (F7,133 = 3.8, P = 0.001 and F7,133 = 9.7, P < 10−4, respectively). Post-hoc tests revealed that aPT distractors at frequencies lower than 600Hz significantly reduced sensitivity to differences in tactile frequency (all P values < 0.01). In addition, distractors at frequencies lower than 400Hz induced significant biases (all P values < 0.01). Thus, audio-tactile interference is not restricted to low frequency auditory distractors, and instead depends on the similarity of the auditory and tactile frequencies.
Importantly, in control experiments, we found that the efficacy of the auditory distractors did not depend on distractor intensity (SD; Fig. S5) nor did it depend on the relative onset and offset times of the tactile and auditory stimuli, so long as the duration of overlap (1 sec) was preserved (SD; Fig. S6).
Impaired performance due to aPT distractors may reflect interference at a sensory level (tactile and auditory inputs converge before pitch is resolved) or at a decisional level (convergence occurs after tactile and auditory pitch have been independently resolved). Whether the experience of auditory pitch is necessary for audio-tactile interference to occur has implications regarding the neural mechanisms underlying the observed effects. Impairment of task performance by aBPN distractors would imply that the interference occurs at the sensory level rather than the decisional level. To test whether audio-tactile interference requires the perception of auditory pitch, we repeated the tactile frequency discrimination experiments using auditory band-passed noise (aBPN) distractors that varied in center frequency (CF = 150, 300, 600, and 1200Hz) and bandwidth (BW = 2/3·CF) (Experiment 2; Fig. 2A). For the 200- and 400-Hz standards (Fig. 2B,C), aBPN distractors reduced sensitivity (F4,48 = 7.4, P = 0.0001 and F4,72 = 5.1, P = 0.001, respectively; Fig. 2D) and biased perceived frequency (F4,48 = 6.8, P = 0.0002 and F4,72 = 9.7, P < 10−4, respectively; Fig. 2E). The magnitude of the impairment depended on CF (F3,36 = 7.2, P < 10−4 and F3,54 = 3.7, P = 0.02, for the 200- and 400-Hz standards, respectively). Post-hoc tests revealed that, for both sets of tactile stimuli, the aBPNCF=150Hz and aBPNCF=300Hz distractors significantly reduced sensitivity (all P values < 0.01) whereas the other two aBPN distractors did not. The magnitude of the induced bias also depended on CF (F3,36 = 9.6, P = 0.0001 and F3,54 = 11.2, P < 10−4). The aBPN distractors tended to bias perceived tactile frequency in the direction of the distractor CF; only the aBPNCF=1200Hz distractor induced a significant bias with the 200-Hz standard (P = 0.002) whereas both the aBPNCF=150Hz and aBPNCF=300Hz distractors significantly biased perceived tactile frequency with the 400-Hz standard (P = 0.003 and P = 0.008, respectively). Together, these results show that the aPT and aBPN distractors comparably affected tactile frequency discrimination: distractors reduced sensitivity to the extent that the frequency content of the auditory and tactile stimuli was similar and distractors systematically biased perceived tactile frequency. Critically, results with the aBPN distractors demonstrate that interference does not require the elicitation of an auditory pitch percept, and suggests that analysis of tactile frequency is mediated by neural populations sensitive to both aPT and aBPN stimuli.
Figure 2.
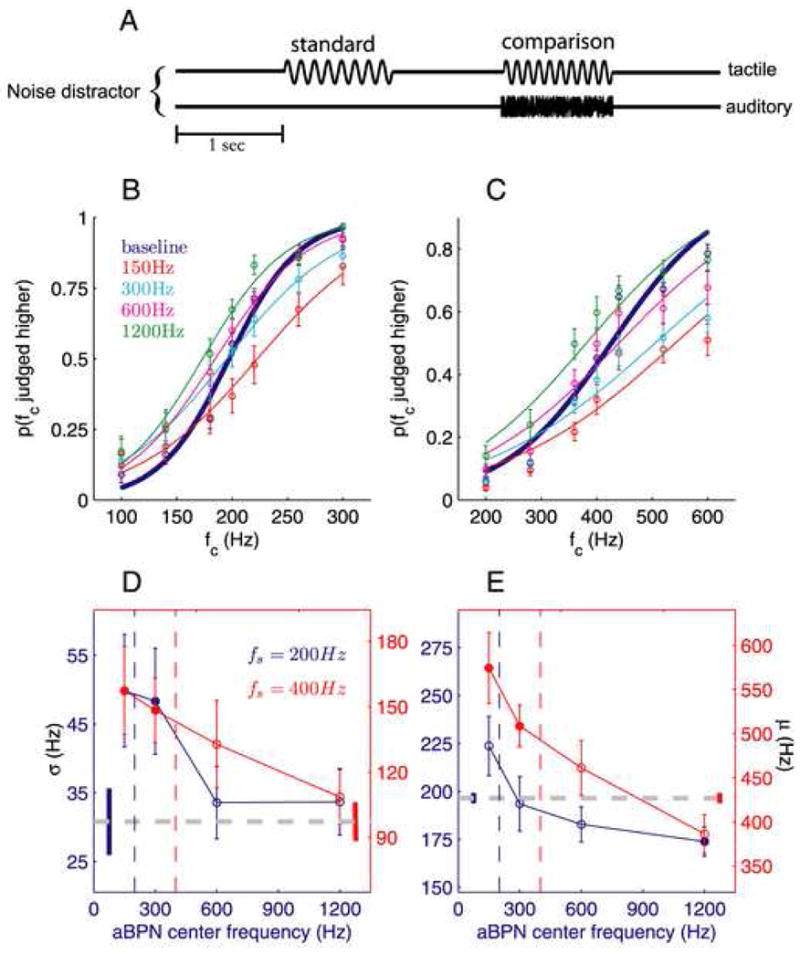
Tactile frequency discrimination in the presence of auditory band-passed noise (aBPN) distractors (14 and 19 subjects for the 200-Hz and 400-Hz standards, respectively) (conventions as in Fig. 1). (A) Experimental design. (B,C) Discrimination performance, averaged across participants, obtained with the 200- (B) and 400-Hz (C) standards. (D) With the 200-Hz standard, the aBPNCF=150Hz and aBPNCF=300Hz distractors significantly impaired sensitivity (t(12) = 3.1, P = 0.009 and t(12) = 3.3, P = 0.007, respectively). With the 400-Hz standard, the aBPNCF=150Hz and aBPNCF=300Hz distractors significantly impaired tactile frequency discrimination (t(18) = 2.9, P = 0.009 and t(18) = 3.4, P = 0.003, respectively). (E) With both standards, there was a general trend for aBPN distractors to bias the perceived tactile frequency towards the distractor CF. With the 200-Hz standard, only the aBPNCF=1200Hz distractor induced a significant bias (t(12) = 4.0, P = 0.002). With the 400-Hz standard, the aBPNCF=150Hz and aBPNCF=300Hz distractors significantly biased perceived tactile frequency (t(18) = 3.4, P = 0.003 and t(18) = 3.0, P = 0.008, respectively).
For both 200- and 400-Hz tactile standards, the greatest interference of tactile frequency processing occurred when the distractor frequencies were lower than the tactile frequencies (this was evident in experiments with aPT distractors). This result is reminiscent of the finding that auditory stimuli more effectively mask (auditory) stimuli at higher frequencies than they do stimuli at lower frequencies [1]. Indeed, psychophysical studies of auditory masking using the notched-noise method revealed asymmetric auditory filter shapes at low center frequencies (100–800Hz), with the lower skirt being shallower than the upper skirt [14]. While this asymmetry is typically attributed to the biomechanics of the basilar membrane, our results raise the interesting possibility that the shape of the auditory filter may reflect the properties of cortical neurons as well. This asymmetry can also be considered in the context of Bayesian models of perception [15]. Within this framework, perceptual decisions about the environment are inferences based on current sensory stimulation and prior knowledge about the environment. This approach has been used to model visual perception of objects, motion, and color constancy, among other phenomena [15]. The distribution of all possible co-occurrences of auditory and tactile stimuli may be skewed such that perceptible tactile frequencies tend to be lower than the frequencies of co-occurring auditory stimuli. For instance, while exploring surfaces tactually, both tactile and auditory inputs contribute to our textural percept [3]. The tactile input may tend to span a lower frequency range than its auditory counterpart. Our perceptual system may then represent prior beliefs that also reflect this asymmetry.
We next determined whether the audio-tactile interference was specific to the perception of tactile frequency, or if auditory distractors affected the perception of vibrotactile stimuli in general. We tested whether the perception of tactile intensity was also subject to auditory interference using a 2AFC design (Experiment 3; Fig. 3A). On each trial, participants were presented sequentially with a pair of tPT stimuli of equal frequency (100 or 200Hz) but differing in amplitude, and reported which of the two was more intense. One interval always contained a tPT at a standard amplitude (As) while the other contained a tPT at an amplitude (Ac) ranging from 0.5·As to 1.5·As. The comparison stimulus was presented either alone or with one of the aPT distractors used in Experiment 1. While auditory distractors interfered with participants’ ability to discriminate the frequency of tactile stimuli, these same distractors did not interfere with participants’ ability to judge tactile intensity (Fig. 3B,C): Distractors neither impaired sensitivity to tactile intensity differences (F6,24 = 1.7, P = 0.16 and F6,24 = 2.0, P = 0.1, for the 100- and 200-Hz tPT, respectively; Fig. 3D) nor did they bias perceived tactile intensity (F6,24 = 0.48, P = 0.82 and F6,24 = 0.97, P = 0.46; Fig. 3E). Furthermore, aPT distractors that varied in intensity had no effect on perceived tactile intensity (SD; Fig. S7). While tactile stimulation has been shown to influence the perceived intensity of simultaneously presented auditory stimuli [16, 17], we find that the perception of tactile intensity is not affected by the presentation of auditory distractors. Such asymmetry in multisensory interactions has been described previously [13, 18–20].
Figure 3.
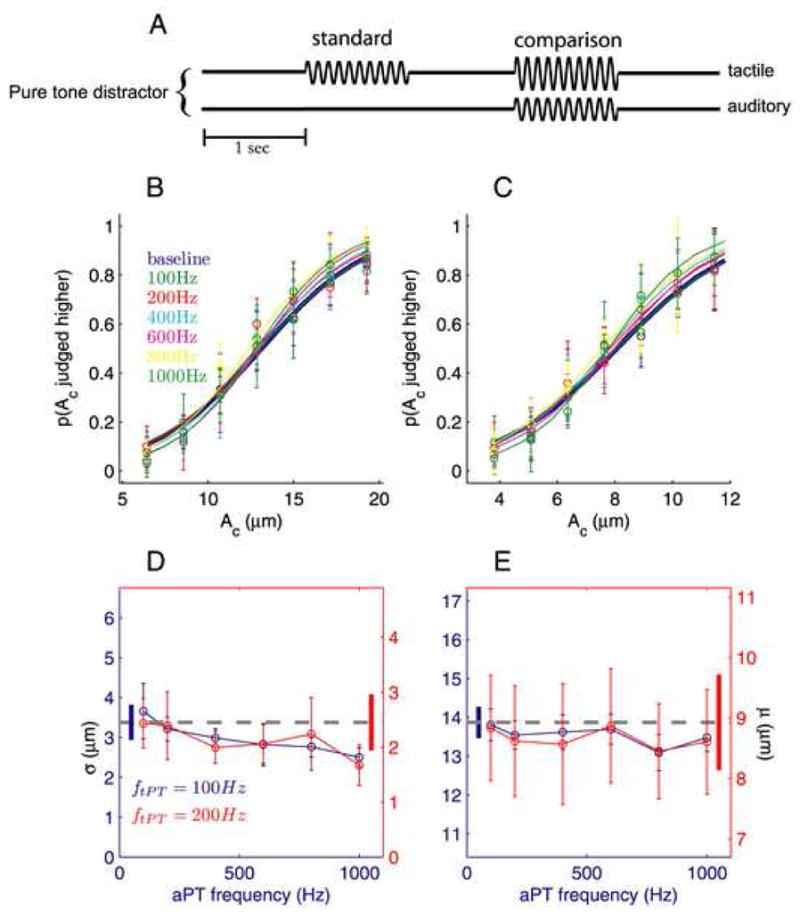
Tactile intensity discrimination in the presence of auditory pure tone (aPT) distractors (6 and 5 subjects for the 100-Hz and 200-Hz tPTs, respectively) (conventions as in Fig. 1). (A) Experimental design. (B,C) Proportions of trials the comparison was judged higher in intensity, averaged across all participants, as a function of the comparison amplitude Ac, tested with 100- (B) and 200-Hz (C) tPT. (D) Sensitivity to differences in intensity was not significantly affected by auditory distractors (repeated-measures ANOVA, F6,24 = 1.7, P = 0.16 and F6,24 = 2.0, P = 0.1, respectively). (E) Similarly, the perceived intensity of the 100- and 200-Hz tPT was not significantly biased by aPT distractors (F6,24 = 0.48, P = 0.82 and F6,24 = 0.97, P = 0.46, respectively).
In sum, we find that the somatosensory and auditory modalities interact in the analysis of stimulus frequency but not intensity. The role of auditory cortices in the spectral analysis of acoustic stimuli is undeniable. Although the cortical representation of “flutter” frequencies (<80Hz) has been extensively studied [21–24], where, how, or even whether the somatosensory cortices process high frequencies is debatable. The perception of flutter and the perception of vibration are likely elaborated along distinct processing streams [24, 25]. The available evidence suggests that, in primary and second somatosensory cortex, information about stimulus frequency in the vibration range (> 80Hz) is not carried in the temporal patterning of the neural response, as the entrainment of individual neurons to vibrations is weak [26]. Whereas the cortical substrate underlying the spectral analysis of high-frequency tactile inputs is beyond the scope of the present study, our results yield clear predictions. Specifically, the putative neural populations (a) are independently driven by tactile and auditory stimulation and (b) are responsive to auditory pure tones and band-pass noise. Indeed, belt areas in the auditory association cortex, notably the caudo-medial area (CM), have been shown to fulfill these requirements. First, the convergence of auditory and tactile signals in these auditory areas has been established in humans [8, 10, 27–29] and non-human primates [30, 31] using a variety of neuroimaging and neurophysiological techniques. Second, these areas have been shown to respond to both aPT and aBPN stimuli [32, 33]. Studies employing anatomical tracers have identified potential thalamic and cortical sources of somatosensory input to CM [34, 35]. While area CM has been ascribed a potential role in spatial localization based on the characterization of neuronal tuning properties [32, 33], audio-tactile interactions have been observed when stimuli were in and out of spatial register [27]. Interestingly, a link between spatial processing and perception of auditory tones has been recently suggested [36].
Our hypothesis, that regions of auditory cortex (like area CM) participate in spectral analysis of high-frequency tactile information as well as auditory information, yields many testable predictions. For instance, we predict that individual cortical neurons should show frequency-tuned responses to auditory and tactile stimuli. Furthermore, we predict that interfering with cortical processing in these areas, using techniques such as transcranial magnetic stimulation (TMS) [37], would severely impair or abolish participants’ ability to discriminate tactile frequency, but not intensity. Similarly, adaptation paradigms [22, 38] can be used to test the frequency-tuning of the tactile responses observed in the auditory areas. Specifically, repeated presentations of the same tactile frequency should result in adaptation of the BOLD signal if these auditory areas subserve tactile frequency processing. Moreover, if the same neuronal populations underlie auditory and tactile spectral processing, one would predict adaptation of the BOLD response to repeated presentations of the same frequency regardless of modality.
That the readout of tactile intensity is unimpaired by auditory processing is compatible with our hypothesis; the representation of tactile stimulus intensity is a function performed by another region of cortex. Our results support the view of a supramodal organization of the brain in which areas are conceptualized as operators that perform specific functions regardless of input modality [39]. Functional subdivisions, based on multisensory responses observed in traditionally unisensory cortices, have been suggested for processing object shape [39–41], motion [42, 43], and microgeometric features [44, 45]. Our results suggest that auditory cortical regions like area CM may serve as supramodal operators for spectral analysis.
Supplementary Material
Acknowledgments
We would like to thank CE Connor, JC Craig, S Yantis, X Wang, NX Tritsch, and KA Barnes for their thoughtful comments, M Solis, D Kim, P Campbell, M Jo and E Buz for their assistance in the data collection, and W Nash and W Quinlan for their technical assistance. This work was supported by NIH grants NS18787 (S.J.B.), NS062511 (J.M.Y.), and by a Howard Hughes Undergraduate Research Fellowship (J.B.O.).
Footnotes
Supplemental data
Supplemental data includes Experimental Procedures, Supplementary Results, and Supplementary Figures.
Publisher's Disclaimer: This is a PDF file of an unedited manuscript that has been accepted for publication. As a service to our customers we are providing this early version of the manuscript. The manuscript will undergo copyediting, typesetting, and review of the resulting proof before it is published in its final citable form. Please note that during the production process errors may be discovered which could affect the content, and all legal disclaimers that apply to the journal pertain.
References
- 1.Moore BJ. An Introduction to the Psychology of Hearing. London: Academic; 2003. [Google Scholar]
- 2.Bensmaia S, Hollins M. Pacinian representations of fine surface texture. Percept Psychophys. 2005;67:842–854. doi: 10.3758/bf03193537. [DOI] [PubMed] [Google Scholar]
- 3.Lederman SJ. Auditory texture perception. Perception. 1979;8:93–103. doi: 10.1068/p080093. [DOI] [PubMed] [Google Scholar]
- 4.Yoshioka T, Bensmaia SJ, Craig JC, Hsiao SS. Texture perception through direct and indirect touch: An analysis of perceptual space for tactile textures in two modes of exploration. Somatosensory and Motor Research. 2007;24:53–70. doi: 10.1080/08990220701318163. [DOI] [PMC free article] [PubMed] [Google Scholar]
- 5.Hollins M, Lorenz F, Harper D. Somatosensory coding of roughness: the effect of texture adaptation in direct and indirect touch. Journal of Neuroscience. 2006;26:5582–5588. doi: 10.1523/JNEUROSCI.0028-06.2006. [DOI] [PMC free article] [PubMed] [Google Scholar]
- 6.Lederman SJ, Klatzky RL, Hamilton CL, Ramsay GI. Perceiving surface roughness via a rigid probe: Psychophysical effects of exploration speed and mode of touch. Electronic Journal of Haptic Research. 1999;1:1–20. [Google Scholar]
- 7.Brisben AJ, Hsiao SS, Johnson KO. Detection of vibration transmitted through an object grasped in the hand. Journal of Neurophysiology. 1999;81:1548–1558. doi: 10.1152/jn.1999.81.4.1548. [DOI] [PubMed] [Google Scholar]
- 8.Schurmann M, Caetano G, Hlushchuk Y, Jousmaki V, Hari R. Touch activates human auditory cortex. Neuroimage. 2006;30:1325–1331. doi: 10.1016/j.neuroimage.2005.11.020. [DOI] [PubMed] [Google Scholar]
- 9.Jousmaki V, Hari R. Parchment-skin illusion: sound-biased touch. Current Biology. 1998;8:R190. doi: 10.1016/s0960-9822(98)70120-4. [DOI] [PubMed] [Google Scholar]
- 10.Foxe JJ, Wylie GR, Martinez A, Schroeder CE, Javitt DC, Guilfoyle D, Ritter W, Murray MM. Auditory-somatosensory multisensory processing in auditory association cortex: an fMRI study. Journal of Neurophysiology. 2002;88:540–543. doi: 10.1152/jn.2002.88.1.540. [DOI] [PubMed] [Google Scholar]
- 11.Guest S, Catmur C, Lloyd D, Spence C. Audiotactile interactions in roughness perception. Experimental Brain Research. 2002;146:161–171. doi: 10.1007/s00221-002-1164-z. [DOI] [PubMed] [Google Scholar]
- 12.Suzuki Y, Gyoba J, Sakamoto S. Selective effects of auditory stimuli on tactile roughness perception. Brain Res. 2008;1242:87–94. doi: 10.1016/j.brainres.2008.06.104. [DOI] [PubMed] [Google Scholar]
- 13.Calvert GA, Spence C, Stein BE. The handbook of multisensory processes. Cambridge, MA: MIT Press; 2004. [Google Scholar]
- 14.Moore BC, Peters RW, Glasberg BR. Auditory filter shapes at low center frequencies. J Acoust Soc Am. 1990;88:132–140. doi: 10.1121/1.399960. [DOI] [PubMed] [Google Scholar]
- 15.Probabilistic Models of the Brain: Perception and Neural Function. Cambridge, MA: MIT Press; 2002. [Google Scholar]
- 16.Schurmann M, Caetano G, Jousmaki V, Hari R. Hands help hearing: facilitatory audiotactile interaction at low sound-intensity levels. Journal of the Acoustical Society of America. 2004;115:830–832. doi: 10.1121/1.1639909. [DOI] [PubMed] [Google Scholar]
- 17.Gillmeister H, Eimer M. Tactile enhancement of auditory detection and perceived loudness. Brain Research. 2007;1160:58–68. doi: 10.1016/j.brainres.2007.03.041. [DOI] [PubMed] [Google Scholar]
- 18.Driver J, Noesselt T. Multisensory interplay reveals crossmodal influences on ‘sensory-specific’ brain regions, neural responses, and judgments. Neuron. 2008;57:11–23. doi: 10.1016/j.neuron.2007.12.013. [DOI] [PMC free article] [PubMed] [Google Scholar]
- 19.Ghazanfar AA, Schroeder CE. Is neocortex essentially multisensory? Trends Cogn Sci. 2006;10:278–285. doi: 10.1016/j.tics.2006.04.008. [DOI] [PubMed] [Google Scholar]
- 20.Schroeder CE, Foxe J. Multisensory contributions to low-level, ‘unisensory’ processing. Current Opinion in Neurobiology. 2005;15:454–458. doi: 10.1016/j.conb.2005.06.008. [DOI] [PubMed] [Google Scholar]
- 21.Romo R, Salinas E. Flutter discrimination: neural codes, perception, memory and decision making. Nature Reviews Neuroscience. 2003;4:203–218. doi: 10.1038/nrn1058. [DOI] [PubMed] [Google Scholar]
- 22.Hegner YL, Saur R, Veit R, Butts R, Leiberg S, Grodd W, Braun C. BOLD adaptation in vibrotactile stimulation: neuronal networks involved in frequency discrimination. J Neurophysiol. 2007;97:264–271. doi: 10.1152/jn.00617.2006. [DOI] [PubMed] [Google Scholar]
- 23.Mountcastle VB, Steinmetz MA, Romo R. Frequency discrimination in the sense of flutter: psychophysical measurements correlated with postcentral events in behaving monkeys. Journal of Neuroscience. 1990;10:3032–3044. doi: 10.1523/JNEUROSCI.10-09-03032.1990. [DOI] [PMC free article] [PubMed] [Google Scholar]
- 24.Talbot WH, Darian-Smith I, Kornhuber HH, Mountcastle VB. The sense of flutter-vibration: comparison of the human capacity with response patterns of mechanoreceptive afferents from the monkey hand. Journal of Neurophysiology. 1968;31:301–334. doi: 10.1152/jn.1968.31.2.301. [DOI] [PubMed] [Google Scholar]
- 25.Tommerdahl M, Hester KD, Felix ER, Hollins M, Favorov OV, Quibrera PM, Whitsel BL. Human vibrotactile frequency discriminative capacity after adaptation to 25 Hz or 200 Hz stimulation. Brain Research. 2005;1057:1–9. doi: 10.1016/j.brainres.2005.04.031. [DOI] [PubMed] [Google Scholar]
- 26.Ferrington DG, Rowe M. Differential contributions to coding of cutaneous vibratory information by cortical somatosensory areas I and II. J Neurophysiol. 1980;43:310–331. doi: 10.1152/jn.1980.43.2.310. [DOI] [PubMed] [Google Scholar]
- 27.Murray MM, Molholm S, Michel CM, Heslenfeld DJ, Ritter W, Javitt DC, Schroeder CE, Foxe JJ. Grabbing your ear: rapid auditory-somatosensory multisensory interactions in low-level sensory cortices are not constrained by stimulus alignment. Cerebral Cortex. 2005;15:963–974. doi: 10.1093/cercor/bhh197. [DOI] [PubMed] [Google Scholar]
- 28.Foxe JJ, Morocz IA, Murray MM, Higgins BA, Javitt DC, Schroeder CE. Multisensory auditory-somatosensory interactions in early cortical processing revealed by high-density electrical mapping. Brain Res Cogn Brain Res. 2000;10:77–83. doi: 10.1016/s0926-6410(00)00024-0. [DOI] [PubMed] [Google Scholar]
- 29.Caetano G, Jousmaki V. Evidence of vibrotactile input to human auditory cortex. Neuroimage. 2006;29:15–28. doi: 10.1016/j.neuroimage.2005.07.023. [DOI] [PubMed] [Google Scholar]
- 30.Fu KM, Johnston TA, Shah AS, Arnold L, Smiley J, Hackett TA, Garraghty PE, Schroeder CE. Auditory cortical neurons respond to somatosensory stimulation. Journal of Neuroscience. 2003;23:7510–7515. doi: 10.1523/JNEUROSCI.23-20-07510.2003. [DOI] [PMC free article] [PubMed] [Google Scholar]
- 31.Kayser C, Petkov CI, Augath M, Logothetis NK. Integration of touch and sound in auditory cortex. Neuron. 2005;48:373–384. doi: 10.1016/j.neuron.2005.09.018. [DOI] [PubMed] [Google Scholar]
- 32.Rauschecker JP, Tian B. Mechanisms and streams for processing of “what” and “where” in auditory cortex. Proc Natl Acad Sci U S A. 2000;97:11800–11806. doi: 10.1073/pnas.97.22.11800. [DOI] [PMC free article] [PubMed] [Google Scholar]
- 33.Recanzone GH. Spatial processing in the auditory cortex of the macaque monkey. Proceedings of the National Academy of Sciences of the United States of America. 2000;97:11829–11835. doi: 10.1073/pnas.97.22.11829. [DOI] [PMC free article] [PubMed] [Google Scholar]
- 34.Cappe C, Barone P. Heteromodal connections supporting multisensory integration at low levels of cortical processing in the monkey. Eur J Neurosci. 2005;22:2886–2902. doi: 10.1111/j.1460-9568.2005.04462.x. [DOI] [PubMed] [Google Scholar]
- 35.Hackett TA, Smiley JF, Ulbert I, Karmos G, Lakatos P, de la Mothe LA, Schroeder CE. Sources of somatosensory input to the caudal belt areas of auditory cortex. Perception. 2007;36:1419–1430. doi: 10.1068/p5841. [DOI] [PubMed] [Google Scholar]
- 36.Douglas KM, Bilkey DK. Amusia is associated with deficits in spatial processing. Nature Neuroscience. 2007;10:915–921. doi: 10.1038/nn1925. [DOI] [PubMed] [Google Scholar]
- 37.Hallett M. Transcranial magnetic stimulation: a primer. Neuron. 2007;55:187–199. doi: 10.1016/j.neuron.2007.06.026. [DOI] [PubMed] [Google Scholar]
- 38.Grill-Spector K, Henson R, Martin A. Repetition and the brain: neural models of stimulus-specific effects. Trends Cogn Sci. 2006;10:14–23. doi: 10.1016/j.tics.2005.11.006. [DOI] [PubMed] [Google Scholar]
- 39.Pascual-Leone A, Hamilton R. The metamodal organization of the brain. Progress in Brain Research. 2001;134:427–445. doi: 10.1016/s0079-6123(01)34028-1. [DOI] [PubMed] [Google Scholar]
- 40.Amedi A, Malach R, Hendler T, Peled S, Zohary E. Visuohaptic object-related activation in the ventral visual pathway. Nature Neuroscience. 2001;4:324–330. doi: 10.1038/85201. [DOI] [PubMed] [Google Scholar]
- 41.Amedi A, Stern WM, Camprodon JA, Bermpohl F, Merabet L, Rotman S, Hemond C, Meijer P, Pascual-Leone A. Shape conveyed by visual-to-auditory sensory substitution activates the lateral occiptal complex. Nature Neuroscience. 2007;10:687–689. doi: 10.1038/nn1912. [DOI] [PubMed] [Google Scholar]
- 42.Ricciardi E, Vanello N, Sani L, Gentili C, Scilingo EP, Landini L, Guazzelli M, Bicchi A, Haxby JV, Pietrini P. The effect of visual experience on the development of functional architecture in hMT+ Cerebral Cortex. 2007;17:2933–2939. doi: 10.1093/cercor/bhm018. [DOI] [PubMed] [Google Scholar]
- 43.Blake R, Sobel KV, James TW. Neural synergy between kinetic vision and touch. Psychological Science. 2004;15:397–402. doi: 10.1111/j.0956-7976.2004.00691.x. [DOI] [PubMed] [Google Scholar]
- 44.Zangaladze A, Epstein CM, Grafton ST, Sathian K. Involvement of visual cortex in tactile discrimination of orientation. Nature. 1999;401:587–590. doi: 10.1038/44139. [DOI] [PubMed] [Google Scholar]
- 45.Merabet L, Thut G, Murray B, Andrews J, Hsiao S, Pascual-Leone A. Feeling by sight or seeing by touch? Neuron. 2004;42:173–179. doi: 10.1016/s0896-6273(04)00147-3. [DOI] [PubMed] [Google Scholar]
Associated Data
This section collects any data citations, data availability statements, or supplementary materials included in this article.