

Abstract
In this paper different linear and non linear methodologies for the estimation of cortical connectivity from neuroelectric and hemodynamic measurements have been reviewed and applied on common data set in order to highlight similarities and differences in the obtained results. Different effective and functional connectivity methods have been applied to motor and cognitive data sets, including Structural Equation Modeling (SEM), Directed Transfer Function (DTF), Partial Directed Coherence (PDC) and direct Directed Transfer Function (dDTF). Comparisons will be made between these estimators in order to understand if, for a same dataset, effective and functional connectivity estimators (namely the SEM and the DTF) could return the same cortical connectivity patterns. An application of a non linear method (Phase Synchronization Index, PSI) to similar executed and imagined movements was also reviewed. Connectivity patterns estimated with the use of only the neuroelectric information or the information from the multimodal integration of neuroelectric and hemodynamic data were also compared. Results suggests that the estimation of the cortical connectivity patterns performed with the employed linear methods (SEM, DTF, PDC, dDTF) or with the non linear method (PSI) on movement related potentials returned essentially the same cortical network. Differences in cortical connectivity between the patterns estimated with the use of multimodal integration were noted when compared to those estimated by using only the neuroelectric data.
Keywords: High resolution EEG, Functional Cortical connectivity, PDC, DTF, SEM
Introduction
The understanding of mechanisms underlying the functioning of the human brain has known great advancements in the recent years. Technological developments, providing equipment like functional Magnetic Resonance Imaging (fMRI), Positron Emission Tomography (PET), Magnetoencephalography (MEG) allowed investigators to build images of the cerebral activity starting from hemodynamic, metabolic or electromagnetic measures. Among these brain imaging techniques, the Electroencephalograpy (EEG) has incomparable merits in term of simplicity, accessibility and temporal resolution, which has been object of a renewed interest in the recent years thanks to the use of advanced methods of analysis and elaboration of its data. Such methods are able to improve the spatial resolution of conventional EEG, making it an effective way to address the analysis of the brain activity in a non-invasive way with the temporal resolution of brain phenomena (in the order of milliseconds). With these methodologies, known as High Resolution EEG, it’s possible to build cortical activation maps describing the activity of the brain at the cortical level during the execution of an experimental task [1–4].
Experimental evidence suggests that the estimation of the cortical activity performed with the use of neuroelectromagnetic recordings improves with the use of the hemodynamic information recording during the same task [5–9]. This increase in the quality of the estimation of cortical activity has been also assessed during simulation studies that clearly demonstrate the advantage of the inclusion of the fMRI priors into the cortical estimation process [5,7]. These results could be framed in a general context in which the use of multimodal integration of neuroelectric (EEG), neuromagnetic (magnetoencephalography, MEG) and hemodynamic data for the estimation of the cortical activity increase the quality of the cortical activity estimation [6–13].
However, the simple imaging of brain regions activated during particular tasks does not convey information of how these regions communicate to each other to make task execution possible. The concept of brain connectivity is viewed as central for the understanding of the organized behavior of cortical regions, beyond the simple mapping of their activity [14–15]. This organization is thought to be based on the interaction between different and differently specialized cortical sites. Cortical connectivity estimation aims at describing these interactions as connectivity patterns which hold the direction and strength of the information flow between cortical areas. To this purpose, several methods have been developed and applied to data gathered from hemodynamic and electromagnetic techniques [1,4,16–17]. Two main definitions of brain connectivity have been proposed: functional and effective connectivity [18]. Functional connectivity is defined as a temporal correlation between spatially remote neurophysiologic events; the effective connectivity is defined as the simplest brain circuit which would produce the same temporal relationship as observed experimentally between cortical sites.
As for the effective connectivity, Structural Equation Modeling (SEM) is a technique that has been used to assess connectivity between cortical areas in humans from hemodynamic and metabolic measurements [16,19–21]. The basic idea of SEM considers the covariance structure of the data [19]. However, the estimation of effective cortical connectivity obtained from fMRI data has a low temporal resolution (in the order of seconds) which is far from the time scale in which the brain normally operates. Hence, it became of interest to understand if the SEM technique can be applied to cortical activity obtained applying the linear inverse techniques to high resolution EEG data [22].
As for the functional connectivity, the methods proposed in literature typically involve the estimation of some covariance properties between the different time series measured from different spatial sites, during motor and cognitive tasks, by EEG and fMRI techniques [1,4,17,23].
Due to evidence that important information in the EEG signals are coded in frequency rather than in time domain (reviewed in [24]), attention was focused on detecting frequency-specific interactions in EEG or MEG signals, for instance by means of the coherence between the activity of pairs of channels [25–27]. However, coherence analysis does not have a directional nature (i.e. it just examines whether a link exists between two neural structures, by describing instances when they are in synchronous activity) and it does not provide the direction of the information flow. In this respect, multivariate spectral techniques called Directed Transfer Function (DTF) or Partial Directed Coherence (PDC) were proposed [28–29] to determine the directional influences between any given pair of channels in a multivariate data set. Both DTF and PDC can be demonstrated [29–31] to rely on the key concept of Granger causality between time series [32], according to which an observed time series x(n) causes another series y(n) if the knowledge of x(n)’s past significantly improves prediction of y(n). This relation between time series is not reciprocal, i.e. x(n) may cause y(n) without y(n) necessarily causing x(n). This lack of reciprocity allows the evaluation of the direction of information flow between structures. These estimators are able to characterize both the direction and spectral properties of the brain signals, and require only one multivariate autoregressive (MVAR) model estimated from all the EEG channels. The advantages of MVAR modeling of multichannel EEG signals were stressed recently [33], by demonstrating the advantages of multivariate methods with respect to the pairwise autoregressive approach, both in terms of accuracy and of computational cost.
Several simulation studies clearly demonstrated that the estimation of cortical connectivity patterns could be performed with the SEM, DTF, PDC and dDTF methods with a relative low amount of errors [22,34–35]. The quality of these estimations depends on the particular length of the neurophysiologic recording under analysis, and on the level of the signal to noise ratio present in the dataset to be processed. In fact, under general conditions normally met in the experimental EEG or MEG recordings, the amount of errors performed by re-estimating the imposed connectivity pattern has been obtained below the 5% level [22, 34].
It is of interest that the experimental conditions in which the estimation of cortical activity with the multimodal integration of EEG, MEG and fMRI data returns errors lower than 5% [11] are the same that allow detection of the correct connectivity patterns with methodologies such as SEM, DTF, PDC, dDTF. This is reasonable since the amount of data available for the processing and the quality of such data (assessed by their signal to noise ratio) are important parameters for the proper functioning of the algorithms cited above.
The goal of this paper is to review the principal methods for the estimation of the cortical connectivity from neuroelectric and neuromagnetic signals that use the MVAR approach for all concerns the estimation of functional connectivity, and that use the SEM for the estimation of effective connectivity. A brief review of the non-linear methods like the phase synchronization will be also given. While other methods exists for the estimation of cortical connectivity between cerebral regions [36], they are already explained and applied in other papers proposed in the present special issue on the estimation of cortical connectivity.
The paper has the following structure: in the first section a distributed source method for the estimation of the cortical current density from high resolution EEG and fMRI measurements is presented. In the section II the method for the estimation of effective connectivity (SEM) is presented, while in the section III different methods for the estimation of functional connectivity based on the multivariate autoregressive approach are presented (DTF, PDC, dDTF, and non-linear methods). In the section IV the application of the previously described methods to the common data set from motor or cognitive task in a group of normal healthy subject is provided. Comparisons will be made between cortical connectivity estimators in order to answer the following questions:
1) Does the application of effective and functional connectivity estimators (namely the SEM and the DTF) on the same data recorded from sequential finger tapping return the same cortical connectivity pattern?
2) For the specific datasets presented, will the application of different methods of functional connectivity analysis (namely DTF, PDC and dTF) return the same cortical connectivity patterns?
Section I. Estimation of cortical source current density
I.1 Estimation of the lead field matrix
In order to estimate the cortical activity from neuroelectromagnetic measurements by using the distributed source approach [5] a lead field matrix A has to be computed for each EEG recording performed. Such matrix depends critically by the information on the sensors position as well as information about the actual geometry of the subject’s head. Such information is usually obtained by using a 3D digitizer for the collection of the electrodes position over the scalp of a particular subject to be investigated. The geometrical information of the subject’s head is obtained by the analysis of the Magnetic Resonance Images of the head. Such images were stacked into a 3D isotropic volume and regions containing different tissues were segmented (white matter, grey matter, CSF, skull, scalp and air). Three craniometric repere points (nasion, left and right preauricular points) were marked to allow later registration with other geometrical data. Three tessellated surfaces were extracted (inner and outer skull surface and scalp surface, about 500 triangles each) and used to define the geometry of the BEM. Conductivity of the skull compartment was usually set to 15 mS/m; conductivity of both the scalp and the brain compartments was set 15 times higher than the skull. The cortical sources were modeled using a distributed model with realistic cortical shape [8,37]. A tessellated surface representing the cortical mantle (about 5000–7000 triangles on average) was extracted through an iterative procedure, which fitted it halfway between the white/gray and the gray/CFS interfaces. The source model was composed of about 3000–4000 current dipoles, positioned at the vertices of the cortical tessellation, with direction normal to the local pseudo-tangent plane. With this approach, the relevant geometric features are preserved and the orientation of each dipole is constrained to be perpendicular to the cortical mantle, thus modeling the primary alignment orientation of pyramidal neurons.
I.2 Selection of Regions of interest (ROIs)
Several cortical regions of interest (ROIs) could be drawn on the computer-based cortical reconstruction of the individual head models. One possible way to generate such ROIs is a priori, based on the localization of the Brodmann areas. Such areas are regions of the brain in which the neurons share similar cytoarchitectonic properties, and sometimes also the same kind of neural processing. From this point of view it is possible to average together all the cortical activity estimated in the particular Brodmann area as suggested in the following. ROI coincident with the Brodmann areas are indicated as BA followed by a number, relative to the area involved.
I.3 Estimation of cortical source current density
The solution of the following linear system:
| (1) |
provides an estimation of the dipole source configuration x that generates the measured EEG potential distribution b. The system includes also the measurement noise n, assumed to be normally distributed [3,5,38]. A is the lead field matrix, where each j-th column describes the potential distribution generated on the scalp electrodes by the j-th unitary dipole. The current density solution vector ξ of Eq. 1 was obtained as [38]:
| (2) |
where M, N are the matrices associated to the metrics of the data and of the source space, respectively, λis the regularization parameter and ‖×‖M represents the M norm of the vector x. The solution of Eq. (2) is given by the inverse operator G:
| (3) |
An optimal regularization of this linear system was obtained by the L-curve approach. Hence, the solution of the neuroelectrical linear inverse problem (Eq. 1) can be factorized into the matrix multiplication of a pseudoinverse matrix (G) times the vector of measured potentials (b). This factorization allows to pre-compute G, as soon as the geometry of the model (BEM head model, source model and sensor positions) is available. As a metric in the data space we used the identity matrix, while as a norm in the source space we used the following metric which takes into account the hemodynamic information offered by the recorded fMRI data
| (4) |
where (N−1)ii is the i-th element of the inverse of the diagonal matrix N and all the other matrix elements Nij are set to 0. The L2 norm of the i-th column of the lead field matrix A is denoted by ‖A.i‖. The g(αi) is a function of the statistically significant percentage increase of the fMRI signal during the task, compared to the rest state. Such function has values greater than 1 for positive αi, while takes values lower than 1 for negative αi. The value of the parameter K tunes the strength of the inclusion of the fMRI constraints in the source space, and the function max(a,b) takes the maximum of the two arguments for each α. Here, we used the value of K = 10 which resulted from a previous simulation study, as a value returning optimal estimation of source current density with fMRI priors for a large range of SNR values of the gathered EEG signals [11].
Using the relations described above, an estimate of the signed magnitude of the dipolar moment for each cortical dipoles was obtained for each time point. As the orientation of the dipole was defined to be perpendicular to the local cortical surface in the head model, the estimation process returned a scalar rather than a vector field. The spatial average of the signed magnitude of all the dipoles belonging to a particular ROI at each time sample was used to estimate the waveforms of cortical ROI activity in that ROI, indicated as ρ(t) to highlight their time-dependence.
Spatial averaging can be expressed in terms of matrix multiplication by a matrix T. This matrix is sparse and has as many rows as ROIs and as many columns as the number of dipole sources. ROI cortical current density waveforms can then be expressed as:
| (5) |
Where b(t) is the array of the waveforms recorded from the scalp electrodes and x(t) is the array of the cortical current density waveforms estimated at the cortical surface. The GROI matrix only depends on geometrical factors, and can thus be computed and stored off-line. The matrix multiplication in (4) can be interpreted as a spatial filtering of the scalp potenital b(t), using the elements of GROI as weights.
Section II. Effective connectivity
Effective connectivity was defined as “the simplest neuronal-like circuit that would produce the same temporal relationship as observed experimentally between two neurons in a cell assembly”. This definition, generated from the spike recordings in primates, can be generalized to the activity of larger patches of the cortical tissue, as obtained from hemodynamic or cortical current density estimates. In this context, effective connectivity is defined as “the influence that one neural system exerts over another either directly or indirectly” [39]. Characterizing brain activity in terms of effective connectivity requires a causal model, in which regions and connections of interest are specified by the researcher, often constrained by a combination of neuroanatomical, neuropsychological, and functional neuroimaging data. This is a crucial point when considering the distinction between functional and effective connectivity because it emphasizes the shift between a description of what the brain does to a theory of how it does it.
Linear approach
The Structural Equation Modeling (SEM) is a technique developed at first in the social sciences, and later used in Neuroscience, at first to assess connectivity between cortical areas in humans from hemodynamic and metabolic measurements [16,19,21] and later from high resolution EEG data [22]. The basic idea of SEM considers the covariance structure of the data [19] and structural model involving different cortical structures. The estimation of effective cortical connectivity obtained from fMRI data has a low temporal resolution (in the order of seconds) which is far from the time scale in which the brain normally operates. Hence, it became of interest to understand if the SEM technique could be applied to cortical activity obtained applying the linear inverse techniques to high resolution EEG data. In Structural Equation Modeling (SEM), the parameters are estimated by minimizing the difference between the observed covariances and those implied by a structural or path model. In terms of neural systems, a measure of covariance represents the degree to which the activities of two or more regions are related.
The Structural Equation Model consists of a set of linear structural equations containing observed variables and parameters defining causal relationships among the variables. Variables in the equation system can be endogenous (i.e. dependent from the other variables in the model) or exogenous (independent from the model itself). The structural equation model specifies the causal relationship among variables, describes the causal effects, and assigns the explained and the unexplained variance. A full mathematical description of the SEM applied to hemodynamic and neuroelectric measurements can be found in literature [16,19,21–22].
Nonlinear approach
In the context of nonlinear time series analysis various measures of synchronization have been introduced. In 1996, Rosenblum et al. showed that coupled chaotic oscillators can display phase synchronization even when their amplitudes remain uncorrelated [40]. Phase synchronization is then characterized by a non uniform distribution of the phase difference between the two analyzed time series. Such synchronization estimates it is not dependent upon the amplitudes of the signals (as for instance the spectral coherence) and may be more suitable to track non stationary and non linear dynamics. Phase synchronization can be computed using the Hilbert transform of the analyzed signals [40–42] or by means of wavelets analysis [43]. More recently it has been shown that phase synchronization can also be used to detect the direction of coupling between two systems [44–46]. The idea of this approach is as follows: if, say, system 1 is driven by system 2, then the evolution of the phase of sistem1, φ1 depends also on the phase of system 2, φ2; in other words, prediction of φ1 from its previous values can be improved by taking into account the prehistory of φ2 only if system 2 drives system 1. Details about the method can be found in [47, 48]. In this paper, we will provide the results of an application of the phase synchronization index (PSI) [49] to EEG data [50]. A comprehensive review on nonlinear methods can be found in [51].
Section III. Multivariate methods for the estimation of functional connectivity
Functional connectivity reduces to testing the null hypothesis that activity in two regions shares no mutual information. Mutual information is a statistical description of the degree to which two regions demonstrate similar behavior or statistical interdependence. In other words, the characterization of brain activity in terms of functional connectivity is “model free”, in contrast with the effective connectivity described in the previous paragraph. As for the functional connectivity, the methods proposed in literature typically involve the estimation of some covariance properties between the different time series measured from the different spatial sites, during motor and cognitive tasks, by EEG and fMRI techniques [17,23]. The full mathematical description of the Directed Transfer Function (DTF), Partial Directed Coherence (PDC) and direct Directed Transfer Function (dDTF) have been proposed previously in literature [28,29,30,52,53]. All these connectivity estimation methods have been applied on the cortical signals obtained from the application of the inverse procedures described above to the high resolution EEG recordings.
III. 1. Statistical evaluation of connectivity measurements
All the methods for the estimation of the cortical connectivity return a series of values for the causal links between the ROIs analyzed. The crucial issue is then whether these values are significantly different from chance or not. The statistical validation of the cortical connectivity methods presented obviously are different for the SEM, PDC, DTF and dDTF methods as illustrated below.
Effective connectivity
The statistical significance of the connectivity pattern estimated with SEM technique was assured by the fact that in the context of the multivariate, normally distributed variables the minimum of the maximum likelihood function FML, multiplied by (N-1), follows a χ2 distribution with p(p + 1)/2 – t degrees of freedom, where t is the number of parameters to be estimated and p is the total number of observed variables (endogenous+exogenous). Then, the χ2 statistic test can then be used to infer statistical significance of the structural equation model obtained [19].
Functional connectivity
The situation is different for all concerns the statistical significance of the MVAR-derived connectivity methods (DTF, PDC, dDTF), since these methods have a highly nonlinear relation to the time series data from which they are derived, and the distribution of their estimators is not well established. This makes tests of significance difficult to perform, unless tests based on this empirical distribution can then be performed. A possible solution to this problem was proposed in Kaminski et al. [30]. It consists of the use of a surrogate data technique [54], in which an empirical distribution for random fluctuations of a given estimated quantity is generated by estimating the same quantity from several realizations of surrogate datasets, in which deterministic interdependency between variables were removed. In order to ensure that all features of each dataset are as similar as possible to the original dataset, with the exception of channel coupling, the very same data are used, any time-locked coupling between channels is disrupted by shuffling samples of the original multivariate signal. However, with this procedure the spectral properties of the signals are disrupted and we can obtain a threshold level which has no frequency content. A possible solution consists of disrupting the time-locked coupling by shuffling only the phases of the signals, with a method to that proposed by [53]. The procedure was as follows: we transformed the signal to the frequency domain by means of a Fourier transform and we shuffled only the phases φ(f) of the signals. In order for the inverse Fourier transform to be real we symmetrised the phases so that φ(−f) = φ(f). The inverse transform is the surrogate data, which has the same power spectrum, but random phases. In order to get a significance threshold, typically, one thousand surrogate datasets were generated as described above, and the spectra of the DTF, PDC or dDTF methods were estimated from each dataset. For each channel pair and for each frequency bin the 99 percentile was computed and subsequently considered as a significance threshold.
Section IV. Application of cortical connectivity estimators to real data
In this section, examples of application of the different estimators of functional and effective connectivity described in the previous paragraphs on a series set of data from simple motor and cognitive tasks are presented.
IV.1 A comparison between effective and functional connectivity estimators
In this section we presented differences obtained in the application of the SEM and DTF estimator on the same data set obtained while subjects performed a simple finger tapping sequence. The full details of the acquisition procedure can be found in previous publications [22,25]. Here, we mention that high resolution EEG recordings were made in five subjects that performs unilateral sequential finger tapping movements (250Hz acquisition rate, 600 trials recorded). The analysis period for the potentials time-locked to the movement execution was set from 300 ms before to 300 ms after the EMG trigger (0 time); the EEG time-course was divided in two phases relative to the EMG onset; the first, labeled as “PRE” period, marked the 300 ms before the EMG onset and was intended as a generic preparation period; the second labeled as “POST”, lasted up to 300 ms after the EMG onset and was intended to signal the arrival of the movement somatosensory feedback. We kept the same PRE and POST nomenclature for the signals estimated at the cortical level. Each subject had an MRI study to obtain geometrical information about his/her head. In all the subjects the realistic head models and cortical surface were realized and used in the generation of the lead field matrices. The linear inverse procedures described above were performed and the estimation of the cortical waveforms on each one of the thousand cortical dipoles used for each subjects were then obtained. All the connectivity patterns showed are statistically significant, as derived by the opportune tests performed on the connectivity patterns in agreement with the procedure described in the method sections.
The application of the SEM to the EEG cortical data needs before the reduction of the thousands estimated cortical waveforms to a number coincident with the ROIs employed in the study. In the case of the application of SEM. the adopted model of interactions between cortical areas is based on the principal cortical areas recognized as active during this task in previous studies with different imaging methods [23,55]. Namely, cortical areas used in this study included the prefrontal areas (PF), including Brodmann areas 8, 9, and 46; the premotor areas (PM), including the Brodmann area 6, the sensorimotor areas (SM) including the Brodmann areas 4, 3, 2, and 1, and the parietal areas (P), generated by the union of the Brodmann areas 5 and 7. The model employed was based on a priori knowledge about the flow of information through connections between these macroareas, as derived from neuroanatomy, neurophysiology and fMRI studies. In particular, information flow was hypothesized to occur from parietal (P) areas toward the sensorimotor (SM), the premotor (PM) and the prefrontal (PF) ones [8,23,55].
The results of the application of the SEM method for the estimation of the connectivity on the event related potential recordings is depicted in Fig 1, panels A and B. This Figure shows the statistically significant cortical connectivity patterns obtained for the period preceding the movement onset in the subject #1, in the alpha frequency band. Each pattern is represented with arrows that connect one cortical area (“the source”) to another one (“the target”). The colors and sizes of arrows code the level of strength of the functional connectivity observed between ROIs. The labels indicate the names of the ROIs employed. Note that the connectivity pattern during the period preceding the movement in the alpha band involves mainly the parietal left ROI (Pl) coincident with the Brodmann areas 5 and 7, functionally connected with the left and right premotor cortical ROIs (PMl and PMr), the left sensorimotor area (SMl), and both the prefrontal ROIs (PFl and PFr). The stronger functional connections are relative to the link between the left parietal and the premotor areas of both cerebral hemispheres. After the preparation and the beginning of the finger movement, in the POST period changes in the connectivity pattern can be noted. In particular, the origin of the functional connectivity links is positioned in the sensorimotor left cortical areas (SMl). From there, functional links are established with prefrontal left (PFl), both the premotor areas (PMl. PMr). A functional link emerged in this condition connecting the right parietal area (Pr) with the right sensorimotor area (SMr). The left parietal area (Pl) so active in the previous condition was instead linked with the left sensorimotor (SMl) and right premotor (PMr) cortical areas.
Figure 1.
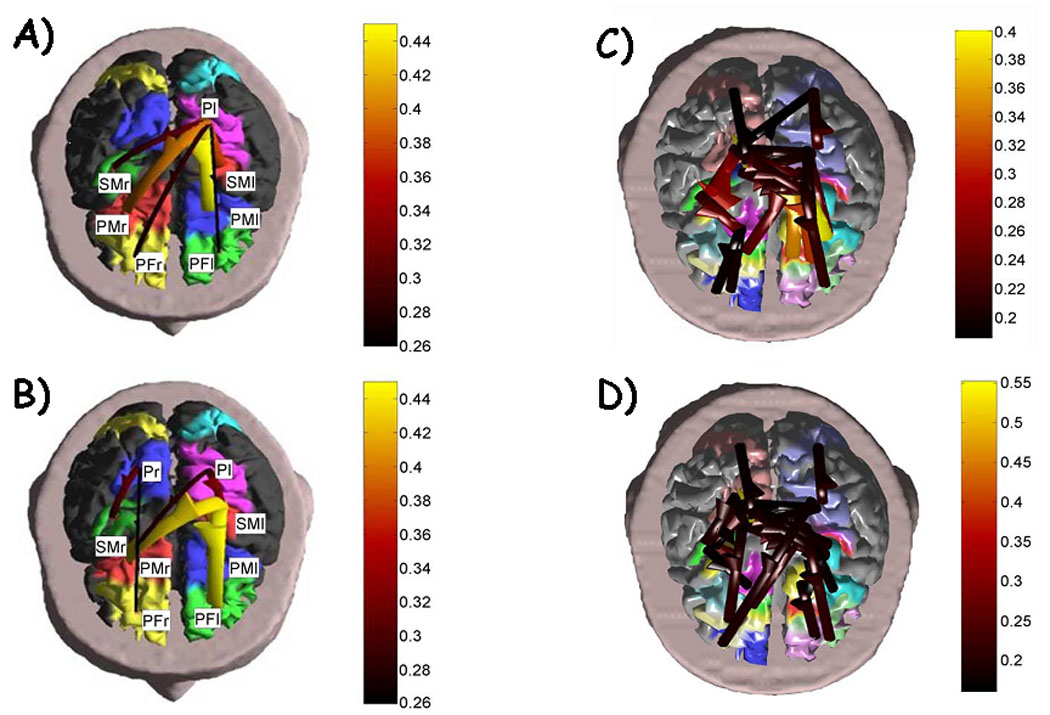
Left: The figure shows the cortical connectivity pattern obtained with the SEM method, for the period preceding and following the movement onset in the subject, in the alpha (8–12 Hz) frequency band. The realistic head model and the cortical envelope of the subject analyzed obtained from sequential MRIs are used to display the connectivity pattern. Such pattern is represented with arrows moving from one cortical area toward another one. The colors and sizes of the arrows code the level of strengths of the cortical connectivity observed among ROIs. The lighter and the bigger the arrows, the stronger the connections. The labels are relative to the name of the ROIs employed. Panel A shows the connectivity pattern obtained from EEG data before the onset of the right finger movement. Panel B shows the connectivity patterns obtained after the EMG onset. Right: Fig. C) and D) presents the patterns of cortical connectivity obtained by the DTF method, for the period preceding and following the movement onset, in the alpha (8–12 Hz) frequency band on the same data set used for the computation of panels A and B. Panel C shows the connectivity pattern obtained from EEG data before the onset of the right finger movement, while panel D shows the connectivity patterns obtained after the EMG onset. (Images modified with permission from Astolfi et al, Estimation of the Cortical Connectivity by High Resolution EEG and Structural Equation Modeling: Simulations and Application to Finger Tapping Data, IEEE Transactions on Biomedical Engineering, 2005 May; 52(5):757-68. and Astolfi et al., Assessing Cortical Functional Connectivity By Linear Inverse Estimation And Directed Transfer Function: Simulations And Application To Real Data, Clin Neurophysiol.;2005 116(4):920-32.)
The cortical connectivity patterns obtained with the use of the Directed Transfer Function (DTF) are presented in the Fig.1, panels C and D, for comparison. The subject and the frequency band was identical to those presented in panels A and B. The same conventions already described hold. Panel C shows the connectivity pattern obtained from EEG data before the onset of the right finger movement (EMG onset), while panel D shows the connectivity patterns obtained after the EMG onset. It can be noted that the connectivity patterns during the period preceding and following the movement in the alpha band involve the parietal and sensorimotor ROIs bilaterally, which are also functionally connected with the premotor cortical ROIs. A minor involvement of the prefrontal ROIs is also observed. The stronger functional connections are relative to the link between the premotor and prefrontal areas of both cerebral hemispheres. After the preparation and the beginning of the finger movement, in the POST period slight changes in the connectivity patterns can be noted.
It is possible to observe that the patterns of the cortical activity estimated by the effective and functional estimators employed (SEM and DTF) appeared quite similar, although in the application of the functional connectivity estimator the number of statistical significant connections between ROIs are higher when compared to those suggested by the SEM application. However, the general flow of information between the parietal and the frontal areas is preserved in both cases, returning substantial equivalent information for the task analyzed.
IV.2 Results from the nonlinear estimation
In this paragraph we will show an example of application of the phase synchronization analysis to the study of functional connectivity in a motor task. Interesting, the motor task is quite similar to the one examined in the previous paragraph [50].
The experimental session performed on the subjects consisted of four parts. In the first part, a median nerve stimulation of subject’s right wrist was conducted, above the motor threshold where a definite twitch of the thumb was visible. The Inter Stimulus Interval (ISI) of the electric stimulation was 1,500 ms and stimulus duration 200 ms, for a total number of 250 trials. In the second part, the subject was instructed to make a right index finger-tapping task, tapping a key of a keyboard, externally paced by an auditory signal (1,000 Hz, dB max 64 arranged to be heard but not annoying to the subject, 50 ms duration, and with an ISI of 1,500 ms). The third session consisted of a series of sub-sessions were the subjects practiced right index finger tapping for 250 trials before the right index finger imagery task begun. Subjects were instructed to imagine the right index finger-tapping task with the auditory stimulation giving the pace. Subjects were instructed to imagine the kinesthetic of the movement and not the visual image of the movement itself. After training, approximately 130 trials of right index finger imagery were recorded.The fourth session consisted of a control auditory stimulation, where the subjects were instructed to hear passively the auditory stimulation without executing any movement, while being relaxed. Full details about the experiment can be found in [50]. Phase synchronization is encountered in weakly interacting oscillator system and it manifests by the occurrence of a relationship between the corresponding phases variables. Authors used wavelet phase synchronization, taking the scale of the wavelet corresponding to the most reactive frequencies in the beta (16–30 Hz) range. After extraction of phases, the degree of synchronization between any two of the selected electrodes was evaluated, on a single trial basis, using a phase synchronization index (PSI) defined as the intensity of the first Fourier mode of the relative phase distribution [49]. The normalized PSI ranges from 0 (no synchronization) to 1 (phase synchronization), providing an indication on the degree of interaction between the two underlying systems. The pairwise phase synchronization between beta oscillations at the selected electrodes have been employed for the identification of the functional interactions during motor and imagery tasks. Significance was inferred by comparing the values derived from the experimental data with estimates on 500 surrogate data sets generated by shuffling the trial order of the second signal. In this way, the phase synchronization due to phase locking to the stimuli was eliminated. A significance criterion of 5% was used for the statistical evaluation of the results.
The results of pairwise phase synchronization analysis performed on the signals recorded at selected electrodes on the contralateral hemisphere during the 20–900 ms poststimulus temporal window point out that the matrices of phase synchronization indices are similar for both real and imagined movement. The significant synchronization values identify beta range synchronization between signals recorded at electrodes FCZ, C5. CPZ and C1. The topographic map of inferred functional connectivity revealed similar functional connections established during both real and imagery right finger movement, strongly suggesting not only a common neural substrate shared by execution and imagery in the contralateral hemisphere, but also similar functional integration properties. The stronger connection strength between frontal and central areas (electrodes C5, FCZ) could be the results of the co-activation of hand and midcentral areas. It is interesting to note as such results is in line with the cortical connectivity estimates obtained in the finger tapping task by using the linear estimators previously described.
IV.3 A comparison between different functional connectivity estimators
In this paragraph we would like to show an example of the comparisons of the results obtained by the application of different functional connectivity estimators (such as DTF, PDC and dDTF) on the same data set. The issue here is whether different methods presented have serious bias in the generation of the results. In this case the real application was performed on the data recorded from a population of normal subjects while they performed a cognitive task, the Stroop color-word interference task. Although the full details of this experiment could be obtained in the previously published paper [56], some information related to the cognitive task are presented in the following. In this task subjects viewed a screen where the name of a color (e.g., ‘red’) was printed in the same color (e.g., in red ink, congruent condition) or a different color (e.g., in blue ink, incongruent condition). Blocks of congruent or incongruent words alternated with blocks of neutral words (not color names). There were 256 trials in 16 blocks (4 color congruent, 8 neutral, 4 color-incongruent) of 16 trials. A trial began with the presentation of a word for 1500 ms, followed by a fixation cross for an average of 500 ms. Each trial consisted of one word presented in one of four ink colors (red, yellow, green, blue), with each color occurring equally often with each word type (congruent, neutral, incongruent). Subjects were asked to press one of four buttons that corresponded to the color of the ink the presented word. Data from 0 to 450 ms post-stimulus onset was analyzed.
Figure 2 shows the cortical connectivity patterns obtained for the period preceding the subject’s response during the congruent trials in the beta (12–29Hz) frequency band, for a representative subject. The patterns are shown on the realistic head model and cortical envelope of the subject, obtained from MRI scans. Three connectivity patterns are depicted, estimated in the beta frequency band for the same subject with the DTF (left), the PDC (middle), and the dDTF (right). Only the cortical connections statistically significant at P <0.01 are reported. It is possible to observe that in this case the cortical estimated patterns was preserved with slight differences between the methods employed. In particular, functional connections between parieto-frontal areas were present in all the estimations performed by the DTF, PDC, and dDTF methods. Moreover, connections involving the cingulate cortex are also clearly visible, as well as those involving prefrontal areas, mainly in the right hemisphere. Functional connections in prefrontal and premotor areas tended to be greater in the right hemisphere, whereas the functional activity in the parietal cortices was generally bilateral. It is still possible to observe the substantial agreement of the patterns depicted by the different methods for the estimation of the cortical patterns with the different functional connectivity estimators.
Figure 2.
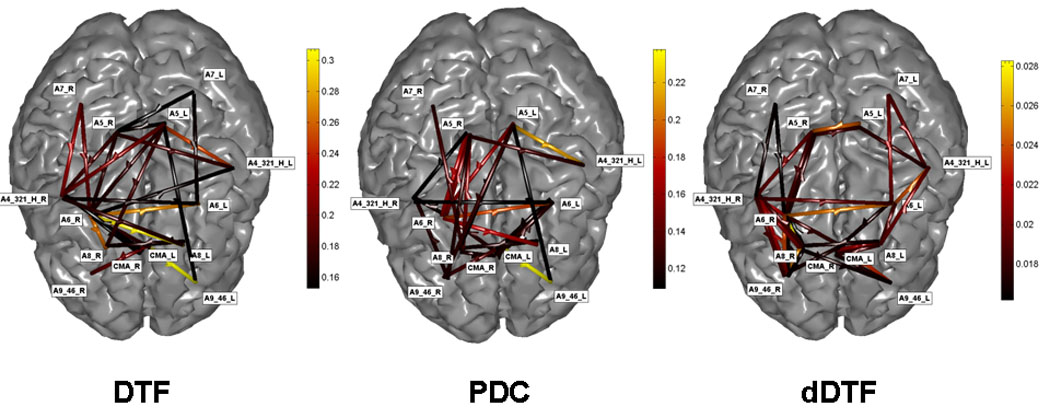
Cortical connectivity patterns obtained for the period preceding the subject’s response during congruent trials in the beta (12–29Hz) frequency band in a representative subject. The patterns are shown on the realistic head model and cortical envelope of the subject, obtained from sequential MRIs. The brain is seen from above, left hemisphere represented on the right side. Same conventions of the previous figure. Three connectivity patterns are depicted, estimated in the beta frequency band for the same subject with the DTF (left), the PDC (middle), and the dDTF (right). Only the cortical connections statistically significant at P < 0.01 are reported. Figure modified with permission from Astolfi, et al.. Comparison of different cortical connectivity estimators for highresolution EEG recordings. Human Brain Mapping, (2007), 28, 143–157.
The connectivity patterns in the different frequency bands between the different cortical regions could be summarized also by using indices representing the total flow from and toward the selected cortical area. The total inflow in a particular cortical region was then defined as the sum of the statistically significant connections from all the other cortical regions toward the selected area. The total inflow for each ROI is represented by a sphere centered on the cortical region, whose radius is linearly related to the magnitude of all the incoming statistically significant links from the other regions. Inflow information is also coded through a color scale. This information depicts each ROI as the target of functional connections from the other ROIs. The same conventions were used to represent the total outflow from a cortical region, generated by the sum of all the statistical significant links obtained by the application of the DTF to the cortical waveforms. Fig. 3 shows the inflow (first row) and outflow (second row) patterns computed for the same subject in the beta frequency band, for the same time period shown in Fig. 2 with the DTF, PDC and dDTF methods. The ROIs that are very active as source or sink (i.e., the source/target of the information flow to/from other ROIs) show results that are generally stable across the different estimators. In fact, across methods a greater involvement of the right premotor and prefrontal regions is observed.
Figure 3.
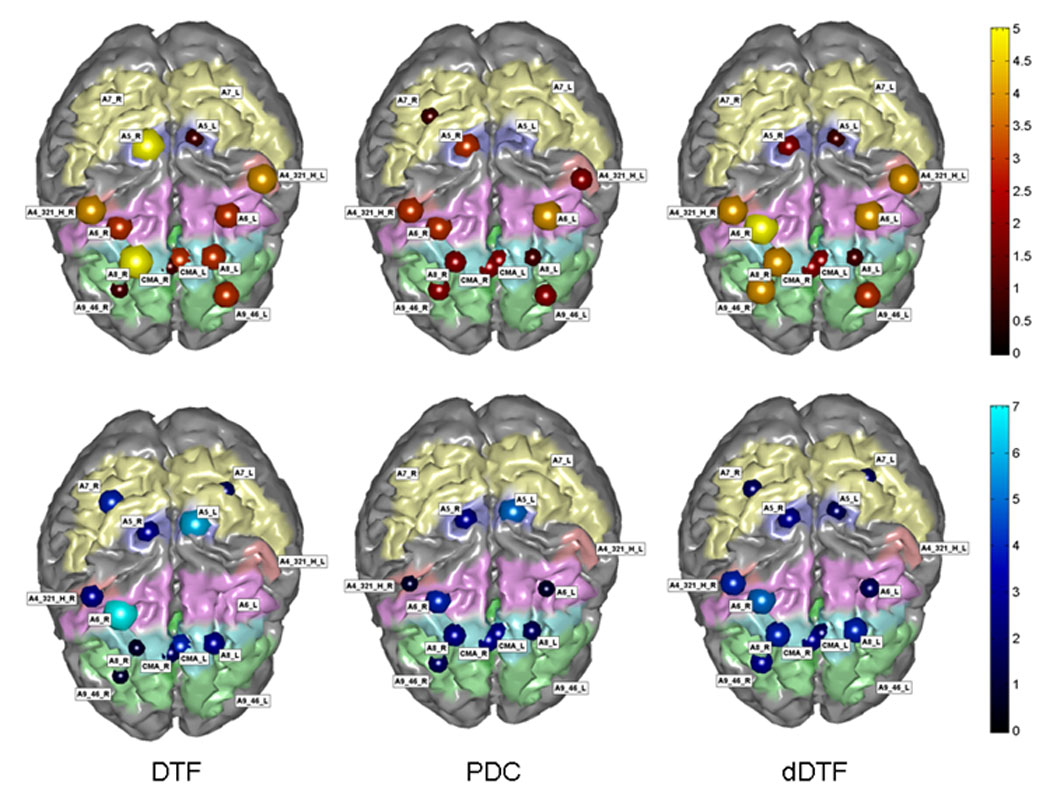
The inflow (first row) and the outflow (second row) patterns obtained for the beta frequency band from each ROI during the congruent trials. The brain is seen from above, left hemisphere represented on the right side. In the first row the figure summarizes in red hues the behaviour of an ROI in terms of reception of information flow from other ROIs, by adding the values of the links arriving on the particular ROI from all the others. The information is coded with the size and the colour of a sphere centred on the particular ROI analyzed. The larger the sphere, the higher the value of inflow or outflow for any given ROI. In the second row the blue hues code the outflow of information from a single ROI towards all the others. Figure modified with permission from Astolfi, et al.. Comparison of different cortical connectivity estimators for high-resolution EEG recordings. Human Brain Mapping, (2007), 28, 143–157.
IV.4 A comparison between functional connectivity estimates performed with and without the multimodal integration of neuroelectric and hemodynamic information
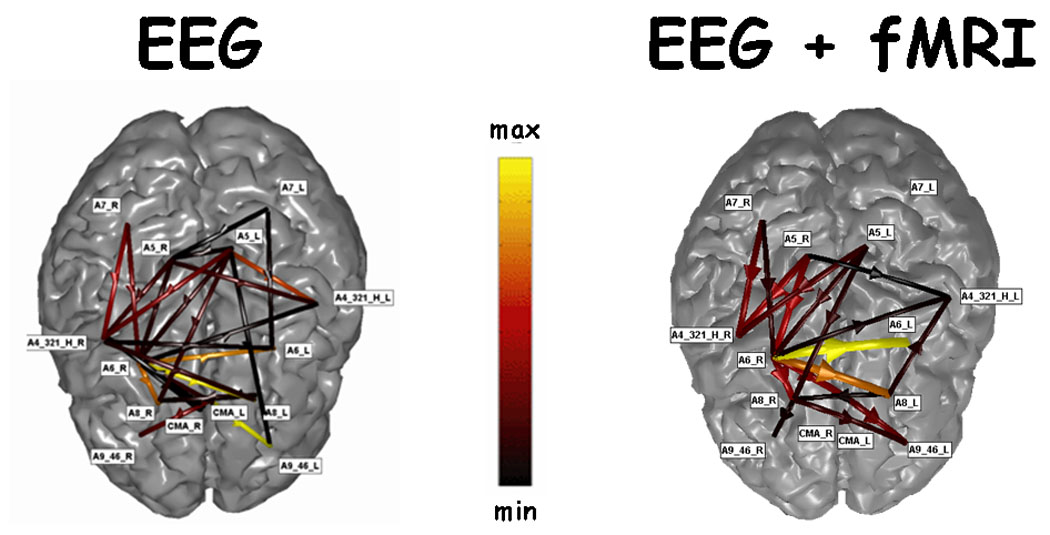
In this paragraph a comparison between the cortical connectivity patterns estimated by using the DTF connectivity estimator was presented in the case in which it was available only the neuroelectric or both the neuroelectric and hemodynamic information of brain activity obtained during task performance. Two examples will be provided, related to the execution of finger tapping procedure and the Stroop task. In both cases the fMRI acquisition was performed with the use of a 3 Tesla device. EEG acquisition was performed separately from the fMRI acquisition in two groups of healthy subjects. The EEG acquisition and fRMI parameters employed for the recordings can be found in the previously published papers [35,56]. The multimodal integration of EEG and fMRI data was performed by using as a norm in the source space a metric which takes into account the hemodynamic information offered by the recorded fMRI data, as described by eq. 4 of the Methods section. We computed the statistically significant percentage increase of the fMRI signal during the task, compared to the rest state, αi. The function g(αi) has values greater than 1 for positive αi, while takes values lower than 1 for negative αi. The value of the parameter K tunes the strength of the inclusion of the fMRI constraints in the source space. Here, we used the value of K = 10 which resulted from a previous simulation study, as a value returning optimal estimation of source current density with fMRI priors for a large range of SNR values of the gathered EEG signals [11].
The analysis of the brain activity and connectivity obtained during the finger tapping task was performed in a group of three subjects. Figure 4 shows two rows of cortical connectivity patterns obtained for these subjects in both experimental conditions (by use the EEG information and the EEG plus the fMRI information). The upper row is related to the cortical connectivity patterns estimated before the EMG onset (PRE) in the finger tapping condition, while the second row is related to the connectivity patterns computed after the EMG onset (POST). The label below each column indicates the subjects analyzed (S1, S2, S3). Two conditions are compared with the use of DTF as connectivity estimator; one presented on the left is related to the estimation of the DTF by using only the neuroelectric information (EEG; first three columns from the left). On the right, there are three columns of cortical connectivity patterns estimated with the use of multimodal integration of neuroelectric and hemodynamic data (EEG+fMRI). The same conventions of the previous figures were adopted. All statistical connections presented are significant at p<0.001. A substantial agreement of the information conveyed by the two series of connectivity patterns is evident, although differences are present in particular cortical areas. Changes in the intensity of the cortical connections are evident in the case of the patterns estimated just with the use of the EEG when compared to the connectivity patterns estimated with the use of EEG and fMRI. Then, while the parietal and frontal connections are returned in both the estimations, a shift of the intensity is observed in the connectivity patterns computed by using EEG and fMRI information when compared to those obtained using only the EEG data.
Figure 4.
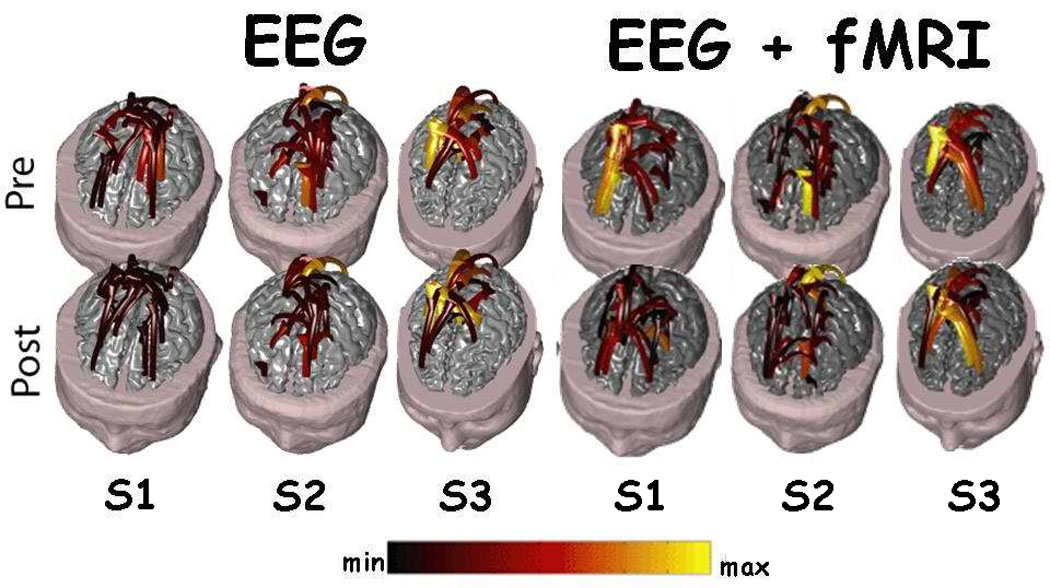
Figure shows two rows of cortical connectivity patterns. The upper one is related to the cortical connectivity patterns estimated before the EMG onset (PRE) in the finger tapping condition, while the second row is related to the connectivity patterns computed after the EMG onset (POST). The label below each column indicates the subjects analyzed (S1, S2, S3). Two conditions are compared with the use of DTF as connectivity estimator; one presented on the left related to the estimation of the DTF by using only the neuroelectric information (EEG). On the right, there are three columns of cortical connectivity patterns estimated with the use of multimodal integration of neuroelectric and hemodynamic data (EEG+fMRI). Same conventions of the previous figure.
Similar results were obtained by estimating the cortical connectivity patterns in the beta band for a same subject with and without the fMRI information from the high resolution EEG recordings obtained during the execution of the Stroop task. Fig. 5 presents two cortical connectivity patterns obtained with the DTF estimator in the beta band during the congruent condition of the Stroop task. On the left of the figure the cortical connectivity pattern estimated with the use of only the EEG information is presented, while on the right of the figure the connectivity pattern estimated by the DTF with the use of the EEG and fMRI information is presented. It can be appreciated in this case that a substantial agreement exists for the connectivity patterns obtained in the two conditions, that show an involvement of the parietal and the frontal areas. This finding is similar to that already observed in the finger tapping experiment, as in this case the intensity of the DTF estimated by the cortical waveforms obtained with the multimodal integration was higher than that obtained by using the EEG information alone. Differences in the cortical pattern in different cortical areas could be noted, although the correlation between the two estimated cortical patterns is quite remarkable.
Figure 5.
The figure presents two cortical connectivity patterns obtained with the DTF estimator, in the beta band, during the congruent condition in the Stroop task. On the left there is the cortical connectivity pattern estimated with the use of only the EEG information, while on the right part of the figure there is the connectivity pattern estimated by the DTF with the use of the EEG and fMRI information.
Section V. Conclusions
In this paper, different methodologies for the estimation of cortical connectivity from neuroelectric and hemodynamic measurements have been reviewed and applied on a common data set in order to highlight similarities and differences in the obtained results. Different effective and functional connectivity methods were applied to motor and cognitive data sets, including SEM, PSI, DTF, PDC and dDTF. On the basis of the results obtained in the section IV, it is possible to generate, at least for the datasets analyzed, answers to the questions framed in the introduction section as follows:
1) The comparison between the connectivity patterns generated by the effective and the functional connectivity methods returned a similar global picture, while some differences in the connectivity between particular cortical regions emerged. A possible source for these differences in the connectivity patterns may be related to the different sensitivities of the statistical tests employed to threshold the significant connectivity links between the ROIs. In fact, the SEM methods employed a different statistical approach when compared to that employed by the DTF, and the different statistical power of the tests employed could be also a source of the differences noted between the two methods. The application of non linear techniques (namely PSI) to a finger tapping task similar to those employed with the SEM and DTF methods returned a pattern of estimated cortical connectivity in agreement with those obtained by the linear methods.
2) The different functional connectivity estimators returned essentially the same global picture of connectivity patterns estimated for the cognitive task investigated in a group of normal subjects. In this case, the statistical tests employed to threshold the connectivity estimations were identical for the three methods used. This was observed in both the connectivity pattern analysis and in the indexes (as the outflow or the inflow) derived from such connectivity patterns.
The use of the ROIs is important in the estimation of cortical connectivity since the distributed source models normally employed thousands of current equivalent dipoles, and for each one of them a cortical waveform could be estimated. This means that in the case in which we would like to apply the algorithms described directly on such cortical waveforms, we met immediately the problem of needing to generate MVAR or SEM processes related to thousand variables, not currently manageable with the actual numerical methodologies. In addition, apart from numerical and practical considerations, the identification processes for these large sets of variables will require a large number of data points, exceeding the standard lengths of recordings actually performed. All these considerations suggest the utility of the ROIs in the estimation of the cortical connectivity in order to circumvent the above mentioned difficulties.
In conclusion, an integrated approach to estimate brain cortical connectivity information by using noninvasive methodologies involving the multimodal integration of electrophysiological measurements is presented. These methodologies enable the detection of statistical significance of the estimated cortical activations in the selected ROIs during simple motor or cognitive tasks in humans.
Acknowledgment
This work was supported in part by NSF BES-0411898, NIH EB007920, and NIH EB00178. The funding support of the Minister for Foreign Affairs, Division for Scientific and Technological Development, in the framework of a bilateral project between Italy and China, and the European COST Action NEUROMATH BM0601 are also gratefully acknowledged. This paper reflects only the authors’ views, and funding agencies are not liable for any use that may be made of the information contained herein.
References
- 1.Gevins A. Dynamic functional topography of cognitive task. Brain Topography. 1989;2:37–56. doi: 10.1007/BF01128842. [DOI] [PubMed] [Google Scholar]
- 2.He B, Lian J. Spatio-temporal Functional Neuroimaging of Brain Electric Activity, Critical Review of Biomedical Engineering. 2002;30:283–306. doi: 10.1615/critrevbiomedeng.v30.i456.30. [DOI] [PubMed] [Google Scholar]
- 3.Nunez PL. Neocortical dynamics and human EEG rhythms. New York: Oxford University Press; 1995. [Google Scholar]
- 4.Urbano A, Babiloni C, Onorati P, Ambrosini A, Carducci F, Fattorini L, Babiloni F. Responses of human primary sensorimotor and supplementary motor areas to internally-triggered unilateral and simultaneous bilateral one-digit movements. A high resolution EEG study. European Journal of Neuroscience. 1998 Feb;10(2):765–770. doi: 10.1046/j.1460-9568.1998.00072.x. Cambridge, UK. [DOI] [PubMed] [Google Scholar]
- 5.Dale , Liu A, Fischl B, Buckner R, Belliveau JW, Lewine J, Halgren E. Dynamic Statistical Parametric Mapping: Combining fMRI and MEG for High-Resolution Imaging of Cortical Activity. Neuron. 2000;26:55–67. doi: 10.1016/s0896-6273(00)81138-1. [DOI] [PubMed] [Google Scholar]
- 6.He B, Hori J, Babiloni F. In: EEG Inverse Problems. Akay M, editor. Vol. 2. Wiley Encyclopedia in Biomedical Engineering, John Wiley & Sons, Inc.; 2006. pp. 1355–1363. [Google Scholar]
- 7.Im CH, Liu ZM, Zhang N, Chen W, He B. Functional Cortical Source Imaging from Simultaneously Recorded ERP and fMRI. J of Neurosci Method. 2006;157(1):118–123. doi: 10.1016/j.jneumeth.2006.03.015. [DOI] [PMC free article] [PubMed] [Google Scholar]
- 8.Babiloni F, Cincotti F, Babiloni C, Carducci F, Basilisco A, Rossini PM, Mattia D, Astolfi L, Ding L, Ni Y, Cheng K, Christine K, Sweeney J, He B. Estimation of the cortical functional connectivity with the multimodal integration of high resolution EEG and fMRI data by Directed Transfer Function. Neuroimage. 2005 Jan 1;24(1):118–131. doi: 10.1016/j.neuroimage.2004.09.036. [DOI] [PubMed] [Google Scholar]
- 9.Liu Z, He B. fMRI-EEG Integrated Cortical Source Imaging by use of Time-Variant Spatial Constraints. NeuroImage. 2007 doi: 10.1016/j.neuroimage.2007.10.003. [DOI] [PMC free article] [PubMed] [Google Scholar]; Hansen PC. Analysis of discrete ill-posed problems by means of the L-curve. SIAM Review. 1992;34:561–580. [Google Scholar]
- 10.Babiloni C, Miniussi C, Babiloni F, Carducci F, Cincotti F, Del Percio C, Sirello G, Fracassi C, Nobre AC, Rossini PM. Sub-second "temporal attention" modulates alpha rhythms. A high-resolution EEG study. Cogn Brain Res. 2004a May;19(3):259–268. doi: 10.1016/j.cogbrainres.2003.12.010. [DOI] [PubMed] [Google Scholar]
- 11.Babiloni F, Babiloni C, Carducci F, Romani GL, Rossini PM, Angelone LM, Cincotti F. Multimodal integration of high-resolution EEG and functional magnetic resonance imaging data: a simulation study. Neuroimage. 2003 May;19(1):1–15. doi: 10.1016/s1053-8119(03)00052-1. [DOI] [PubMed] [Google Scholar]
- 12.Babiloni F, Babiloni C, Carducci F, Romani GL, Rossini PM, Angelone LM, Cincotti F. Multimodal integration of EEG and MEG data: a simulation study with variable signal-to-noise ratio and number of sensors. Hum Brain Mapp. 2004b May;22(1):52–62. doi: 10.1002/hbm.20011. [DOI] [PMC free article] [PubMed] [Google Scholar]
- 13.Liu ZM, Ding L, He B. Integration of EEG/MEG with MRI and fMRI in Functional Neuroimaging. IEEE Engineering in Medicine and Biology Magazine. 2006a;25(4):46–53. doi: 10.1109/memb.2006.1657787. [DOI] [PMC free article] [PubMed] [Google Scholar]
- 14.Lee L, Harrison LM, Mechelli A. The functional brain connectivity workshop: report and commentary. Neuroimage. 2003;19:457–465. doi: 10.1016/s1053-8119(03)00062-4. [DOI] [PubMed] [Google Scholar]
- 15.Horwitz B. The elusive concept of brain connectivity. Neuroimage. 2003;19:466–470. doi: 10.1016/s1053-8119(03)00112-5. [DOI] [PubMed] [Google Scholar]
- 16.Buchel C, Friston KJ. Modulation of connectivity in visual pathways by attention: cortical interactions evaluated with structural equation modeling and fMRI. Cereb Cortex. 1997;7(8):768–778. doi: 10.1093/cercor/7.8.768. [DOI] [PubMed] [Google Scholar]
- 17.Brovelli A, Ding M, Ledberg A, Chen Y, Nakamura R, Bressler SL. Beta oscillations in a large-scale sensorimotor cortical network: directional influences revealed by Granger causality. Proc Natl Acad Sci U S A. 2004 Jun 29;101(26):9849–9854. doi: 10.1073/pnas.0308538101. [DOI] [PMC free article] [PubMed] [Google Scholar]
- 18.Friston KJ. Functional and effective connectivity in neuroimaging: A synthesis. Human Brain Mapping. 1994;2:56–78. [Google Scholar]
- 19.Bollen KA. Structural Equations with latent variables. New York: Wiley and sons; 1989. [Google Scholar]
- 20.McIntosh AR, Gonzalez-Lima F. Structural equation modeling and its application to network analysis in functional brain imaging. Hum.Brain Mapp. 1994;2:2–22. [Google Scholar]
- 21.Schlosser R, Gesierich T, Kaufmann B, Vucurevic G, Hunsche S, Gawehn J, Stoeter P. Altered effective connectivity during working memory performance in schizophrenia: a study with fMRI and structural equation modeling. Neuroimage. 2003;19(3):751–763. doi: 10.1016/s1053-8119(03)00106-x. [DOI] [PubMed] [Google Scholar]
- 22.Astolfi L, Cincotti F, Babiloni C, Carducci F, Basilisco A, Rossini PM, Salinari S, Mattia D, Cerutti S, Ben Dayan D, Ding L, Ni Y, He B, Babiloni F. Estimation of the cortical connectivity by high-resolution EEG and structural equation modeling: simulations and application to finger tapping data. IEEE Trans Biomed Eng. 2005a;52:757–768. doi: 10.1109/TBME.2005.845371. [DOI] [PubMed] [Google Scholar]
- 23.Jancke L, Loose R, Lutz K, Specht K, Shah NJ. Cortical activations during paced finger-tapping applying visual and auditory pacing stimuli. Brain Res.Cogn Brain Res. 2000;10(1–2):51–66. doi: 10.1016/s0926-6410(00)00022-7. [DOI] [PubMed] [Google Scholar]
- 24.Pfurtscheller G, Lopes da Silva FH. Event-related EEG/MEG synchronization and desynchronization: basic principles. Clin Neurophysiol. 1999 Nov;110(11):1842–1857. doi: 10.1016/s1388-2457(99)00141-8. [DOI] [PubMed] [Google Scholar]
- 25.Bressler SL. Large-scale cortical networks and cognition. Brain Res.Brain Res.Rev. 1995;20(3):288–304. doi: 10.1016/0165-0173(94)00016-i. [DOI] [PubMed] [Google Scholar]
- 26.Gross J, Kujala J, Hämäläinen M, Timmermann L, Schnitzler A, Salmelin R. Dynamic imaging of coherent sources: studying neural interactions in the human brain. Proc. Natl. Acad. Sci. USA. 2001;98(2):694–699. doi: 10.1073/pnas.98.2.694. [DOI] [PMC free article] [PubMed] [Google Scholar]
- 27.Gross J, Timmermann L, Kujala J, Salmelin R, Schnitzler A. Properties of MEG tomographic maps obtained with spatial filtering. NeuroImage. 2003;19:1329–1336. doi: 10.1016/s1053-8119(03)00101-0. [DOI] [PubMed] [Google Scholar]
- 28.Kaminski M, Blinowska K. A new method of the description of the information flow in the brain structures. Biol. Cybern. 1991;65:203–210. doi: 10.1007/BF00198091. [DOI] [PubMed] [Google Scholar]
- 29.Baccalà LA, Sameshima K. Partial Directed Coherence: a new concept in neural structure determination. Biol Cybern. 2001;84:463–474. doi: 10.1007/PL00007990. [DOI] [PubMed] [Google Scholar]
- 30.Kaminski M, Ding M, Truccolo WA, Bressler S. Evaluating causal relations in neural systems: Granger causality, directed transfer function and statistical assessment of significance. Biol. Cybern. 2001;85:145–157. doi: 10.1007/s004220000235. [DOI] [PubMed] [Google Scholar]
- 31.Sato JR, Takahashi DY, Arcuri SM, Sameshima K, Morettin PA, Baccalá LA. Frequency domain connectivity identification: An application of partial directed coherence in fMRI. Hum Brain Mapp. 2007 Dec 6; doi: 10.1002/hbm.20513. [DOI] [PMC free article] [PubMed] [Google Scholar]
- 32.Granger CWJ. Investigating causal relations by econometric models and cross-spectral methods. Econometrica. 1969;37:424–438. [Google Scholar]
- 33.Kus R, Kaminski M, Blinowska KJ. Determination of EEG activity propagation: pair-wise versus multichannel estimate. IEEE Trans Biomed Eng. 2004 Sep;51(9):1501–1510. doi: 10.1109/TBME.2004.827929. [DOI] [PubMed] [Google Scholar]
- 34.Astolfi L, Cincotti F, Mattia D, Babiloni C, Carducci F, Basilisco A, Rossini PM, Salinari S, Ding L, Ni Y, He B, Babiloni F. Assessing Cortical Functional Connectivity By Linear Inverse Estimation And Directed Transfer Function: Simulations And Application To Real Data. Clinical Neurophysiology. 2005b Apr;116(4):920–932. doi: 10.1016/j.clinph.2004.10.012. [DOI] [PubMed] [Google Scholar]
- 35.Astolfi L, Cincotti F, Mattia D, Marciani MG, Baccala LA, De Vico Fallani F, Salinari S, Ursino M, Zavaglia M, Ding L, Edgar JC, Miller GA, He B, Babiloni F. A Comparison of Different Cortical Connectivity Estimators for High Resolution EEG Recordings. Human Brain Mapping. 2007 Feb;28(2):143–157. doi: 10.1002/hbm.20263. [DOI] [PMC free article] [PubMed] [Google Scholar]
- 36.David O, Cosmelli D, Friston KJ. Evaluation of different measures of functional connectivity using a neural mass model. NeuroImage. 2004;21:659–673. doi: 10.1016/j.neuroimage.2003.10.006. [DOI] [PubMed] [Google Scholar]
- 37.Babiloni F, Babiloni C, Locche L, Cincotti F, Rossini PM, Carducci F. High-resolution electroencephalogram: source estimates of Laplacian-transformed somatosensory-evoked potentials using a realistic subject head model constructed from magnetic resonance images. Med Biol Eng Comput. 2000 Sep;38(5):512–519. doi: 10.1007/BF02345746. [DOI] [PubMed] [Google Scholar]
- 38.Grave de Peralta Menendez R, Gonzalez Andino SL. Distributed source models: standard solutions and new developments. In: Uhl C, editor. Analysis of neurophysiological brain functioning. Springer Verlag; 1999. pp. 176–201. [Google Scholar]
- 39.Cover TM, Thomas JA. Elements of Information Theory. New York: Wiley; 1991. [Google Scholar]
- 40.Rosenblum MG, Pikovsky AS, Kurths J. Phase synchronization of chaotic oscillators. Phys Rev Lett. 1996;76:1804–1807. doi: 10.1103/PhysRevLett.76.1804. [DOI] [PubMed] [Google Scholar]
- 41.Mormann F, Lehnertz K, David P, Elger CE. Mean phase coherence as a measure for phase synchronization and its application to the EEG of epilepsy patients. Physica D. 2000;144:358–369. [Google Scholar]
- 42.Tass P, Rosenblum MG, Weule J, Kurths J, Pikovsky A, Volkmann J, Schnitzler A, Freund HJ. Detection of n:m phase locking from noisy data: application to magnetoencephalography. Phys Rev Lett. 1998;81:3291–3294. [Google Scholar]
- 43.Lachaux J-P, Rodriguez E, Martinerie J, Varela FJ. Measuring phase synchrony in brain signals. Hum Brain Mapp. 1999;8:194–208. doi: 10.1002/(SICI)1097-0193(1999)8:4<194::AID-HBM4>3.0.CO;2-C. [DOI] [PMC free article] [PubMed] [Google Scholar]
- 44.Rosenblum MG, Pikovsky AS. Detecting direction of coupling in interacting oscillators. Phys Rev E. 2001;64:045202. doi: 10.1103/PhysRevE.64.045202. [DOI] [PubMed] [Google Scholar]
- 45.Cimponeriu L, Rosenblum M, Fieseler T, Dammers J, Schiek M, Majtanik M, Morosan P, Bezerianos A, Tass PA. Inferring asymmetric relations between interacting neuronal oscillators. Prog Theor Phys Suppl. 2003;(150):22–36. [Google Scholar]
- 46.Smirnov DA, Bezruchko BP. Estimation of interaction strength and direction from short and noisy time series. Phys Rev E. 2003;68:046209. doi: 10.1103/PhysRevE.68.046209. [DOI] [PubMed] [Google Scholar]
- 47.Rosenblum MG, Cimponeriu L, Bezerianos A, Patzak A, Mrowka R. Identification of coupling direction: Application to cardiorespiratory Interaction. Physical Review E. 2002 Apr;Volume 65:041909. doi: 10.1103/PhysRevE.65.041909. art. no. 041909 Part 1. [DOI] [PubMed] [Google Scholar]
- 48.Cimponeriu L, Rosenblum M, Pikovsky A. Estimation of delay in coupling from time series. Phys Rev E Stat Nonlin Soft Matter Phys. 2004 Oct;70(4 Pt 2):046213. doi: 10.1103/PhysRevE.70.046213. Epub 2004 Oct 25. [DOI] [PubMed] [Google Scholar]
- 49.Pikovsky A, Rosenblum M, Kurths J. Synchronization: a universal concept in nonlinear sciences. Cambridge: Cambridge University Press; 2001. [Google Scholar]
- 50.Stavrinou ML, Moraru L, Cimponeriu L, Della Penna S, Bezerianos A. Evaluation of cortical connectivity during real and imagined rhythmic finger tapping. Brain Topogr. 2007 Spring;19(3):137–145. doi: 10.1007/s10548-007-0020-7. [DOI] [PubMed] [Google Scholar]
- 51.Stam CJ. Nonlinear dynamical analysis of EEG and MEG: review of an emerging field. Clin Neurophysiol. 2005 Oct;116(10):2266–2301. doi: 10.1016/j.clinph.2005.06.011. Review. [DOI] [PubMed] [Google Scholar]
- 52.Akaike H. A new look at statistical model identification. IEEE Trans Automat Control AC. 1974;19:716–723. [Google Scholar]
- 53.Korzeniewska A, Manczak M, Kaminski M, Blinowska K, Kasicki S. Determination of information flow direction between brain structures by a modified Directed Transfer Function method (dDTF) Journal of Neuroscience Methods. 2003;125:195–207. doi: 10.1016/s0165-0270(03)00052-9. [DOI] [PubMed] [Google Scholar]
- 54.Theiler J, Eubank S, Longtin A, Galdrikian B, Farmer JD. Testing for nonlinearity in time series: the method of surrogate data. Physica D. 1992;58:77–94. [Google Scholar]
- 55.Gerloff C, Richard J, Hadley J, Schulman AE, Honda M, Hallett M. Functional coupling and regional activation of human cortical motor areas during simple, internally paced and externally paced finger movements. Brain. 1998;121(Pt 8):1513–1531. doi: 10.1093/brain/121.8.1513. [DOI] [PubMed] [Google Scholar]
- 56.Astolfi L, de Vico Fallani , Cincotti F, Mattia D, Marciani MG, Bufalari S, Salinari S, Colosimo A, Ding L, Edgar JC, Heller W, Miller GA, He B, Babiloni F. Imaging functional brain connectivity patterns from high-resolution EEG and fMRI via graph theory. Psychophysiology. 2007;44:880–893. doi: 10.1111/j.1469-8986.2007.00556.x. [DOI] [PubMed] [Google Scholar]