

Abstract
Multifactor dimensionality reduction (MDR) was developed as a nonparametric and model-free data mining method for detecting, characterizing, and interpreting epistasis in the absence of significant main effects in genetic and epidemiologic studies of complex traits such as disease susceptibility. The goal of MDR is to change the representation of the data using a constructive induction algorithm to make nonadditive interactions easier to detect using any classification method such as naïve Bayes or logistic regression. Traditionally, MDR constructed variables have been evaluated with a naïve Bayes classifier that is combined with 10-fold cross validation to obtain an estimate of predictive accuracy or generalizability of epistasis models. Traditionally, we have used permutation testing to statistically evaluate the significance of models obtained through MDR. The advantage of permutation testing is that it controls for false-positives due to multiple testing. The disadvantage is that permutation testing is computationally expensive. This is in an important issue that arises in the context of detecting epistasis on a genome-wide scale. The goal of the present study was to develop and evaluate several alternatives to large-scale permutation testing for assessing the statistical significance of MDR models. Using data simulated from 70 different epistasis models, we compared the power and type I error rate of MDR using a 1000-fold permutation test with hypothesis testing using an extreme value distribution (EVD). We find that this new hypothesis testing method provides a reasonable alternative to the computationally expensive 1000-fold permutation test and is 50 times faster. We then demonstrate this new method by applying it to a genetic epidemiology study of bladder cancer susceptibility that was previously analyzed using MDR and assessed using a 1000-fold permutation test.
Keywords: Extreme Value Distribution, Permutation Testing, Power, Type I Error, Bladder Cancer, Data Mining
INTRODUCTION
Epistasis or gene-gene interaction is a fundamental component of the genetic architecture of complex traits such as disease susceptibility. Epistasis has been recognized for many years and has been described essentially from two different perspectives, biological and statistical [e.g. Cordell, 2002; Moore and Williams, 2005]. Biological epistasis, as defined by Bateson (1909), results from physical interactions among biomolecules in gene regulatory networks and biochemical pathways at the cellular level in an individual. Statistical epistasis, as defined by Fisher (1918), is deviation from additivity in a linear mathematical model that describes the relationship between multilocus genotypes and phenotype variation at the population level. Epistasis, along with other phenomena such as locus heterogeneity, phenocopy, and gene-environment interaction are major sources of complexity in the mapping relationship between genotype and phenotype. As such, we need research strategies that embrace, rather than ignore, this complexity [Templeton, 2000; Moore, 2003, 2005; Sing et al., 2003; Thornton-Wells et al., 2004; Moore and Williams, 2005; Rea et al., 2006].
Multifactor dimensionality reduction (MDR) was developed as a nonparametric and model-free data mining method for detecting, characterizing, and interpreting epistasis in the absence of significant main effects in genetic and epidemiologic studies of complex traits such as disease susceptibility [Ritchie et al., 2001, 2003; Hahn et al., 2003; Hahn and Moore, 2004; Moore, 2004; Moore et al., 2006; Moore, 2007, Velez et al. 2007]. The goal of MDR is to change the representation of the data using a constructive induction algorithm to make nonadditive interactions easier to detect using any classification method such as naïve Bayes or logistic regression [Moore et al., 2006; Moore, 2007]. This is accomplished by first labeling each genotype combination as high-risk or low-risk using some function of a discrete endpoint such as case-control status. A new MDR variable with two levels is constructed by pooling all high-risk genotype combinations into one group and all low-risk combinations into another group. Traditionally, variables constructed using MDR have been evaluated with a probabilistic naïve Bayes classifier that is combined with 10-fold cross validation. Ten-fold cross validation allows estimation of a testing accuracy of a model by leaving out 1/10 of the data as an independent test set. The model is developed on 9/10 of the data and then evaluated on the remaining test set. This process is repeated for each 1/10 of the data, and the resulting prediction accuracies are averaged. Permutation testing has been used to statistically evaluate the results from MDR. In this process, the endpoint labels are randomized thus creating a relationship between the variables and the endpoint under the null hypothesis of no association that can be used to determine what would be expected from MDR by chance. For example, when using a 1,000-fold permutation test, we obtain a distribution of 1,000 testing accuracies that we can use to determine where in that distribution we find the testing accuracy of our model and assign a p-value accordingly. The advantage of permutation testing is that it controls for false-positives due to multiple testing as long as the entire MDR model fitting process is repeated in each permuted dataset. The disadvantage of this approach is that permutation testing is computationally expensive and often not practical for large datasets such as those from genome-wide association studies.
In the present study, we sought to develop and evaluate a computationally efficient alternative to permutation testing for assessing the statistical significance of MDR models. Using data simulated from 70 different epistasis models, we compared the power and type I error rate of MDR using a 1000-fold permutation test with hypothesis testing using an extreme value distribution (EVD). Our goal was to demonstrate that the EVD test can approximate p-values as accurately as permutation testing while greatly reducing the computational burden of the analysis (e.g. by using 20 instead of 1000 permutations). For our simulated data, we estimate the mean and variance of a Gumbel distribution, which is derived from the generalized extreme value distribution (GEV) when the shape parameter is zero, to estimate a p-value for any given testing accuracy. We find that this new hypothesis testing method provides a powerful and efficient alternative to the computationally expensive 1000-fold permutation test. We then demonstrate this method by applying the GEV to a genetic epidemiology study of bladder cancer susceptibility that was previously analyzed using MDR and a 1000-fold permutation test.
METHODS
Data Simulation
There were two objectives of our simulation study. The first objective was to generate artificial datasets and use this data to evaluate the power and the type I error of MDR using a 1000-fold permutation testing and the extreme value distribution (EVD) test. The second goal was to generate pseudo-artificial datasets based on our real bladder cancer data and use this data to test the assumptions of the EVD test. We describe each simulation objective in turn.
First, we developed a total of 70 different penetrance functions that define a probabilistic relationship between genotype and phenotype where susceptibility to disease is dependent on genotypes from two loci in the absence of any marginal effects. These purely epistatic models were distributed evenly across seven broad-sense heritabilities (0.01, 0.025, 0.05, 0.1, 0.2, 0.3, and 0.4) and two different minor allele frequencies (0.2 and 0.4), where all functional SNPs in that data set have either one or the other MAF. Note that intermediate heritabilities (e.g. 0.15, 0.25, etc.) were not considered in this study due to computational constraints. However, previous results have indicated these intermediate heritabilities follow the same power trends (data not shown). A total of five models for each of the 14 heritability-allele frequency combinations were generated for a total of 70 models. The details of the 70 penetrance functions have been described previously [Velez et al., 2007]. Genotype frequencies for all 70 epistasis models were consistent with Hardy-Weinberg proportions. One hundred data sets were generated for each model with four sample sizes (200, 400, 800, and 1600 total individuals) each having an equal number of cases and controls. Each pair of functional polymorphisms was embedded within a set of 20 tagSNPs all with either a MAF of 0.2 or 0.4. The two functional SNPs were not in linkage disequilibrium (LD) with each other or any other SNPs in the data set.
We also generated larger data sets for all sample sizes consisting of 1000 tagSNPs embedded with two functional SNPs. All nonfunctional SNPs were simulated using allele frequencies selected randomly from a uniform distribution between 0 and 0.5. These 1000-SNP data sets represented the five models with a broad-sense heritability of 0.1 and a minor allele frequency of 0.4. These five models refer to models 35–39 in [Velez et al., 2007]. Similarly 100 data sets were generated for each of the five models for all sample sizes.
For evaluating the type I error of each test, null data sets with no functional SNPs were generated by permuting (randomizing the case-control labels) each of the data sets described above, including the large dataset. A total of 28,000 functional and 28,000 null datasets consisting of 20 SNPS and a total of 2000 functional and 2000 null data sets consisting of 1000 SNPs were generated and analyzed using MDR. All simulated data are available upon request.
For the second part of our study, we simulated pseudo-artificial datasets based on the real bladder cancer data described in more detail below. Our goal in this study was to generate datasets that featured more realistic correlation patterns and other complexities and use these datasets to test the independent and identically distributed (iid) assumption of the EVD test. Here, we fixed the genotypes and covariate levels and simulated case-control labels using several different penetrance functions. First, we developed a penetrance function for a single factor with heritability of 0.10. We then developed a two-locus epistasis model with a heritability of 0.10 using the allele frequencies for two SNPs (XPD 312 and XPD 751) that exhibit significant linkage disequilibrium (D’=0.52) and epistasis effects in the real data (Andrew et al. 2006). We then developed a three-factor penetrance function for the two epistatic SNPs and the single independent factor with a total heritability of 0.10. Using the fixed genotypes from the real data, we simulated case-control labels for a total of 100 datasets using each of these three penetrance functions.
Multifactor Dimensionality Reduction (MDR) Analysis
As described above, the goal of MDR is to change the representation space of the data using constructive induction to make interactions easier to detect. This is accomplished by combining two or more variables or attributes into a single attribute that can be modeled using a discrete data classifier. The general process of defining a new attribute as a function of two or more other attributes is referred to as constructive induction or attribute construction and was first described by [Michalski et al., 1983]. Constructive induction using MDR was accomplished in this study in the following way. Given a threshold T, a multilocus genotype combination, for example, is considered ‘high-risk’ if the ratio of cases to controls exceeds T; otherwise it is considered low-risk. Once genotypes are labeled ‘high-risk’ and ‘low-risk’ a new binary attribute is created with those two levels. Here, we set T to the ratio of cases to controls in the dataset being analyzed as recommended by [Velez et al., 2007]. Figure 1 illustrates this process for a dataset of 200 cases and 200 controls that was simulated using the penetrance function in Table 1.
Figure 1.
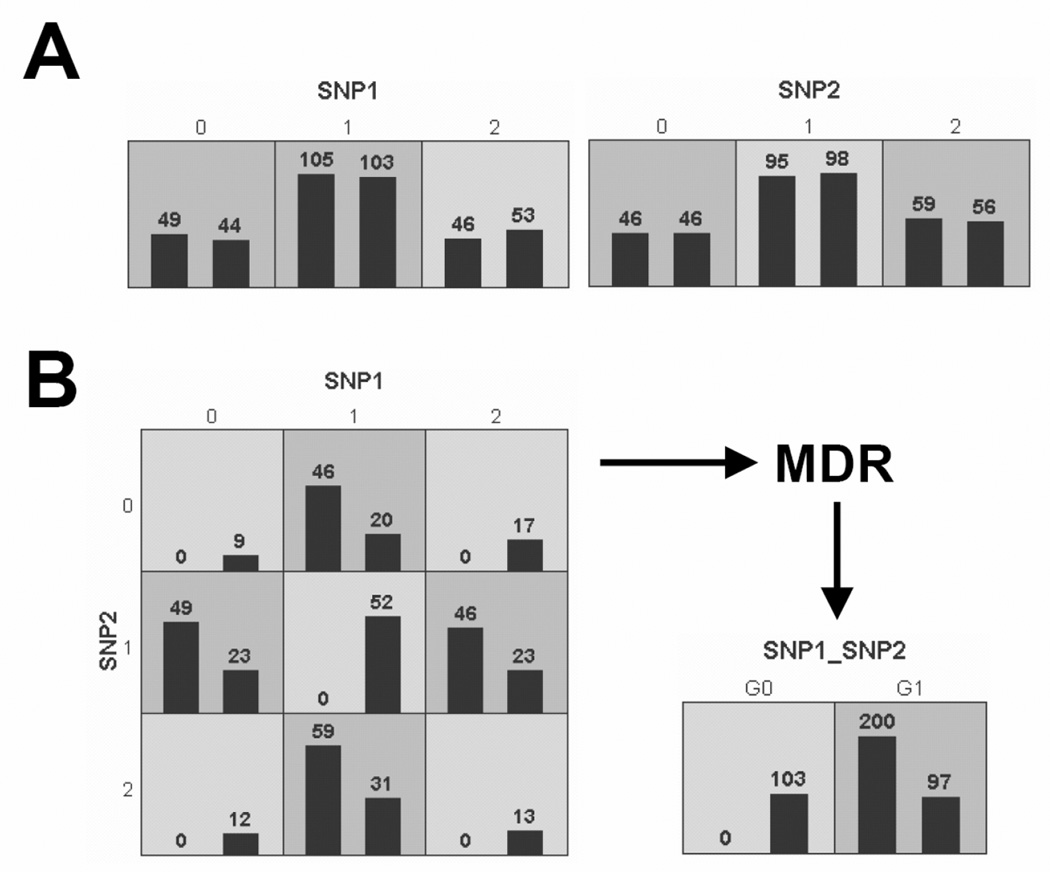
MDR attribute construction. A) illustrates distribution of cases (left bars) and controls (right bars) for each of the three genotypes of SNP1 and SNP2. The dark-shaded cells have been labeled “high-risk” using a threshold of T = 1. The light-shaded cells have been labeled “low-risk”. B) illustrates the distribution of cases and controls when the two functional SNPs are considered jointly. A new single attribute is constructed by pooling the “high-risk” genotype combinations into one group (G1) and the low-risk” into another group (G0).
Table I.
Penetrance values for a two locus M170 epistatic model
| (0.25)AA | (0.50)Aa | (0.25)aa | |
|---|---|---|---|
| (0.25)BB | 0.0 | 0.1 | 0.0 |
| (0.50)Bb | 0.1 | 0.0 | 0.1 |
| (0.25)bb | 0.0 | 0.1 | 0.0 |
Genotype frequencies labeled in parentheses
We used a simple probabilistic classifier that is similar to naïve Bayes [Hahn and Moore, 2004] to model the relationship between variables constructed using MDR and case-control status. Naïve Bayes classifiers were assessed using balanced accuracy as recommended by [Velez et al., 2007]. Balanced accuracy is defined as the arithmetic mean of sensitivity and specificity:
where TP are true positives, TN are true negatives, FP are false positives, and FN are false negatives. For each dataset we evaluated all possible pairwise combinations of SNPs using MDR. The model that is developed and evaluated on the remaining test set that has the maximum testing accuracy averaged over the ten-fold cross validation and also has the maximum cross-validation consistency (CVC) as described previously is selected as the best model [Ritchie et al., 2001; Hahn et al., 2003; Ritchie et al., 2003; Moore, 2004]. Cross-validation consistency is the number of times out of n cross-validation intervals that the selected best model had the maximum testing accuracy. It is often the case that the best model will have the maximum testing accuracy and the maximum CVC. However, it is sometimes the case that another model has the highest CVC. When there is disagreement, the more parsimonious model with the higher CVC can be selected. An open-source MDR software package is freely available from www.epistasis.org. A tutorial on MDR can be found in the November and December 2006 postings at compgen.blogspot.com.
Hypothesis Testing using Permutation Testing
Permutation testing is commonly used to assess the statistical significance when the distribution of the test statistic needs to be empirically derived [Good, 2000]. Permutation testing is used with MDR to assess the statistical significance of the testing accuracy of the best model (i.e. model with the maximum testing accuracy). Here, case-control labels of a given dataset are randomized on the order of a thousand times and the complete MDR model fitting procedure is run on each permuted dataset. An empirical distribution of the maximum testing accuracy for each run is then used to estimate a P-value for MDR model derived from the original data. The power of MDR using a 1000-fold permutation test was estimated as the percentage of times MDR correctly identified the two functional SNPs (i.e. the pairwise combination with the maximum testing accuracy) out of each set of 100 datasets for which the result was statistically significant at the 0.05 level (i.e. the testing accuracy was equal to or higher than the top 5% highest testing accuracies in the permuted data). Type I error was estimated as the proportion of times that the permutation test indicated a statistically significant MDR model in data consistent with the null hypothesis of no association. An MDR Permutation Testing software package is freely available from www.epistasis.org.
Hypothesis Testing using an Extreme Value Distribution (EVD)
Our goal was to develop a hypothesis test for MDR that is based on permutation testing but that requires many fewer permutations. The end result of an MDR analysis is the selection of an overall best model with the highest testing accuracy. Since the testing accuracy of the best model is a maximum value, we suspect that it might follow an extreme value distribution (EVD), even though, in general, the tests might not be independent and identically distributed (IID) as we describe below. Coles [2001] describes three EVDs labeled Gumbel, Fréchet, and Weibull. Each of these distributions has a location parameter (μ) and a scale parameter (σ). The Fréchet and Weibull distributions are further characterized by a shape parameter (α). The extremal types theorem [Coles, 2001] allows these three distributions to be combined into a single family of models, known as the generalized extreme value distribution (GEV) having distribution functions of the form:
where ξ is a shape parameter that applies specifically to the GEV such that −∞ < ξ < ∞. When ξ=0, this generalized extreme value distribution simplifies to the Gumbel distribution with form:
We fit extreme value distributions to the distribution of the MDR testing accuracies generated from 20-, 10-, and 5-fold permutation testing using the EVD package in R. We first estimated the mean of the shape parameter ξ across all datasets and determined that this value was not significantly different from 0 (data not shown). We also observed that the (μ) and (σ) were similar across the 100 replicates for each model, allowing us to fit the distribution to the permutations from one replicate per model (data not shown). Thus, for our simulated data, we used the Gumbel distribution as our EVD for all hypothesis testing with parameters μ and σ estimated from the data.
To compare the p-values estimated using the EVD test to those estimated from permutation testing, we evaluated the number of times MDR correctly identified the two functional SNPs out of each set of 100 datasets and this result was statistically significant at the 0.05 level. Type I error was estimated with the null data sets as the proportion of times that the EVD test indicated a statistically significant MDR model in data consistent with the null hypothesis of no association.
An important assumption of EVD is that the observations are independent and identically distributed (IID). To test this assumption we examined a subset of the simulated artificial data using quantile-quantile (Q-Q) plots. Supplemental Figures 1 and 2 illustrate the relationship between observed and expected extreme value quantiles from 100 datasets simulated under the same epistasis model across different sample sizes for 20 SNPs and 1000 SNPs, respectively. Note that there are no major deviations from linearity suggesting that the EVD is appropriate for these data. Datasets with high linkage disequilibrium and/or numerous main effects may violate the IID assumption of the EVD since these phenomena could generate correlations among MDR models. To account for this possibility, we used Q-Q plots to examine the pseudo-artificial data (described above) which contains an independent effect, an epistatic effect or both an independent and epistatic effect in the presence of significant linkage disequilibrium. Supplemental Figures 3A, 3B and 3C show that there is no major deviation from linearity in the Q-Q plots for any of the models.
Although the simulated artificial data and the pseudo-artificial data do not seem to violate the IID assumptions, it is important to keep in mind that this could be a problem for other real datasets. Fortunately, a number of mathematical extensions to the EVD exist that are more robust to violations of the IID assumption [see Coles 2001]. Many of these extensions were developed for time series data where there is often significant autocorrelation. A detailed description for modeling stationary time series is given by [Coles 2001] that has been more precisely described and developed by [Leadbetter et al. 1983]. Another issue that arises is in threshold models where exceedences are seen to occur in groups. The more widely accepted method to deal with this issue is declustering, where the maxima in each cluster are filtered and fit to a Pareto distribution. This method, however, is sensitive to the loss of data due to arbitrary choices in cluster determination and selection of only the maxima in each cluster. In the case of non-stationary time series different approaches that use extreme value models as basic templates apply. This may include adding a linear trend component to the location parameter to explain variation, in that case a linear trend, in the data. The basic principle behind these approaches is to fit the simplest model that explains as much variation in the data as possible and to use modified diagnostics to ensure the fit of these models. This process is also described more in more detail by [Cole 2001]. We have not yet determined which, if any, of these approaches would be appropriate for MDR or data where SNPs are correlated, but this would be an area of investigation to consider for future studies.
Bladder Cancer Data
We demonstrated EVD by applying it to a genetic epidemiology study that examined the relationship between DNA repair gene SNPs, smoking, and bladder cancer susceptibility that was previously analyzed using MDR and a 1000-fold permutation test [Andrew et. al., 2006]. The study analyzed 355 bladder cancer cases and 559 controls ascertained from the state of New Hampshire. Using MDR along with other methods of analysis, Andrew et al. [2006] identified a 3-way interaction model between XPD codon 751 and 312 SNPs and smoking as being the best predictor of bladder cancer susceptibility with a testing accuracy of 0.63. They statistically evaluated this model with a 1000-fold permutation test and determined these results to be highly significant (p<0.001). When fitting the GEV we observed that the shape parameter ξ was −0.42, not 0, and so we determine the p-value for this three factor model using the GEV distribution estimated from 20 permutations of the data. To determine a more precise p-value for the permutation test, we conducted a 100,000-fold permutation of this data. This allowed for a more direct comparison with the p-value derived from the EVD.
RESULTS
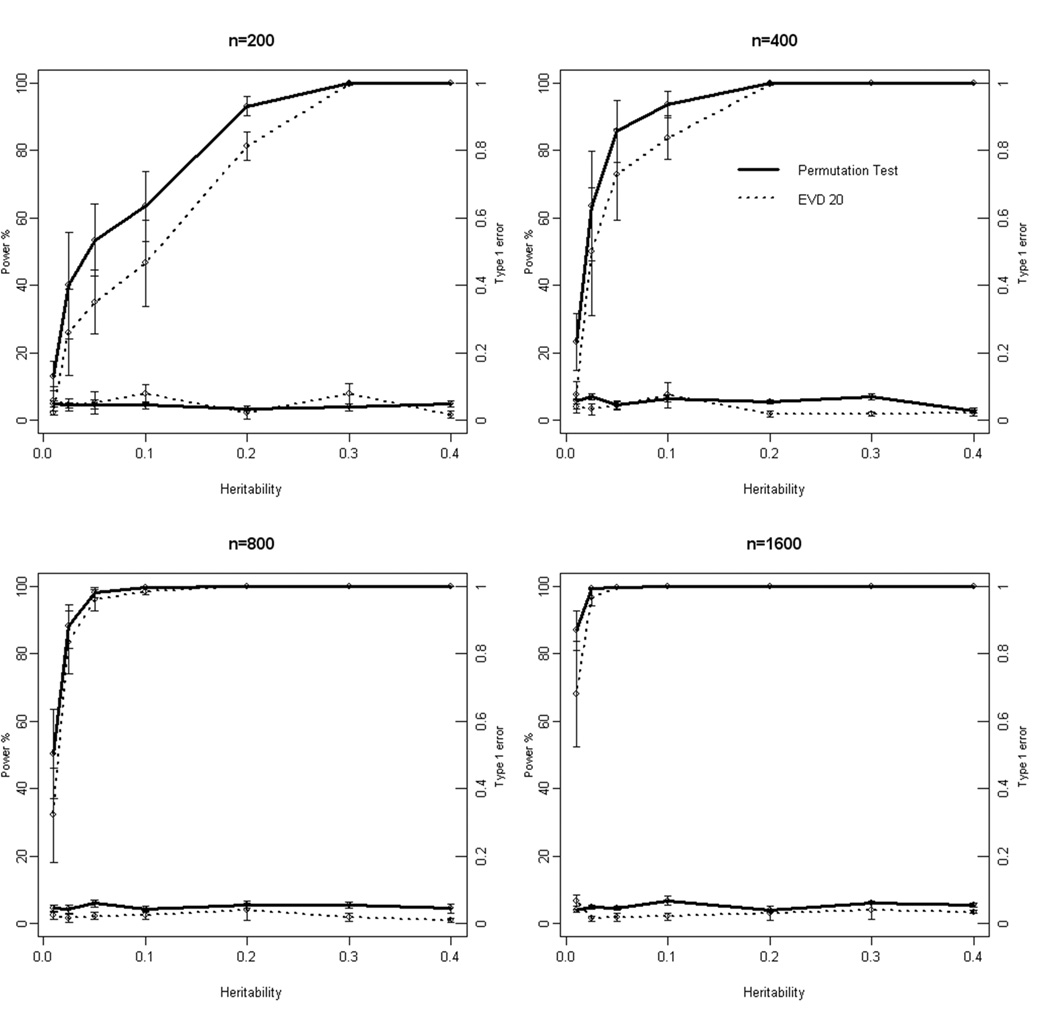
Figure 2 illustrates the average power and type I error of MDR using the Gumbel EVD estimated from 5, 10, and 20 permutations of the data. Results are averaged across all epistasis models for each heritability. Results are only shown for models with a minor allele frequency (MAF) of 0.4. Results for models with a MAF of 0.2 were nearly identical and are thus not shown. The power of MDR using EVD estimated from 5, 10, or 20 permutations is approximately the same across all sample sizes. As expected, the power increases with heritability and sample size. These results are consistent with previous power studies for MDR [e.g. Velez et al. 2007]. However, the type I error using the EVD test was higher and inconsistent under 5 and 10 permutations (see Figure 2) whereas the type I error using EVD estimated from 20 permutations is consistently close to 0.05. Results from estimating the Gumbel distribution with more than 20 permutations were the same as with 20 and are thus not shown. These results suggest that a minimum of 20 permutations is necessary to maximize power and to maintain the size of the test at 0.05.
Figure 2.

Comparison of the power (upper lines) and type I error (lower lines) of MDR using then Gumbel EVD estimated from 5, 10, and 20 permutations. Results are shown in separate panels for each sample size (200, 400, 800, and 1600). Heritabilities are represented on the x-axis. The power using Gumbel EVD estimated from 5, 10, and 20 permutations is represented on the left hand y-axis while the type 1 error is represented on the right hand y-axis. Note that the power and type I error is best for the EVD estimated from 20 permutations.
Figure 3 illustrates the average power and type I error of MDR using the Gumbel EVD estimated from 20 permutations of the data and the 1000-fold permutation test. Results are averaged across all epistasis models for each heritability. Again, results are only shown for models with a MAF of 0.4. Note that when comparing the two tests, power and type I error are very similar across the different heritabilities and sample sizes. The only noted difference is a slight reduction in power using the EVD test in the smallest sample size considered (100 cases and 100 controls). A complete list of the results for all models and MAFs can be found in the online supplementary tables.
Figure 3.
Comparison of the power (upper lines) and type I error (lower lines) of MDR using 1000-fold permutation test and the Gumbel EVD estimated from 20 permutations. Results are shown in separate panels for each sample size (200, 400, 800, and 1600). Heritabilities are represented on the x-axis. The power using 1000-fold permutation test and the Gumbel EVD estimated from 20 permutations is represented on the left hand y-axis while the type 1 error is represented on the right hand y-axis. Note that the power and type I error using the EVD-based test closely approximates that of the 1000-fold permutation test, especially for the larger sample sizes.
Table 2 shows the average power and type 1 error of MDR using the Gumbel EVD and 1000-permutation test for our larger 1000 SNP data set. Results are averaged across the five models that represent a heritability of 0.1 and a MAF of 0.4. Both EVD and permutation testing are comparable in MDR power with an increasing trend in power across sample sizes. As expected, we see a slight reduction in power from our 20 SNP data. While the type 1 error using permutation tests is similar to that seen for our 20 SNP data, it is slightly higher when using EVD and also slightly higher than the type 1 error seen in our 20 SNP analyses.
Table II.
Power and type 1 error of MDR using EVD and 1000-fold permutation testing applied to a 1000 SNP data set with MAF 0.4 and a heritability of 0.1.
| Sample Size | EVD Power | S.E. ± | EVD Type1 Error | S.E.± | Perm. Power | S.E.± | Perm. Type 1 Error | S.E.± |
|---|---|---|---|---|---|---|---|---|
| 200 | 29.2 | 12.03 | 8.6 | 2.70 | 25.6 | 8.59 | 4.8 | 0.97 |
| 400 | 78 | 9.76 | 6.8 | 2.92 | 65.4 | 13.09 | 5.6 | 0.67 |
| 800 | 99.2 | 0.49 | 5.2 | 1.88 | 98.6 | 0.98 | 3.6 | 0.51 |
| 1600 | 100 | 0 | 6.8 | 1.74 | 100 | 0 | 3.8 | 0.73 |
We next applied the EVD test to the MDR analysis of a previously published bladder cancer dataset [Andrew et al. 2006]. MDR analysis of the data indicated a best model consisting of two SNPs in the XPD gene and pack years of smoking. This model had a testing accuracy of 0.63. Interpretation of this model by Andrew et al. [2006] indicated a synergistic interaction between the two XPD polymorphisms. The effect of smoking was additive. A 1000-fold permutation test indicated that the p-value of the testing accuracy was less than 0.001. A 100,000-fold permutation test indicated that p< 0.00001. We also found this model to be highly significant when fitting the GEV to 20 permutations of this data (p<0.00001). Thus, the two statistical tests demonstrate that the MDR result is highly significant with p-values of similar magnitude at the given resolution.
DISCUSSION
Our goal in this study was to develop and evaluate a computationally efficient method of hypothesis testing that is comparable to permutation testing for the assessment of the statistical significance of MDR models. We conclude that, dependent on the shape parameter, either the Gumbel EVD or the GEV distribution estimated from the distribution of MDR testing accuracies generated from 20 permutations is a reasonable alternative to 1000-fold permutation testing. Further, we have demonstrated that the EVD method and 1000-fold permutation testing generate similar results in a previously analyzed bladder cancer susceptibility study [Andrew et al. 2006]. We showed that hypothesis testing using the Gumbel EVD or the GEV is a viable alternative to large-scale permutation testing because it preserves both the power and size of MDR. Further, a statistical test based on 20 permutations is 50 times faster than a 1000-fold permutation test and 500 times faster than 10000-fold permutation test. This means that a permutation test that might take 50 days to run will now run in a single day.
The rapid growth and availability of high-dimensional datasets from genome-wide studies makes it computationally expensive and impractical to routinely carry out large-scale permutation testing to assess the statistical significance of data mining methods such as MDR. To illustrate the intensity of the analysis alone, consider that the report from the International HapMap Consortium [Altshuler et al., 2005] suggests that approximately 300,000 carefully selected SNPs may suffice to represent most of the relevant genetic variation across the human Caucasian genome. If this is to be regarded as the lower limit of a genome-wide association study, then approximately 4.5 × 10¹⁰ pairwise combinations (300,000 choose 2) and 4.5 × 10¹⁵ three-way combinations (300,000 choose 3) would need to be exhaustively analyzed to detect low-order epistasis using MDR. If 106 MDR evaluations can be computed each second, then evaluation of each individual SNP would require less than one second of computer time. However, computing all two-way and three-way MDR models would require more than 52,000 days of computer time. Access to a 1,000 processor supercomputer might reduce this to 52 days which is within the realm of possibility. However, then running a 1000-fold permutation test would not be feasible. This is only one of many challenges for detecting epistasis on a genome-wide scale [Ritchie and Moore, 2004].
We are not the first to suggest using the EVD to reduce the number of permutations necessary to determine statistical significance for genetic and genomic studies. For example, Dudbridge and Koeleman [2004] noted that it is becoming more common and feasible to conduct large-scale screens for disease associations, genome-wide linkage disequilibrium scans, and array-expression experiments. They recognized that these studies encounter issues concerning correlated data that are addressed by permutation testing which, as we have discussed, can be computationally impractical. Similarly, they propose a solution to this problem that suggests that analytic distributions, such as an EVD, can be fit to permutation distributions. They use genome-wide SNP data released by the International HapMap consortium to compare the efficiency and accuracy of their method to permutation testing and find that their method demonstrates both adequate accuracy and a 40% reduction in computation. Our results support their conclusions.
A challenging goal in human genetics is to determine which of the many thousands of SNPs are useful for predicting who is at risk for common diseases. It was nearly a decade ago that Risch and Merikangas first seriously proposed the testing of all known SNPs in the human genome for disease association either directly or by linkage disequilibrium with other SNPs [Risch and Merikangas, 1996]. Today it is possible to measure more than one million SNPs with widely available human SNP arrays. Unfortunately, there is a lack of powerful methodology to summarize and interpret this quantity of information within a biological context. Thus, our ability to measure genetic information, and biological information in general, is far outpacing our ability to interpret it [Moore and Williams, 2002]. In the current study, we primarily address the computational efficiency of large-scale genetic analyses of epistasis. However, another important concern with conducting these analyses with a method such as MDR is that there may be a certain amount of important information potentially lost by limiting results to one best model. An interesting future direction would be to develop hypothesis testing methods that are able to identify a best set of statistically significant MDR models rather than a single best model. The EVD could certainly be used to investigate the significance of a second-best model, a third best model, etc. As an additional goal, it would be nice to move away from permutation testing entirely. For example, it might be useful to develop a hypothesis testing approach based on the cross-validation results. These types of computationally efficient hypothesis testing methods are critical for the analysis of epistasis in genome-wide association studies.
Supplementary Material
ACKNOWLEDGEMENTS
This publication was funded in part by National Institute of Health grants LM009012, AI59694, CA099500, CA82354, CA57494, ES00002, ES05947, RR018787, and ES07373. We would like to thank the anonymous reviewers for their very thoughtful critiques and suggestions that greatly improved the paper.
REFERENCES
- Altshuler D, Brooks LD, Chakravarti A, Collins FS, Daly MJ, Donnelly MJ. A haplotype map of the human genome. Nature. 2005;437:1299–1320. doi: 10.1038/nature04226. [DOI] [PMC free article] [PubMed] [Google Scholar]
- Andrew AS, Nelson HN, Kelsey KT, Moore JH, Meng A, Casella DP, Tosterson TD, Schned AR, Karagas MR. Concordance of multiple analytical approaches demonstrates a complex relationship between DNA repair gene SNPs, smoking, and bladder cancer susceptibility. Carcinogenesis. 2006;27:1030–1037. doi: 10.1093/carcin/bgi284. [DOI] [PubMed] [Google Scholar]
- Bateson W. Mendel’s Principles of Heredity. Cambridge: Cambridge University Press; 1909. [Google Scholar]
- Coles S. An introduction to statistical modeling of extreme values. London: Springer – Verlag; 2001. [Google Scholar]
- Cordell HJ. Epistasis: what it means, what it doesn’t mean, and statistical methods to detect it in humans. Hum Mol Genet. 2002;11:2463–2468. doi: 10.1093/hmg/11.20.2463. [DOI] [PubMed] [Google Scholar]
- Dudbridge F, Koeleman BPC. Efficient computation of significance levels for multiple associations in large studies of correlated data, including genomewide association studies. Am J Hum Genet. 2004;75:424–435. doi: 10.1086/423738. [DOI] [PMC free article] [PubMed] [Google Scholar]
- Fisher RA. The correlation between relatives on the supposition of Mendelian inheritance. Trans R Soc Edinburgh. 1918;52:399–433. [Google Scholar]
- Good PI. Permutation tests: a practical guide to resampling methods for testing hypothesis. New York: Springer-Verlag; 2000. [Google Scholar]
- Gumbel EJ. Statistics of extremes. New York: Columbia Univeristy Press; 1958. [Google Scholar]
- Hahn LW, Ritchie MD, Moore JH. Multifactor dimensionality reduction software for detecting gene-gene and gene-environment interactions. Bioinformatics. 2003;19:376–382. doi: 10.1093/bioinformatics/btf869. [DOI] [PubMed] [Google Scholar]
- Hahn LW, Moore JH. Ideal discrimination of discrete clinical endpoints using multilocus genotypes. Silico Biol. 2004;4:0016. [PubMed] [Google Scholar]
- Li W, Reich J. A complete enumeration and classification of two-locus disease models. Hum Hered. 2000;50:334–349. doi: 10.1159/000022939. [DOI] [PubMed] [Google Scholar]
- Michalski RS. A theory and methodology of inductive learning. Artif Intel. 1983;20:111–161. [Google Scholar]
- Moore JH, Williams SM. New strategies for identifying gene-gene interactions in hypertension. Ann Med. 2002;34:88–95. doi: 10.1080/07853890252953473. [DOI] [PubMed] [Google Scholar]
- Moore JH. The ubiquitous nature of epistasis in determining susceptibility to common human diseases. Hum Hered. 2003;56:73–82. doi: 10.1159/000073735. [DOI] [PubMed] [Google Scholar]
- Moore JH. Computational analysis of gene-gene interactions in common human diseases using multifactor dimensionality reduction. Expert Rev Mol Diagn. 2004;4:795–803. doi: 10.1586/14737159.4.6.795. [DOI] [PubMed] [Google Scholar]
- Moore JH. A global view of epistasis. Nat Genet. 2005;37:13–14. doi: 10.1038/ng0105-13. [DOI] [PubMed] [Google Scholar]
- Moore JH, Williams SM. Traversing the conceptual divide between biological and statistical epistasis: Systems biology and a more modern synthesis. BioEssays. 2005;27:637–646. doi: 10.1002/bies.20236. [DOI] [PubMed] [Google Scholar]
- Moore JH, Gilbert JC, Tsai CT, Chiang FT, Holden W, Barney N, White BC. A flexible computational framework for detecting, characterizing, and interpreting statistical patterns of epistasis in genetic studies of human disease susceptibility. J Theor Biol. 2006;241:252–261. doi: 10.1016/j.jtbi.2005.11.036. [DOI] [PubMed] [Google Scholar]
- Moore JH. Genome-wide analysis of epistasis using multifactor dimensionality reduction: feature selection and construction in the domain of human genetics. In: Zhu X, Davidson I, editors. Knowledge Discovery and Data Mining: Challenges and Realities with Real World Data. Hershey: IGI Press; 2007. pp. 17–30. [Google Scholar]
- Nagel RL. Epistasis and the genetics of human diseases. C R Biol. 2005;328:606–615. doi: 10.1016/j.crvi.2005.05.003. [DOI] [PubMed] [Google Scholar]
- Pesarin F. Multivariate permutation tests with applications in biostatistics. Chichester, UK: Wiley; 2001. [Google Scholar]
- Rea TJ, Brown CM, Sing CF. Complex adaptive system models and the genetic analysis of plasma HDL-cholesterol concentration. Perspect Biol Med. 2006;49(4):490–503. doi: 10.1353/pbm.2006.0063. [DOI] [PMC free article] [PubMed] [Google Scholar]
- Ritchie MD, Hahn LW, Roodi N, Bailey LR, Dupont WD, Parl FF, Moore JH. Multifactor dimensionality reduction reveals high-order interactions among estrogen metabolism genes in sporadic breast cancer. Am J Hum Genet. 2001;69:138–147. doi: 10.1086/321276. [DOI] [PMC free article] [PubMed] [Google Scholar]
- Ritchie MD, Hahn LW, Moore JH. Power of multifactor dimensionality reduction for detecting gene-gene interactions in the presence of genotyping error, missing data, phenocopy, and genetic heterogeneity. Genet Epidemiol. 2003;24:150–157. doi: 10.1002/gepi.10218. [DOI] [PubMed] [Google Scholar]
- Risch NJ, Merikangas KR. The future of genetic studies of complex human disease. Science. 1996;273:1516–1517. doi: 10.1126/science.273.5281.1516. [DOI] [PubMed] [Google Scholar]
- Sing CF, Stengard JH, Kardia SL. Genes, environment, and cardiovascular disease. Arterioscler Thromb Vasc Biol. 2003;23:1190–1196. doi: 10.1161/01.ATV.0000075081.51227.86. [DOI] [PubMed] [Google Scholar]
- Stevenson AG. EVD: extreme value distributions. R News. 2002;2:31–32. [Google Scholar]
- Templeton AR. Epistasis and complex traits. In: Wade M, Brodie B III, Wolf J, editors. Epistasis and Evolutionary Process. NewYork: Oxford University Press; 2000. [Google Scholar]
- Thornton-Wells TA, Moore JH, Haines JL. Genetics, statistics, and human disease: Analytical retooling for complexity. Trends Genet. 2004;20:640–647. doi: 10.1016/j.tig.2004.09.007. [DOI] [PubMed] [Google Scholar]
- Velez DR, White BC, Motsinger AA, Bush WS, Ritchie MD, Williams SM, Moore JH. A balanced accuracy metric for epistasis modeling in imbalanced datasets using multifactor dimensionality reduction. Genet Epidemiol. 2007;31:306–315. doi: 10.1002/gepi.20211. [DOI] [PubMed] [Google Scholar]
Associated Data
This section collects any data citations, data availability statements, or supplementary materials included in this article.