

Abstract
During the acute phase response (APR), cytokines induce marked alterations in lipid metabolism including an increase in serum triglycerides, a decrease in hepatic fatty acid oxidation, a decrease in bile acid synthesis, and a decrease in HDL. Here we demonstrate that TNF and IL-1, but not IL-6, decrease the expression of RXRα, PPARα, PPARγ, LXRα and coactivators PGC-1α, PGC-1β and SRC-1 in Hep3B human hepatoma cells. Additionally, treatment of mice with TNF and IL-1 also decreased RXRα, PPARα, PPARγ, LXRα, and PGC-1α mRNA levels in the liver. These decreases were accompanied by reduced binding of nuclear extracts to RXR, PPAR, and LXR response elements and decreased luciferase activity driven by PPAR and LXR response elements. In addition, the mRNA levels of proteins regulated by PPARα (CPT 1α) and LXR (SREBP-1c) were decreased in Hep 3B cells treated with TNF or IL-1. Finally, using constructs of the LXRα promoter or the PGC-1α promoter linked to luciferase we were able to demonstrate that a decrease in transcription contributes to the reduction in mRNA levels of nuclear hormone receptors and coactivators. Thus, our results suggest that decreased expression of nuclear hormone receptors RXRα, PPARα, PPARγ, and LXRα, as well as coactivators PGC-1α, PGC-1β, and SRC-1 may contribute to the cytokine induced alterations in hepatic lipid metabolism during the APR.
Keywords: Acute-phase response, fatty acid, triglyceride, cytokine, nuclear hormone receptor
Introduction
The acute phase response (APR), which is induced by infection, inflammation, injury, and stress, results in marked alterations in the synthesis of proteins in the liver (1). The synthesis of certain proteins, for example C-reactive protein and serum amyloid A, is increased, (positive acute phase response proteins), whereas the synthesis of other proteins, for example albumin, is decreased (negative acute phase proteins) (2, 3). In addition to changes in hepatic protein synthesis, the acute phase response also induces alterations in hepatic lipid and lipoprotein metabolism including hypertriglyceridemia (4), decreases in serum HDL cholesterol levels (5, 6), inhibition of bile acid synthesis (7), and decreases in hepatic fatty acid oxidation and ketogenesis (6, 8). Most of the changes that occur during the acute phase response result from the increased production of cytokines, particularly TNFα, IL-1, and IL-6, which mediate these alterations by regulating gene transcription. While the mechanisms by which cytokines increase the expression of positive acute phase proteins has been extensively studied (9, 10), the regulation of the negative acute phase proteins is less well understood.
Nuclear hormone receptors form a large family of transcription factors that regulate many aspects of intermediary metabolism (11, 12). Class II nuclear hormone receptors heterodimerize with retinoid X receptor (RXR) and include the retinoic acid receptors, thyroid hormone receptors, vitamin D receptor, farnesoid X receptors, liver X receptors (LXR), and peroxisome proliferator-activated receptors (PPARs) (11, 13, 14). PPARs, FXR and LXRα have been shown to play major roles in the regulation of the expression of proteins involved in various aspects of lipid and lipoprotein metabolism. Activation of PPARα stimulates hepatic fatty acid oxidation by increasing the expression of a number of genes important in fatty acid metabolism including acyl-CoA synthetase (15), carnitine palmitoyl-transferase I (16-18), acyl-CoA oxidase, fatty acid transport protein (15), and fatty acid binding protein (19). Fatty acids and products of the cholesterol biosynthetic pathway activate PPARs (20, 21). Activation of LXR stimulates the expression of key enzymes required for bile acid synthesis, the transporters that secrete cholesterol into bile, and the transcription factor SREBP-1c that regulates many of the enzymes that synthesize fatty acids (12, 22). Oxidized cholesterol derivatives activate LXR (22). Recently, the concept that these nuclear hormone receptors are liposensors monitoring the intracellular levels of various lipids and then modulating the expression of key proteins involved in lipid metabolism to maintain homeostasis has been proposed (12).
Hepatic expression of many of the target genes for PPARs and LXR decrease during the acute phase response (23-28). We therefore postulated that decreases in RXRα, the obligate heterodimer partner and/or PPARs and LXRs occur during the acute phase response. We have shown that LPS administration to Syrian hamsters results in a decrease in hepatic mRNA and/or protein levels of RXRα, β, and γ, PPARα and γ, and LXRα (25). Additionally, hepatic nuclear extracts obtained from animals treated with LPS exhibited reduced binding activity to RXR-RXR, RXR-PPAR, and RXR-LXR response elements (REs) (25). Moreover, previous studies by other investigators have shown that the administration of LPS to mice or the treatment of HepG2 cells with IL-1β results in the increased transport of RXRα from the nucleus to the cytoplasm where it would not be capable of forming dimers with PPARα and LXR and thereby stimulating transcription (29, 30). A reduction in hepatic nuclear RXR levels alone or in combination with decreases in PPARs or LXRs could contribute to the decrease in the expression of multiple genes involved in lipid metabolism during the acute phase response.
In addition to regulation at the level of nuclear hormone receptors, there are other factors such as coactivators and corepressors that are involved in the regulation of the transcriptional activity of nuclear hormone receptors (31, 32). Coactivators are a class of transcriptional regulators that do not bind DNA directly, but enhance transcription while corepressors inhibit transcription. The binding of ligand to nuclear hormone receptors increases the affinity of the DNA-bound nuclear receptors for coactivators and decreases affinity for corepressors, thereby enhancing gene transcription by modifying the chromatin structure of the target gene or by associating with the RNA polymerase machinery (33, 34). It has been shown that cellular levels of coregulators are crucial for nuclear receptor-mediated transcription (35-37) and many coregulators have been demonstrated to be targets for diverse intracellular signaling pathways and post-translational modifications (33, 34, 38). Given the array of metabolic changes that occur during infection and inflammation, it is also possible that the expression of coactivators and/or corepressors is regulated during the acute phase response.
In the present study, we hypothesized that inflammatory cytokines, TNF, IL-1, or IL-6 exert their effects directly on the hepatocytes and suppress transcriptional activity of PPAR and LXR by decreasing expression of RXR, PPARα, and LXRα and coregulators contributing to the alterations in lipid metabolism the occur during the APR.
Materials and Methods
Materials
LPS (Escherichia coli 55:B5) was obtained from Difco Laboratories. Cytokines (hTNFα, hIL-1β, hIL-6, mTNFα, and mIL-1β) were from R&D Systems. MEM was purchased from Fisher Scientific. For in vivo studies, LPS or cytokines were freshly diluted to desired concentrations in pyrogen-free 0.9% saline. For in vitro studies, LPS or cytokines were freshly diluted to the desired concentration in serum-free MEM media containing 0.1% bovine serum albumin (fatty acid-free). Pyrrolidinecarbodithioc acid (PDTC) was obtained from Calbiochem. Tri-Reagent, WY-14, 643, and fatty acid-free bovine serum albumin were from Sigma. [α-32P] dCTP (3,000 Ci/mmol) and [γ-32P] dATP (3,000 Ci/mmol) were purchased from NEN Life Science Products.
Cell Cultures
Hep3B cells were maintained in MEM medium supplemented with 10% fetal bovine serum (FBS) in 75 cm2 flasks. Cells were washed twice with PBS (Ca++ and Mg++ free), and trypsinized before seeding. For typical experiments, cells were seeded in 100 mm dishes at a concentration of 2 × 10⁶ cells per dish. After an overnight incubation, cells were washed twice with PBS and medium replaced with fresh serum-free MEM plus 0.1% bovine albumin and the appropriate cytokine or LPS concentration. For some experiments PDTC was diluted to10 μM in fresh serum-free MEM plus 0.1% bovine albumin. Cell morphology and viability were not affected by cytokine treatment as assessed by trypan blue staining. For transfection assays, 1.5 × 10⁵ cells were used per well in 6-well plates.
Animals
Eight-week-old female C57BL/6 mice were purchased from Jackson Laboratory (Bar Harbor, ME). The animals were maintained in a normal light-cycle room and were provided with rodent chow and water ad libitum. Anesthesia was induced with halothane. To determine the effect of APR on PGC-1α, PGC-1β and SRC 1 mRNA levels, mice were injected IP with 100 μg of LPS, 100 ng of TNF, or 80 ng of IL-1 in saline or with saline alone. Food was withdrawn at the time of injection since LPS and cytokines induce anorexia in rodents (7). Livers were removed at the time indicated in the text after treatment. The doses of LPS or cytokines used in this study have significant effects on triglyceride and cholesterol metabolism (7), but are not lethal as the LD50 for LPS in rodents is approximately 5 mg/100 g body weight.
Preparation of Cell Extracts
Nuclear extracts were prepared according to Neish et al. (39). Briefly, cells were disrupted in a sucrose-HEPES buffer containing 0.5% Nonidet-P40 as a detergent, protease inhibitors and DTT. After disruption by 5 min incubation on ice and centrifugation, nuclear proteins were separated in a NaCl-HEPES buffer and re-suspended in a glycerol-containing buffer. Total cell lysates were prepared according to Santa Cruz Biotechnology Western Blotting Protocol. Briefly, cells were washed once with PBS, scraped into 0.6ml RIPA buffer, then incubated for 1 hour with rocking. Lysates were then centrifuged at 10,000×g for 15 minutes and supernatant is retained as total cell lysate. All the procedures were carried out on ice. Protein quantification was determined by the Bradford assay (Bio Rad), and yields were similar in control and cytokine-treated groups.
Western Blot Analysis
Denatured nuclear protein (10 μg) or denatured total cell lysate (40 μg) was loaded onto 10% polyacrylamide precast gels (Bio-Rad) and subjected to electrophoresis. After electrotransfer onto polyvinylidene difluoride membrane (Amersham Pharmacia Biotech), blots were blocked with phosphate-buffered saline containing 0.1% Tween and 5% dry milk for 1 h at room temperature and incubated for 1 h at room temperature with polyclonal anti-RXRα (Santa Cruz Biotechnology) at a dilution of 1:5000 or polyclonal anti PGC-1α (Chemicon International) at a dilution of 1:1000. Immune complexes were detected using the appropriate second antibody linked to horse radish peroxidase according to the ECL Plus Western blotting kit (Amersham Pharmacia Biotech). Immunoreactive bands obtained by autoradiography were quantified by densitometry. Other antibodies tried were polyclonal anti PPARα (Affinity Bioreagents), polyclonal anti-PPARγ and polyclonal anti-SRC-1 (Santa Cruz Biotechnology), and monoclonal anti-LXRα (R&D Systems).
RNA isolation and Northern Blot Analysis
Total RNA was isolated from a 100 mm dish by the Tri-Reagent method, and re-suspended in DEPC-water. RNA was quantified by measuring the absorption at 260 nm. 20 μg of total RNA was denatured and electrophoresed on a 1% agarose/formaldehyde gel. The uniformity of sample loading was checked by UV visualization of the ethidium bromide-stained 18S and 28S bands before electrotransfer to Nytran membrane (Schleicher & Schuell). Prehybridization, hybridization and washing procedures were performed as described previously (24). Membranes were probed with [α-32P] dCTP labeled cDNAs using the random priming technique. mRNA levels were detected by exposure of the membrane to X-ray film and quantified by densitometry. Because traditional house-keeping genes, (actin, GAPDH, and cyclophillin) change during the acute phase response, we did not normalize these data. The responses are specific as we and others have shown that many genes increase while others decrease. hRXRα cDNA was a gift from Dr. Daniel D. Bikle (University of California, San Francisco, CA). rPPARs (α, β, and γ) cDNAs were a gift from Dr. Anthony Bass (University of California, San Francisco, CA). Other mouse and human cDNAs were prepared by PCR using the primers shown in Table 1A.
Table 1.
| A Primer sequences used for generation of cDNA probes for Northern blotting | |||
|---|---|---|---|
| Gene | Accession No. | Forward Primers (5’-3’) | Reverse Primers (5’-3’) |
| CPT1α | NM_001876 | TCGGTACTCTCTGAAGATGGC | GAGCAGAGTGGAATCGGGA |
| SMRT | AF113001 | ACTGGCACCAAGAAACACGAC | GCTGCGAGGTGATGTAGTCATT |
| NCoR | U35312 | CCGTAAGTGGCTATGCTCTTTAC | CCCTCTAAAGGTGCTGACACAG |
| Trap220 | AF283812 | GCAAGGTGTCTCAGAACCC | CCAGCAGCATCTGCAATAAG |
| SRC-1 | U40396 | CCTCAGATGCAGCAGAATGTC | GTGGTTATTCAGTCAGTAGCTG |
| SRC-2 | XM_011633 | GCAACCACTCCTCAGGGTAG | CTGCTGGACTCCTGGCTCAG |
| SRC-3 | NM_008679 | GCGCCAGAGATATGAAACAATGC | GGCTGCCCATCATCTGTACATTC |
| CBP | NM_004380 | CTGCCTCCCAAGCACTGAATC | CAAACAGGACAGTCATGTCGTG |
| PGC-1α | AF049330 | GACCACAAACGATGACCCTCC | GCCTCCAAAGTCTCTCTCAGG |
|
B Primer sequences used for real-time quantitative PCR | |||
| Gene | Accession No. | Forward Primers (5’-3’) | Reverse Primers (5’-3’) |
| mSREBP-1a | NM_011480 | GGCCGAGATGTGCGAAC | GTTGATGAGCTGGAGCATGT |
| mSREBP-1c | NM_011480 | AGCTGTCGGGGTAGCGTCTG | GAGAGTTGGCACCTGGGCTG |
| mSREBP-2 | AF374267 | GCGTTCTGGAGACCATGGA | ACAAAGTTGCTCTGAAAACAAATCA |
| hSREBP-1c | BC063281 | CGGAGCCATGGATTGCAC | CTTCAAGAGAGGAGCTCAATGTGG |
| hPGC-1β | NM_133263 | CCAAGACCAGCAGCTCCTA | CCACTGTCAAGGTCTGCTCA |
| mPGC-1β | NM_133249 | CAAGCTCTGACGCTCTGAAGG | TTGGGGAGCAGGCTTTCAC |
| hRXRα | NM_002957 | GAGACCTACGTGGAGGCAAA | GATGGAGCGGTGGGAGA |
| hLXRα | NM_005693 | CGCACTACATCTGCCACAGT | TCAGGCGGATCTGTTCTTCT |
| hPPARα | NM_005037 | GGTGGACACGGAAAGCCCAC | GGACCACAGGATAAGTCACC |
| hPPARγ | L40904 | CTCATATCCGAGGGCCAA | TGCCAAGTCGCTGTCATC |
| h/m36B4 | M17885 | GCGACCTGGAAGTCCAACTAC | ATCTGCTGCATCTGCTTGG |
Quantitative Real Time PCR
First strand cDNA was synthesized from 1 μg of total RNA with random hexamer primers using the Advantage® RT-for-PCR kit (BD Biosciences Clontech). The real time PCR contained, in a final volume of 20 μl, 20 ng of reverse transcribed total RNA, 300 nM forward and reverse primers, and 10 μl of 2 × SYBR Green PCR Master Mix (Stratagene, La Jolla, CA). PCR was carried out in 96-well plates using M×3000P™ Real-time PCR System (Stratagene, La Jolla, CA). The relative amount of all mRNAs was calculated using the comparative CT method. 36B4 mRNA was used as the invariant control for all experiments. The primers used are shown in Table 1B.
Electrophoretic Mobility Shift Assay
10 μg of crude nuclear extract were incubated on ice for 60 min with 6 × 10⁴ cpm of 32P-labeled oligonucleotides in 15 μl of binding buffer (20% glycerol, 25 mM Tris-HCl pH 7.5, 40 mM KCl, 0.5 mM MgCl2, 0.1 mM EDTA, 1 mM dithiothreitol, 2 ug of poly (dI-dC), and 1 μg of salmon sperm DNA). Double-stranded oligonucleotide probes were end-labeled with T4-polynucleotide kinase (Amersham Pharmacia Biotech) in presence of 50 μCi of [γ-32P] dATP and purified on a Sephadex G-25 column (Amersham Pharmacia Biotech). Labeled oligonucleotides were added to the nuclear extracts and incubated for 30 min on ice prior to electrophoresis. DNA-protein complexes were separated by electrophoresis (constant voltage of 200 V) on a 5% nondenaturing polyacrylamide gel in 0.5x TBE at 4°C. The gel was dried, exposed to X-ray film, and quantified by densitometry. In the competition assay, a 100-fold molar excess of the specific or mutated unlabeled oligonucleotide was preincubated on ice for 1h with 10 μg of nuclear extract from control cells. The following oligonucleotides were used: PPRE, 5’-GAT CCT CCC GAA CGT GAC CTT TGT CCT GGT CCA-3’ (25); mut-PPRE, 5’-GAT CCT CCC GAA CGC AGC TGT CAG CTG GGT CCA-3’; RXRE, 5’-GAT ACT GCT GTC ACA GGT CAC AGG TCA CAG TTC AA-3’ (25); mut-RXRE, 5’-GAT ACT GCT GTC ACA GCA CAC AGC ACA CAG TTC AA-3’; LXRE, 5’-GAT CCC TTT GGT CAC TCA AGT TCA AGT GGA TC-3’(25); mut-LXRE, 5’-GAT CCC TTT GGT CAC TCA AGA ACA AGT GGA TC-3’.
Transfection Studies
Hep3B cells were grown overnight in 6-well plates (1.5×10⁵/well) and washed twice with serum-free medium. 5 μg/mL of lipofectin (Invitrogen Life Technologies, Carlsbad, CA) was pre-incubated in the serum-free media for 45 min. For promoter-luciferase construct, 1.0 μg/mL of PPRE-luciferase (kindly provided by Dr. N. Bass, UCSF), NFκB-luciferase (kindly provided by Dr. Arthur Weiss, UCSF), LXRE-luciferase (kindly provided by Dr. David Mangelsdorf, University of Texas-Southwestern), LXR promoter-luciferase (kindly provided by Dr. David Mangelsdorf, University of Texas-Southwestern), and PGC-1α promoter-luciferase (kindly provided by Dr. Bruce M. Spiegelman, Dana-Farber Cancer Institute, Harvard Medical School) were used. Control vectors for the luciferase constructs were not regulated by TNF-α or IL-1β. To form DNA-lipofectin complex, DNA-containing media was combined with pre-incubated lipofectin media and incubated at room temperature for 15 min. At the end of the incubation, the cells were overlaid with the DNA-lipofectin complex and incubated at 37 °C for 4-6 h. After washing cells with serum-free medium, fresh growth medium containing 10% FBS was added. After 24 h of incubation the cells were washed with serum free MEM and the experimental media with or without TNF or IL-1 was added. After 24 h the cells were harvested, washed twice with PBS, treated with passive lysis buffer (Promega, Madison, WI), and aliquots of the lysates were assayed for luciferase activity using Wallac VICTOR2™ 1420 Multilabel Counter (Perkin Elmer Life Sciences). For normalization of transfection efficiency, we tested several vectors including CMV β-gal, SV40 β-gal, RSV β-gal, and TK-Renilla luciferase (RL). We found that expression of each of these promoters is significantly affected by cytokine treatment in Hep3B cells; some increase and some decrease. Therefore, we used raw data from the luciferase assay and the results shown herein are representative of similar experiments repeated 3-5 times. Our findings therefore represent the effect on the promoters studied.
Statistical Analysis
Data are expressed as mean ± S.E. of experiments from 3-5 dishes or animals per group for each time or concentration point. For transfection experiments, we show the mean of 3 separate experiments that contained 3 dishes per group. The difference between two experimental groups was analyzed using the unpaired t test. Differences among multiple groups were analyzed using one-way analysis of variance with the Dunnett’s post-test correction. A p value<0.05 was considered significant.
Results
Cytokines decrease RXR protein and mRNA levels
Our initial experiments examined the effect of TNF, IL-1, and IL-6 alone on RXRα protein levels in the nuclei ofHep3B cells. As shown in Figure 1A, both TNF and IL-1 decreased RXRα nuclear protein levels, whereas IL-6 had no effect. The combination of TNF and IL-1 did not result in any further reduction in RXRα protein levels compared to TNF or IL-1 alone. Moreover, as shown in Figure 1B and 1C, TNF and IL-1 also decreased the level of RXRα in total cell lysates.
Fig. 1.
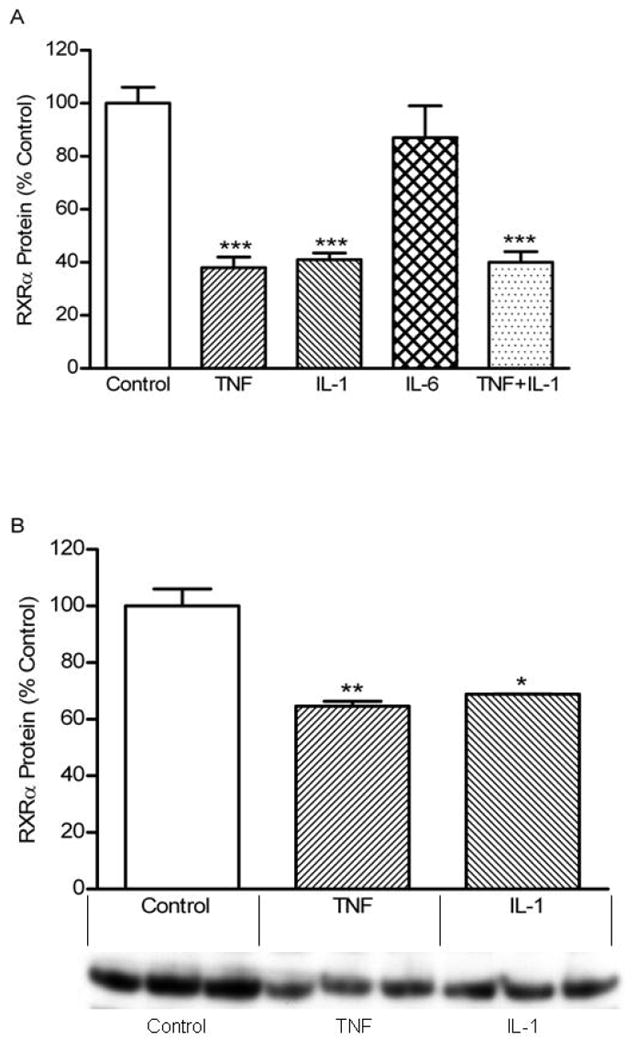
Effect of cytokines on RXRα protein levels in Hep3B cells. Hep3B cells were plated in 100 mm petri-dishes in culture media containing 10% serum. After an overnight incubation, cells were treated with the appropriate cytokine at 10 ng/ml. (A) After 24 h incubation, the nuclei was isolated and extracted, Western blot analysis was performed as described under “Materials and Methods”. (B, C) After 24 h incubation, total cell lysate was extracted and Western blot analysis was performed. Data (means ± S.E., n = 3) are expressed as a percentage of controls. ***, p < 0.001 versus control.
To gain further insight into the effect of cytokines on the expression of RXRα, we next examined the time course of the effect of TNF and IL-1 on RXRα protein levels. As shown in Figure 2, both TNF (A) and IL-1 (B) produced a decrease in RXRα protein levels as early as 4 h, which reached a maximal effect at 24 h and was sustained for 48 h. We treated Hep3B cells with various doses of cytokines ranging from 0.01 to 100 ng/mL and found that both TNF (Figure 2C) and IL-1 (Figure 2D) cause a maximal decrease in RXRα protein levels at a dose of 10 ng/mL with a half-maximal response at approximately 0.2 ng/mL. Together, these results demonstrate that in Hep3B hepatocytes TNF and IL-1 rapidly decrease the protein levels of RXRα, the major isoform of RXR in the liver, and that this decrease is a very sensitive cytokine response.
Fig. 2.

Time- and Dose-dependent changes in RXRα protein levels. Hep3B cells were plated in 100 mm petri-dishes in culture media containing 10% serum. After an overnight incubation, cells were treated with TNF (10 ng/mL) (A) or IL-1 (10 ng/mL) (B) and nuclear extracts were isolated at the time indicated. Also, Hep3B cells were treated at various concentrations of TNF (C) or IL-1 (D) for 24 h and nuclear extracts were isolated. Western blot analysis was performed as described under “Materials and Methods”. Data (means ± S.E., n = 3) are expressed as a percentage of controls. *,p <0.05, **,p<0.01, ***,p<0.001 versus control.
We next determined whether the decrease in RXRα protein levels is preceded by a decrease in RXRα mRNA levels. As shown in Figure 3, both TNF (A) and IL-1 (B) produce a rapid and sustained decrease in RXRα mRNA levels. By 4 h a maximal decrease in RXRα mRNA is seen and this decrease is sustained for 48 h. It should be noted that the decrease in RXRα mRNA occurred more rapidly than the changes in RXRα protein levels. PDTC, a chemical inhibitor of NF-κB, did not block the TNF induced decrease in RXRα indicating that increases in NF- κB activity are not required for this suppression (data not shown).
Fig. 3.

Time- and Dose-dependent changes in RXRα mRNA levels. Hep3B cells were plated in 100 mm petri-dishes in culture media containing 10% serum. After an overnight incubation, cells were treated with TNF (10 ng/mL) (A) or IL-1 (10 ng/mL) (B) and total RNA was isolated at the time indicated. Also, Hep3B cells were treated at various concentrations of TNF (C) or IL-1 (D) for 24 h and total RNA was isolated. Northern blot analysis was performed as described under “Materials and Methods”. Data (means ± S.E., n = 3) are expressed as a percentage of controls. *,p <0.05, **,p<0.01, ***,p<0.001 versus control.
In addition to RXRα there are two other RXR isoforms. In our Hep3B cells we were unable to detect either RXRβ or RXRγ by Western or Northern blotting (data not shown), indicating that the major RXR isoform in Hep3B cells, as in liver, is RXRα.
TNF and IL-1 decrease PPARα, -γ, but not -δ mRNA
We next examined the effect of TNF, IL-1, and IL-6 on LXRs and PPARs. Both TNF and IL-1 decreased LXRα mRNA levels (Figure 4A) without altering LXRβ mRNA levels (data not shown) The effects of cytokines on PPARs were isoform-specific. TNF and to a lesser extent, IL-1 decreased PPARα (Figure 4B) and γ (Figure 4C) mRNA levels. However, IL-1 and to a lesser extent TNF, increased PPARδ mRNA levels (Figure 4D). As seen previously for RXRα, IL-6 had no effect on the mRNA levels of LXRs or PPARs. To ensure that the results seen with Northern blotting were correct, we also measured the levels of RXRα, LXRα, PPARα, and PPARγ using real time QPCR. As shown in Table 2, TNF and IL-1 decreased the mRNA levels of RXRα, LXRα, PPARα, and PPARγ to a similar degree as seen with Northern blotting. Finally, treatment of Hep3B cells with 100 ng/ml LPS did not result in a decrease in the mRNA levels of either RXRα or PPARα (data not shown). These results indicate that in addition to decreasing RXRα, TNF and IL-1 also decreased LXRα, PPARα and PPARγ mRNA levels. Unfortunately, despite using several different antibodies, we were unsuccessful in measuring LXRα, PPARα and PPARγ protein levels by Western blotting in Hep3B cells due to a large number of nonspecific bands.
Fig. 4.

Cytokines regulate mRNA levels of LXRα and PPARs. Hep3B cells were plated in 100 mm petri-dishes in culture media containing 10% serum. After an overnight incubation, cells were treated with cytokines (10 ng/mL) as indicated. After 24 h, total RNA was isolated and Northern blot analysis was performed using cDNAs for LXRα (A), PPARγ (C), and PPARδ (D) as described under “Materials and Methods”. 1 μg of total RNA was also reverse transcribed to cDNA. PPARα mRNA expression (B) was measured by Quantitative Real Time PCR as described under “Materials and Methods”. QPCR data were normalized using 36B4 mRNA as the invariant control for all experiments. Data (means ± S.E., n = 3) are expressed as a percentage of controls. *,p <0.05, **,p<0.01, ***,p<0.001 versus control.
Table 2.
Gene expression changes in Hep3B cells by Real Time Quantitative PCR
| Control | TNF | IL-1 | |
|---|---|---|---|
| RXRα | 100±14.8 | 52.6±3.4** | 77.1±3.7* |
| LXRα | 100±11.7 | 46.4±2.1** | 63.9±4.7* |
| PPARα | 100±2.5 | 45.7±9.6** | 72.4±7.5* |
| PPARγ | 100±5.5 | 53.4±2.1** | 63.2±5.5* |
| PGC-1α | 100±20.8 | 47.1±6.2* | 87.5±14.3 |
Hep3B cells were plated in 100mm Petri-dishes in culture media containing 10% serum. After an overnight incubation, cells were treated with cytokines (10ng/ml) for 24 h. Total RNA was isolated and quantitative Real Time PCR was performed as described under “Materials and Methods”. QPCR data were normalized using 36B4 mRNA as the invariant control for all experiments. Data is mean ± SEM n=3.
p<0.05,
p<0.01,
p<0.001 vs. control.
As reported previously in hamsters (25), LPS treated mice also displayed a decrease in RXRα, PPARα, PPARγ and LXRα mRNA levels (data not shown), indicating that the acute phase response in vivo decreases their nuclear hormone receptors. Moreover, in TNF or IL-1 treated mice, RXRα, PPARα, and LXRα mRNA levels decreased in the liver (Figure 5).
Fig. 5.
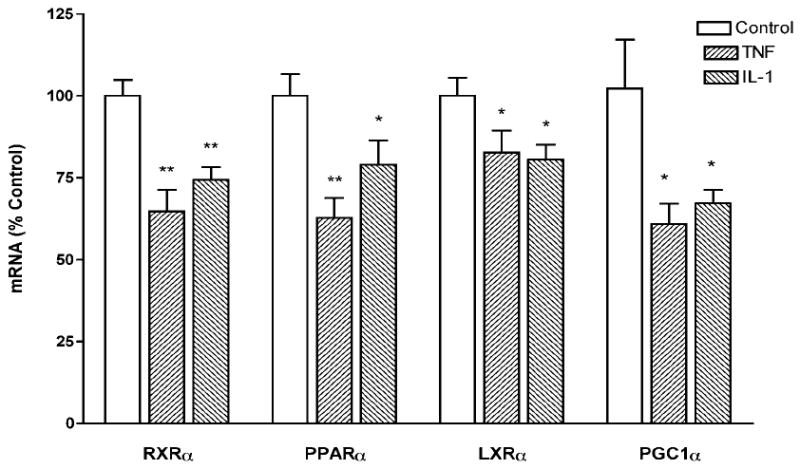
Cytokines decrease the expression of RXRα, PPARα, LXRα, and PGC-1α in vivo. C57BL/6 mice were injected IP with either saline (Control) or TNF (100 ng per mouse), or IL-1 (80 ng per mouse), and the animals were sacrificed after 16 h. Total RNA was prepared from liver and expression levels for PGC-1α (A), PGC-1β (B), and SRC-1 (C) were measured by Quantitative Real Time PCR as described under “Materials and Methods”. QPCR data were normalized using 36B4 mRNA as the invariant control for all experiments. Data (means ± S.E., n = 4) are expressed as a percentage of controls. *,p <0.05, **,p<0.01, ***,p<0.001 versus control.
Cytokines decrease the binding of nuclear extracts to RXRα, PPARα, and LXR response elements
To determine if the decrease in RXRα, LXRα, and PPARα and λ induced by TNF and IL-1 treatment results in decreased binding of nuclear extracts to the respective response elements we next carried out electrophoretic mobility shift assays. The response elements used in these studies were a direct repeat spaced by one oligonucleotide (DR-1) from the retinol-binding protein type II for the RXR:RXR homodimers, a DR-1 PPRE from the acyl-CoA oxidase promoter for the PPAR:RXR heterodimers, and a DR-4 from the cholesterol 7 α-hydroxylase promoter for the LXR:RXR heterodimer. As shown in Figure 6, treatment of Hep3B cells with either TNF or IL-1 significantly reduced the binding of nuclear extracts to the RXRE, PPRE, and LXRE. These data demonstrate that decreases in the levels of RXRα, LXRα, PPARα, and PPARγ resulted in reduced binding activity to known cognate response elements for their target genes.
Fig. 6.

Cytokines decrease the binding of nuclear extracts to RXRα, PPARα and LXRα. Hep3B cells were plated in 100 mm petri-dishes in culture media containing 10% serum. After an overnight incubation, cells were treated with cytokines at 10 ng/mL. After 24 h, nuclear extracts were isolated and 10 μg of the nuclear proteins were used for electrophoretic mobility shift assay with oligonucleotides for RXRα- PPARα- and LXRα-specific response elements as described under “Materials and Methods”. (A) Representative electrophoretic mobility shift assays for nuclear receptors studied. (B) Quantification of electrophoretic mobility shift assays from individual experiments. Data (means ± S.E., n = 5) are expressed as a percentage of controls. *,p <0.05, **,p<0.01 versus control.
Cytokines decrease the expression of PPARα and LXRα-regulated transcripts
To determine the effect of cytokine treatment on the expression of genes regulated by PPARα, the mRNA level of CPT1α was assayed in Hep3B cells following cytokine treatment. TNF and IL-1 significantly decreased mRNA levels of CPT1α (Figure 7A), a well-known PPARα target gene, whereas 18S mRNA levels are not affected by cytokine treatment (data not shown). Additionally, TNF and IL-1 both decrease the mRNA levels of SREBP-1c, an LXR regulated gene (Figure 7B). Similarly, LPS administration to intact mice also decreased CPT1α and SREBP-1c mRNA levels (data not shown). In contrast, mRNA levels of SREBP-1a and SREBP-2 were not altered by cytokine or LPS treatment (data not shown).
Fig. 7.

Cytokines decrease the mRNA level of CPT1α and SREBP-1c. Hep3B cells were plated in 100 mm petri-dishes in culture media containing 10% serum. After an overnight incubation, cells were treated with cytokines (10 ng/mL) as indicated. After 24 h, total RNA was isolated and Northern blot analysis was performed using cDNA for CPT1a (A) as described under “Materials and Methods”. 1 μg of total RNA was also reverse transcribed to cDNA. SREBP-1c mRNA expression (B) was measured by Quantitative Real Time PCR as described under “Materials and Methods”. QPCR data were normalized using 36B4 mRNA as the invariant control for all experiments. Data (means ± S.E., n = 3) are expressed as a percentage of controls. *,p <0.05, **,p<0.01, ***,p<0.001 versus control.
We next carried out transient transfection studies using a LXRE or PPRE construct linked to luciferase. As shown in Figure 8A and B, both IL-1 and TNF significantly decrease the expression of luciferase driven by a LXRE or PPRE promoter construct transfected into Hep3B cells. We also determined the effect of cytokines on the ability of a PPRE promoter construct to induce expression in cells treated with an exogenous activator of PPARα (WY 14, 643). Surprisingly, WY 14, 643 had only modest effects on luciferase activity driven by a PPRE (mean increase in luciferase activity in 5 separate experiments was 25% increase). These results suggest that Hep3B cells in our culture system have significant levels of endogenous ligands that activate the expression of PPRE and therefore the addition of exogenous ligands has only minimal effects. Nevertheless, TNF and IL-1 inhibited the expression of luciferase driven by the PPRE-containing promoters even in the presence of the exogenous ligand, WY14,643 (data not shown). Similarly, we determined the ability of cytokines to inhibit the expression of the LXRE in cells treated with the LXR activator, 22R-OH cholesterol. The effect of 22R-OH cholesterol on the expression of the LXRE varied; in some experiments luciferase activity was doubled whereas in other experiments there were only minimal changes. Regardless of the level of expression, both TNF and IL-1 decreased the expression of luciferase driven by a LXRE (data not shown).
Fig. 8.
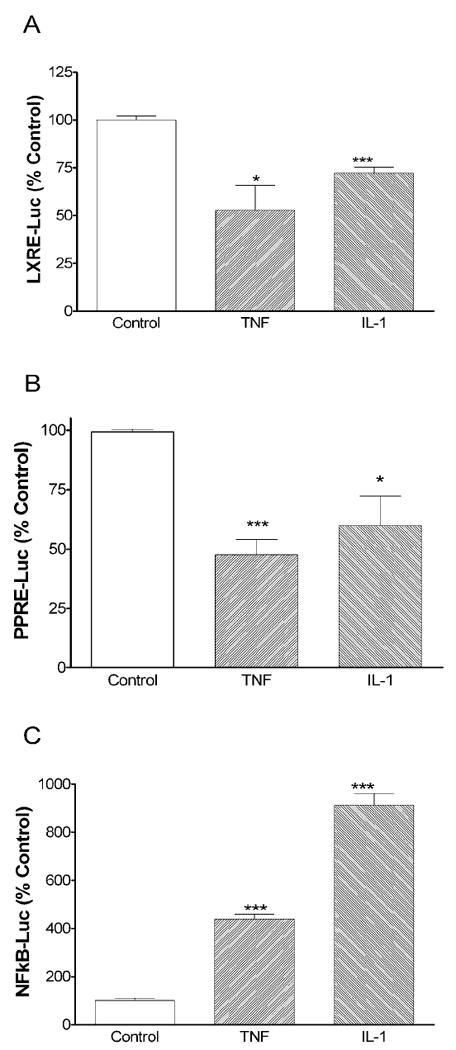
Cytokines regulate LXRα- PPARα- and NFκB-regulated transcription. Hep3B cells were plated in six-well plates. Transfections were performed as described under “Materials and Methods”. The next day, cells were treated with cytokines (10 ng/mL) as indicated. At the end of the incubation, cells were harvested in 0.5 mL passive lysis buffer and luciferase activity was determined (Promega). Data (means ± S.E., n = 3) are expressed as a percentage of controls. *,p <0.05, ***,p<0.001 versus control.
TNF and IL-1 are key regulators of inflammatory responses and stimulate the expression of genes that contain NF-κB or AP-1 binding sites in their promoters. As shown in Figure 8C, TNF and IL-1 increase the transcriptional activity mediated by NF-κB by about five and ten fold, respectively. These results indicate that the inhibition by TNF and IL-1 of the expression of LXRE and PPRE-regulated genes in Hep3B cells is specific and not due to a generalized repression of transcription.
LPS and cytokines decrease levels of coactivators PGC-1α, PGC-1β, and SRC-1
Since we found that protein and mRNA levels of nuclear hormone receptors are significantly decreased during the APR, we next determined whether LPS administered to intact animals or cytokine treatment of Hep 3B cells also have an effect on the expression of coactivators and corepressors. The expression of PGC-1α was markedly decreased by LPS and by TNF and IL-1 during the APR in mouse liver and Hep3B cells (Figure 5, 9A, 9D, and Table 2). Similarly, PGC-1β mRNA levels were also markedly reduced in liver by LPS treatment (Figure 9B). However, in Hep 3B cells TNF greatly decreased PGC-1β mRNA levels while IL-1 had no effect (Figure 9E). Finally, mRNA levels of SRC-1, one of the p160 family coactivators, were decreased during the APR (Figure 9C and F). In contrast we found that LPS, TNF or IL-1 do not affect mRNA levels of corepressors SMRT or NCoR or coactivators Trap220, SRC-2, -3, and CBP in either the liver with LPS treatment or Hep3B cells with TNF or IL-1 treatment (Data not shown). These results indicate that the mRNA levels of the coactivators PGC-1α, PGC-1β, and SRC-1 are specifically reduced during the APR, which could contribute to the alteration in gene expression and lipid metabolism during the APR.
Fig. 9.

Cytokines decrease the expression of PGC-1α, PGC-1β, and SRC-1 in vivo and in vitro. C57BL/6 mice were injected IP with either saline (Control) or LPS (100 μg of LPS per mouse) and the animals were sacrificed at 16 h after LPS administration. Total RNA was prepared from liver and expression levels for PGC-1α (A), PGC-1β (B), and SRC-1 (C) were determined. Also, Hep3B cells were treated with cytokines (10 ng/mL). After 24 h, total RNA was isolated and expression levels for PGC-1α (D), PGC-1β (E), and SRC-1 (F) were determined. Expression levels of PGC-1α and SRC-1 were measured by Northern blot, whereas expression levels of PGC-1β were measured by Quantitative RTPCR as described in “Materials and Methods”. QPCR data were normalized using 36B4 mRNA as the invariant control for all experiments. Data (means ± S.E., n = 4-5[in vivo], n=3[in vitro]) are expressed as a percentage of controls. *,p <0.05, **,p<0.01, ***,p<0.001 versus control.
We next determined the effect of cytokines on PGC-1α protein levels. As shown in Figure 10A and B, both TNF and IL-1 decrease the protein levels of PGC-1α. Unfortunately, no antibodies against PGC-1β are commercially available, so we were unable to determine if the protein levels of this coactivator also decrease. With regards to SRC-1, the presence of non specific bands made analysis problematic.
Fig. 10.
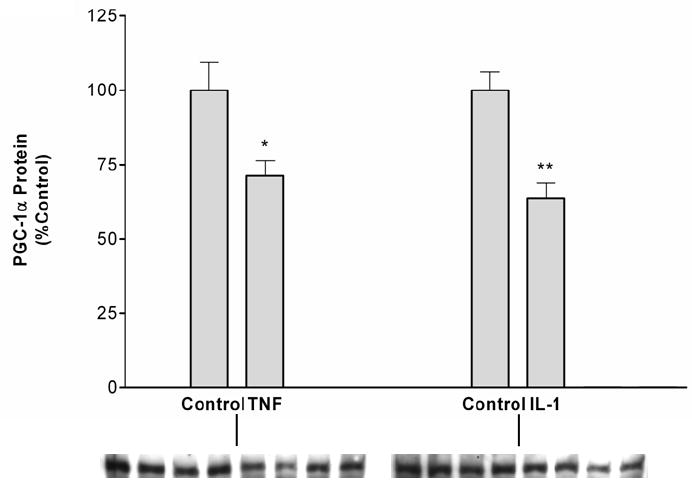
TNF and IL-1 decrease PGC-1α protein levels. Hep3B cells were plated in 100 mm petri-dishes in culture media containing 10% serum. After an overnight incubation, cells were treated with TNF (10 ng/mL) (A) or IL-1 (10 ng/mL) (B) and nuclear extracts were isolated. Western blot analysis was performed as described under “Materials and Methods”. Data (means ± S.E., n = 5) are expressed as a percentage of controls. *,p <0.05, **,p<0.01 versus control.
Cytokines decrease the expression of LXRα and PGC-1α
We next determined if the reduction in mRNA levels of LXRα and PGC-1α that are induced by cytokines occurs via changes in transcription of these genes. As shown in Figure 11A transcription of an LXRα promoter-luciferase construct is decreased by both TNF and IL-1 treatment. Similarly, the transcription of a PGC-1α promoter-luciferase construct is also decreased by TNF and IL-1 (Figure 11B). These data indicate that decreases in transcription contribute to the reduction in mRNA levels observed with cytokine treatment.
Fig. 11.

Cytokines decrease LXRα and PGC-1α promoter activity. Hep3B cells were plated in six-well plates. Transfections were performed as described under “Materials and Methods”. The next day, cells were treated with cytokines (10 ng/mL) as indicated. At the end of the incubation, cells were harvested in 0.5 mL passive lysis buffer and luciferase activity was determined (Promega). Data (means ± S.E., n = 3) are expressed as a percentage of controls. *,p <0.05 versus control.
Discussion
Infection, inflammation and injury induce the acute phase response which results in a wide range of metabolic changes, which are mediated by altered gene expression, caused primarily by the production of inflammatory cytokines TNFα, IL-1β, and IL-6 (4, 7). The mechanism of induction of the positive acute phase proteins has been studied in detail (9, 10, 40). Activation of the TNF/IL-1 receptors leads to activation of transcription factors such as NF-κB and activator protein-1 (AP-1) inducing class I positive acute phase proteins while activation of the IL-6 receptor activates Janus kinase (JAK) tyrosine kinase which subsequently phosphorylates tyrosine residues of STAT proteins inducing the transcription of class II positive acute phase proteins. However, the underlying mechanisms of the negative acute phase proteins are less well understood. Data indicate that decreases in expression of genes involved in the metabolism of fatty acids, cholesterol, and bile acids are responsible for many of the changes in lipid metabolism that occur during the APR (4).
The characteristic changes in lipid metabolism that occur during the APR include hypertriglyceridemia, decreased hepatic fatty acid oxidation and ketogenesis, inhibition of bile acid synthesis, and decreases in serum HDL levels. We previously showed that genes such as fatty acid transport protein, CD36/FAT, liver fatty acid binding protein, acyl CoA oxidase and CPT-Iα that are involved in triglyceride and fatty acid metabolism are down-regulated in the liver during the APR (4). As these genes have been identified as target genes of the nuclear hormone receptor PPARα, it is reasonable to speculate the involvement of PPARα/RXR in the altered lipid metabolism during the APR. Similarly, several of the genes involved in reverse cholesterol transport, bile acid synthesis, and hepatic cholesterol secretion, including CETP, cholesterol 7α hydroxylase, ABCG5, and ABCG8, also decrease during the APR (4). These genes are well recognized target genes of LXR and therefore it is also reasonable to speculate the involvement of LXR/RXR in the alterations of lipid metabolism that occur during the APR.
In support of this hypothesis previous studies have shown that the levels and DNA-binding activity of PPARα, LXRα, and their obligate heterodimers partners, RXRα,β, and γ, are significantly decreased during the LPS-induced APR in the livers of Syrian hamsters (25). This decrease was accompanied by the reduced expression of their target genes such as acyl Co-A synthase in the case of PPARα and cholesterol 7α hydroxylase for LXR. In the present manuscript we extend these findings and demonstrate that TNF and IL-1, but not IL-6, decreases the levels of RXRα, PPARα, PPARγ, and LXRα in Hep 3B cells. The decrease in RXRα was a very sensitive response with a half maximal effect seen at approximately 0.2ng/ml for both TNF and IL-1. Moreover, the response occurred very rapidly as decreases in RXRα mRNA levels were seen as early as 2 hours after cytokine treatment. These results indicate that pro-inflammatory cytokines can directly induce changes in the levels of RXRα, PPARα, PPARγ, and LXRα in hepatic tissue. In the case of LXRα we were able to further demonstrate that decreases in transcription at least partially account for the decrease in mRNA levels. Whether RXRα, PPARα, and PPARγ are also regulated at the level of gene transcription remains to be determined. Of note is that IL-6 is the pro-inflammatory cytokine primarily responsible for stimulating increases in many of the positive acute phase proteins (9). The results of the present study suggest that TNF and IL-1, rather than IL-6, are the key cytokines for regulating the expression of many of the negative acute phase proteins involved in lipid metabolism. Of course while the present study demonstrates the ability of TNF and IL-1 to directly decrease the levels of RXRα, PPARα, PPARγ, and LXRα in Hep 3B cells, these results do not rule out the possibility that other cytokines or signaling molecules contribute to the decreases observed in vivo following the induction of the APR.
LPS in vivo and TNF and IL-1 in cultured hepatocytes differentially regulated PPAR isoforms. As noted above PPARα and PPARγ levels decreased, while PPARβ/δ levels were unchanged or even increased. The molecular basis for this difference is not understood but it could have physiological ramifications. Activation of PPARα is well recognized to stimulate fatty acid oxidation in liver and other tissues (41). Very recent studies have unexpectedly shown that in the liver, PPARβ/δ stimulates many of the key genes involved in fatty acid synthesis, including acetyl-CoA carboxylase β, fatty acid synthase, acyl-CoA thioesterase 1, and ATP citrate lyase (42). These alterations in expression of PPAR isoforms are compatible with the changes in lipid metabolism observed during the APR i.e. a decrease in fatty acid oxidation and an increase in fatty acid synthesis (4).
In addition to demonstrating a decrease in RXRα, PPARα, PPARγ, and LXRα in Hep 3B cells following TNF and IL-1 treatment, the present study also demonstrates that cytokines decreased the binding activity of Hep 3B cell nuclear proteins to RXR, PPAR, and LXR response elements. Moreover, the mRNA levels of a PPARα target gene, CPT-1α, and an LXRα target gene, SREBP-1c, were reduced by TNF and IL-1. Finally, the expression of both a PPRE and an LXRE was decreased in cytokine treated cells. Together these results indicate that the decreases in RXR, PPAR, and LXR that occur during the APR are associated with changes in gene expression.
However, it is very likely that factors in addition to these nuclear hormone receptor transcription factors also play a role in regulating gene expression during the APR. Transcriptional activity of nuclear hormone receptors involves many cofactors that interact with the transcriptional activation function domains. These cofactors may suppress or activate transcriptional activity(31, 32). In the present study we demonstrate that several cofactors that activate transcription are decreased both in intact liver during the LPS induced APR and in Hep 3B cells treated with TNF or IL-1. Specifically, PGC-1α, PGC-1β, and SRC-1 were decreased. In the case of PGC-1α we were able to demonstrate that the decrease was at least partially accounted for by a decrease in gene transcription. Whether PGC-1β and SRC-1 are also regulated at the level of transcription remains to be determined. In contrast, the co-repressors NCoR and SMRT and the co-activators SRC-2, SRC-3, CPB, and TRAP 220 were not altered by cytokine treatment. While we studied several cofactors it should be recognized that the number of proteins that interact with nuclear hormone receptors can be quite large and the interactions poorly understood. For example, Surapureddi et al (43)identified a complex of cofactors for PPARα named the PPARα-interacting cofactor (PRIC). PRIC was composed of 25 polypeptides that interact with PPARα and 18 of these proteins contain one or more LXLL motifs. Those with the LXLL motifs include CBP, SRC-1, PBP, PRIP, PIMT, TRAP 100, SUR-2, PCG-1, and several previously unknown cofactors. The molecular mechanisms by which these cofactors interact to regulate transcription activity of nuclear hormone receptors are not understood. It has been proposed that CBP/P300 anchors a large multiprotein complex that performs the acetylation-methylation function to enhance transactivation by nuclear receptors whereas SRC-1 and -3 possess intrinsic acetyltransferase activity. Other cofactors may perform their function by contacting the basal transcriptional machinery. Regardless of the precise mechanisms involved our results indicate that during the APR several of these proteins are down-regulated. Thus, it is likely that the decreased expression of PPAR and LXR target genes is not only due to decreases in PPAR, LXR, and RXR, but may also be due to changes in cofactors that also regulate transcription.
In summary, the present study demonstrates that in liver cells, TNF and IL-1 cause a marked decrease in RXRα, PPARα, PPARγ, LXRα, PGC-1α, PGC-1β, and SRC-1. The cytokine-induced decreases were associated with decreased DNA-binding activity and decreased expression of PPARα and LXR regulated genes. This study suggests that the decreased expression of nuclear hormone receptors PPARα, PPARγ LXRα, RXRα and their coactivators PGC-1α, PGC-1β, and SRC-1 may be, at least in part, responsible for the some of changes in lipid metabolism that occur during the APR.
Acknowledgments
Grants
This work was supported by grants from the Research Service of the Department of Veterans Affairs and by National Institutes of Health Grant R01 HD29706.
Footnotes
Abbreviations used: PPAR, peroxisome proliferator-activated receptor; PGC-1α, PPARγ coactivator 1α; APR, acute phase response; C/EBP, CCAAT/enhancer-binding protein; STAT, signal transducer and activator of transcription; RXR, retinoid-X receptor; SRC-1, steroid receptor coactivator-1; CREB, cAMP RE binding protein; CBP, CREB binding protein; P300, E1A-associated factor; TRAP, thyroid receptor-associated protein; PPRE, peroxisome proliferator response element; RE, response element; AP-1, activator protein-1; AF, activation function; DR, direct repeat; PRIC, PPARα-interacting cofactor; PBP, PPAR-binding protein; PRIP, PPAR-interacting protein; PIMP, PRIP-interacting protein with methyltransferase domain; NCoR, nuclear hormone corepressor; SMRT, silencing mediator of retinoid and thyroid hormone receptors
Publisher's Disclaimer: This is a PDF file of an unedited manuscript that has been accepted for publication. As a service to our customers we are providing this early version of the manuscript. The manuscript will undergo copyediting, typesetting, and review of the resulting proof before it is published in its final citable form. Please note that during the production process errors may be discovered which could affect the content, and all legal disclaimers that apply to the journal pertain.
References
- 1.Kushner I. The phenomenon of the acute phase response. Ann N Y Acad Sci. 1982;389:39–48. doi: 10.1111/j.1749-6632.1982.tb22124.x. [DOI] [PubMed] [Google Scholar]
- 2.Baumann H, Gauldie J. The acute phase response. Immunol Today. 1994;15:74–80. doi: 10.1016/0167-5699(94)90137-6. see comments. [DOI] [PubMed] [Google Scholar]
- 3.Moshage H. Cytokines and the hepatic acute phase response. J Pathol. 1997;181:257–266. doi: 10.1002/(SICI)1096-9896(199703)181:3<257::AID-PATH756>3.0.CO;2-U. [DOI] [PubMed] [Google Scholar]
- 4.Khovidhunkit W, Kim MS, Memon RA, Shigenaga JK, Moser AH, Feingold KR, Grunfeld C. Effects of infection and inflammation on lipid and lipoprotein metabolism: mechanisms and consequences to the host. J Lipid Res. 2004;45:1169–1196. doi: 10.1194/jlr.R300019-JLR200. [DOI] [PubMed] [Google Scholar]
- 5.Sammalkorpi K, Valtonen V, Kerttula Y, Nikkila E, Taskinen MR. Changes in serum lipoprotein pattern induced by acute infections. Metabolism. 1988;37:859–865. doi: 10.1016/0026-0495(88)90120-5. [DOI] [PubMed] [Google Scholar]
- 6.Memon RA, Feingold KR, Moser AH, Doerrler W, Adi S, Dinarello CA, Grunfeld C. Differential effects of interleukin-1 and tumor necrosis factor on ketogenesis. Am J Physiol. 1992;263:E301–309. doi: 10.1152/ajpendo.1992.263.2.E301. [DOI] [PubMed] [Google Scholar]
- 7.Hardardottir I, Grunfeld C, Feingold KR. Effects of endotoxin on lipid metabolism. Biochem Soc Trans. 1995;23:1013–1018. doi: 10.1042/bst0231013. [DOI] [PubMed] [Google Scholar]
- 8.Memon RA, Feingold KR, Moser AH, Doerrler W, Grunfeld C. In vivo effects of interferon-alpha and interferon-gamma on lipolysis and ketogenesis. Endocrinology. 1992;131:1695–1702. doi: 10.1210/endo.131.4.1396316. [DOI] [PubMed] [Google Scholar]
- 9.Kishimoto T, Taga T, Akira S. Cytokine signal transduction. Cell. 1994;76:253–262. doi: 10.1016/0092-8674(94)90333-6. [DOI] [PubMed] [Google Scholar]
- 10.Zhong Z, Wen Z, Darnell JE., Jr Stat3 and Stat4: members of the family of signal transducers and activators of transcription. Proc Natl Acad Sci U S A. 1994;91:4806–4810. doi: 10.1073/pnas.91.11.4806. [DOI] [PMC free article] [PubMed] [Google Scholar]
- 11.Mangelsdorf DJ, Thummel C, Beato M, Herrlich P, Schutz G, Umesono K, Blumberg B, Kastner P, Mark M, Chambon P, Evans RM. The nuclear receptor superfamily: the second decade. Cell. 1995;83:835–839. doi: 10.1016/0092-8674(95)90199-x. [DOI] [PMC free article] [PubMed] [Google Scholar]
- 12.Chawla A, Repa JJ, Evans RM, Mangelsdorf DJ. Nuclear receptors and lipid physiology: opening the X-files. Science. 2001;294:1866–1870. doi: 10.1126/science.294.5548.1866. [DOI] [PubMed] [Google Scholar]
- 13.Blumberg B, Evans RM. Orphan nuclear receptors--new ligands and new possibilities. Genes Dev. 1998;12:3149–3155. doi: 10.1101/gad.12.20.3149. [DOI] [PubMed] [Google Scholar]
- 14.Kliewer SA, Lehmann JM, Willson TM. Orphan nuclear receptors: shifting endocrinology into reverse. Science. 1999;284:757–760. doi: 10.1126/science.284.5415.757. [DOI] [PubMed] [Google Scholar]
- 15.Martin G, Schoonjans K, Lefebvre AM, Staels B, Auwerx J. Coordinate regulation of the expression of the fatty acid transport protein and acyl-CoA synthetase genes by PPARalpha and PPARgamma activators. J Biol Chem. 1997;272:28210–28217. doi: 10.1074/jbc.272.45.28210. [DOI] [PubMed] [Google Scholar]
- 16.Yu GS, Lu YC, Gulick T. Co-regulation of tissue-specific alternative human carnitine palmitoyltransferase Ibeta gene promoters by fatty acid enzyme substrate. J Biol Chem. 1998;273:32901–32909. doi: 10.1074/jbc.273.49.32901. [DOI] [PubMed] [Google Scholar]
- 17.Mascaro C, Acosta E, Ortiz JA, Marrero PF, Hegardt FG, Haro D. Control of human muscle-type carnitine palmitoyltransferase I gene transcription by peroxisome proliferator-activated receptor. J Biol Chem. 1998;273:8560–8563. doi: 10.1074/jbc.273.15.8560. [DOI] [PubMed] [Google Scholar]
- 18.Brandt JM, Djouadi F, Kelly DP. Fatty acids activate transcription of the muscle carnitine palmitoyltransferase I gene in cardiac myocytes via the peroxisome proliferator-activated receptor alpha. J Biol Chem. 1998;273:23786–23792. doi: 10.1074/jbc.273.37.23786. [DOI] [PubMed] [Google Scholar]
- 19.Issemann I, Prince R, Tugwood J, Green S. A role for fatty acids and liver fatty acid binding protein in peroxisome proliferation? Biochem Soc Trans. 1992;20:824–827. doi: 10.1042/bst0200824. [DOI] [PubMed] [Google Scholar]
- 20.Hanley K, Komuves LG, Ng DC, Schoonjans K, He SS, Lau P, Bikle DD, Williams ML, Elias PM, Auwerx J, Feingold KR. Farnesol stimulates differentiation in epidermal keratinocytes via PPARalpha. J Biol Chem. 2000;275:11484–11491. doi: 10.1074/jbc.275.15.11484. [DOI] [PubMed] [Google Scholar]
- 21.Gearing KL, Gottlicher M, Widmark E, Banner CD, Tollet P, Stromstedt M, Rafter JJ, Berge RK, Gustafsson JA. Fatty acid activation of the peroxisome proliferator activated receptor, a member of the nuclear receptor gene superfamily. J Nutr. 1994;124:1284S–1288S. doi: 10.1093/jn/124.suppl_8.1284S. [DOI] [PubMed] [Google Scholar]
- 22.Steffensen KR, Gustafsson JA. Putative metabolic effects of the liver X receptor (LXR) Diabetes. 2004;53(Suppl 1):S36–42. doi: 10.2337/diabetes.53.2007.s36. [DOI] [PubMed] [Google Scholar]
- 23.Memon RA, Bass NM, Moser AH, Fuller J, Appel R, Grunfeld C, Feingold KR. Down-regulation of liver and heart specific fatty acid binding proteins by endotoxin and cytokines in vivo. Biochim Biophys Acta. 1999;1440:118–126. doi: 10.1016/s1388-1981(99)00120-1. [DOI] [PubMed] [Google Scholar]
- 24.Memon RA, Fuller J, Moser AH, Smith PJ, Feingold KR, Grunfeld C. In vivo regulation of acyl-CoA synthetase mRNA and activity by endotoxin and cytokines. Am J Physiol. 1998;275:E64–72. doi: 10.1152/ajpendo.1998.275.1.E64. [DOI] [PubMed] [Google Scholar]
- 25.Beigneux AP, Moser AH, Shigenaga JK, Grunfeld C, Feingold KR. The acute phase response is associated with retinoid X receptor repression in rodent liver. J Biol Chem. 2000;275:16390–16399. doi: 10.1074/jbc.M000953200. [DOI] [PubMed] [Google Scholar]
- 26.Bagby GJ, Spitzer JA. Lipoprotein lipase activity in rat heart and adipose tissue during endotoxic shock. Am J Physiol. 1980;238:H325–330. doi: 10.1152/ajpheart.1980.238.3.H325. [DOI] [PubMed] [Google Scholar]
- 27.Gouni I, Oka K, Etienne J, Chan L. Endotoxin-induced hypertriglyceridemia is mediated by suppression of lipoprotein lipase at a post-transcriptional level. J Lipid Res. 1993;34:139–146. [PubMed] [Google Scholar]
- 28.Memon RA, Feingold KR, Moser AH, Fuller J, Grunfeld C. Regulation of fatty acid transport protein and fatty acid translocase mRNA levels by endotoxin and cytokines. Am J Physiol. 1998;274:E210–217. doi: 10.1152/ajpendo.1998.274.2.E210. [DOI] [PubMed] [Google Scholar]
- 29.Ghose R, Zimmerman TL, Thevananther S, Karpen SJ. Endotoxin leads to rapid subcellular re-localization of hepatic RXRalpha: A novel mechanism for reduced hepatic gene expression in inflammation. Nucl Recept. 2004;2:4. doi: 10.1186/1478-1336-2-4. [DOI] [PMC free article] [PubMed] [Google Scholar]
- 30.Zimmerman TL, Thevananther S, Ghose R, Burns AR, Karpen SJ. Nuclear export of retinoid X receptor alpha in response to interleukin-1beta-mediated cell signaling: roles for JNK and SER260. J Biol Chem. 2006;281:15434–15440. doi: 10.1074/jbc.M508277200. [DOI] [PubMed] [Google Scholar]
- 31.McKenna NJ, O’Malley BW. Minireview: nuclear receptor coactivators--an update. Endocrinology. 2002;143:2461–2465. doi: 10.1210/endo.143.7.8892. [DOI] [PubMed] [Google Scholar]
- 32.Rosenfeld MG, Glass CK. Coregulator codes of transcriptional regulation by nuclear receptors. J Biol Chem. 2001;276:36865–36868. doi: 10.1074/jbc.R100041200. [DOI] [PubMed] [Google Scholar]
- 33.Chawla S, Hardingham GE, Quinn DR, Bading H. CBP: a signal-regulated transcriptional coactivator controlled by nuclear calcium and CaM kinase IV. Science. 1998;281:1505–1509. doi: 10.1126/science.281.5382.1505. [DOI] [PubMed] [Google Scholar]
- 34.Ait-Si-Ali S, Ramirez S, Barre FX, Dkhissi F, Magnaghi-Jaulin L, Girault JA, Robin P, Knibiehler M, Pritchard LL, Ducommun B, Trouche D, Harel-Bellan A. Histone acetyltransferase activity of CBP is controlled by cycle-dependent kinases and oncoprotein E1A. Nature. 1998;396:184–186. doi: 10.1038/24190. [DOI] [PubMed] [Google Scholar]
- 35.Weiss RE, Xu J, Ning G, Pohlenz J, O’Malley BW, Refetoff S. Mice deficient in the steroid receptor co-activator 1 (SRC-1) are resistant to thyroid hormone. Embo J. 1999;18:1900–1904. doi: 10.1093/emboj/18.7.1900. [DOI] [PMC free article] [PubMed] [Google Scholar]
- 36.Xu J, Qiu Y, DeMayo FJ, Tsai SY, Tsai MJ, O’Malley BW. Partial hormone resistance in mice with disruption of the steroid receptor coactivator-1 (SRC-1) gene. Science. 1998;279:1922–1925. doi: 10.1126/science.279.5358.1922. [DOI] [PubMed] [Google Scholar]
- 37.Ito M, Yuan CX, Okano HJ, Darnell RB, Roeder RG. Involvement of the TRAP220 component of the TRAP/SMCC coactivator complex in embryonic development and thyroid hormone action. Mol Cell. 2000;5:683–693. doi: 10.1016/s1097-2765(00)80247-6. [DOI] [PubMed] [Google Scholar]
- 38.Wang Z, Rose DW, Hermanson O, Liu F, Herman T, Wu W, Szeto D, Gleiberman A, Krones A, Pratt K, Rosenfeld R, Glass CK, Rosenfeld MG. Regulation of somatic growth by the p160 coactivator p/CIP. Proc Natl Acad Sci U S A. 2000;97:13549–13554. doi: 10.1073/pnas.260463097. [DOI] [PMC free article] [PubMed] [Google Scholar]
- 39.Neish AS, Khachigian LM, Park A, Baichwal VR, Collins T. Sp1 is a component of the cytokine-inducible enhancer in the promoter of vascular cell adhesion molecule-1. J Biol Chem. 1995;270:28903–28909. doi: 10.1074/jbc.270.48.28903. [DOI] [PubMed] [Google Scholar]
- 40.Kolesnick R, Golde DW. The sphingomyelin pathway in tumor necrosis factor and interleukin-1 signaling. Cell. 1994;77:325–328. doi: 10.1016/0092-8674(94)90147-3. [DOI] [PubMed] [Google Scholar]
- 41.Lee CH, Olson P, Evans RM. Minireview: lipid metabolism, metabolic diseases, and peroxisome proliferator-activated receptors. Endocrinology. 2003;144:2201–2207. doi: 10.1210/en.2003-0288. [DOI] [PubMed] [Google Scholar]
- 42.Lee CH, Olson P, Hevener A, Mehl I, Chong LW, Olefsky JM, Gonzalez FJ, Ham J, Kang H, Peters JM, Evans RM. PPAR{delta} regulates glucose metabolism and insulin sensitivity. Proc Natl Acad Sci U S A. 2006 doi: 10.1073/pnas.0511253103. [DOI] [PMC free article] [PubMed] [Google Scholar]
- 43.Surapureddi S, Yu S, Bu H, Hashimoto T, Yeldandi AV, Kashireddy P, Cherkaoui-Malki M, Qi C, Zhu YJ, Rao MS, Reddy JK. Identification of a transcriptionally active peroxisome proliferator-activated receptor alpha -interacting cofactor complex in rat liver and characterization of PRIC285 as a coactivator. Proc Natl Acad Sci U S A. 2002;99:11836–11841. doi: 10.1073/pnas.182426699. [DOI] [PMC free article] [PubMed] [Google Scholar]