

Summary
New information has been obtained recently regarding microtubule organization in Xenopus extract spindles. These spindles assemble in vitro by chromatin-mediated microtubule nucleation [1] and consist of randomly interspersed long and short microtubules [2] with minus ends distributed throughout the spindle [3]. Fluorescence speckle microscopy has led to the proposal that the Xenopus steady-state spindles contain two overlapping arrays of parallel or antiparallel microtubules with differing poleward flux velocities [4]. Although some of these features have also been reported for C. elegans female meiotic spindles [5], it is not clear whether they are representative of microtubule organization and dynamics in oocyte meiotic spindles. Here we examine anastral meiosis I spindles of live Drosophila oocytes expressing the microtubule plus end-tracking protein, EB1, fused to GFP, and find fluorescent particles throughout the spindle and movement towards both the poles and equator. EB1 particle velocities, corresponding to microtubule growth rates, are similar in both directions, but slower than growth from the poles in mitotic spindles of early embryos. Meiosis I spindles by photobleaching analysis yielded data showing similar microtubule growth rates and dynamics at the poles and equator, consistent with spindle microtubules of mixed polarity, differing from early embryo mitotic spindles.
Results and Discussion
EB1-GFP Particle Tracking in the MI Spindle
The end-binding protein, EB1, targets to polymerizing microtubule ends [6], where it has been used as a marker to identify growing microtubules and track microtubule growth [7]. We used an EB1-GFP fusion protein that labels particles in Drosophila early embryo mitotic spindles (Movie S1), as reported previously [8], to analyze microtubule growth in anastral oocyte meiosis I (MI) spindles. Mature MI spindles of late stage 13 or stage 14 oocytes expressing EB1-GFP showed fluorescent puncta throughout the spindle (Figure 1A). The smallest of these were the same intensity (41±1 arbitrary units or a.u., mean±SEM, n=94) as the smallest discrete particles in the cytoplasm (40±1 a.u., n=83) after correction for background, which was higher in the spindle than cytoplasm (Figure 1B). Based on this analysis, the smallest particles in the spindle probably correspond to single microtubule ends. Kymographs showed particle displacement in the spindle, correlated with movement in time-lapse sequences in opposite directions, either poleward or equator-ward (Figure 1C and Movie S2). Velocities of single particles tracked manually in the spindle image sequences (n=5) were the same towards the pole (v=-0.19±0.03 µm/s, n=22) as towards the equator (v=0.17±0.03 µm/s, n=17) (Figure 1D), and did not differ significantly from velocities determined from slopes of lines formed by particles in kymographs (poleward, v=-0.16±0.01 µm/s, n=135; equator-ward, v=0.18±0.01 µm/s, n=147; spindles, n=6).
Figure 1. EB1-GFP in the MI Spindle.
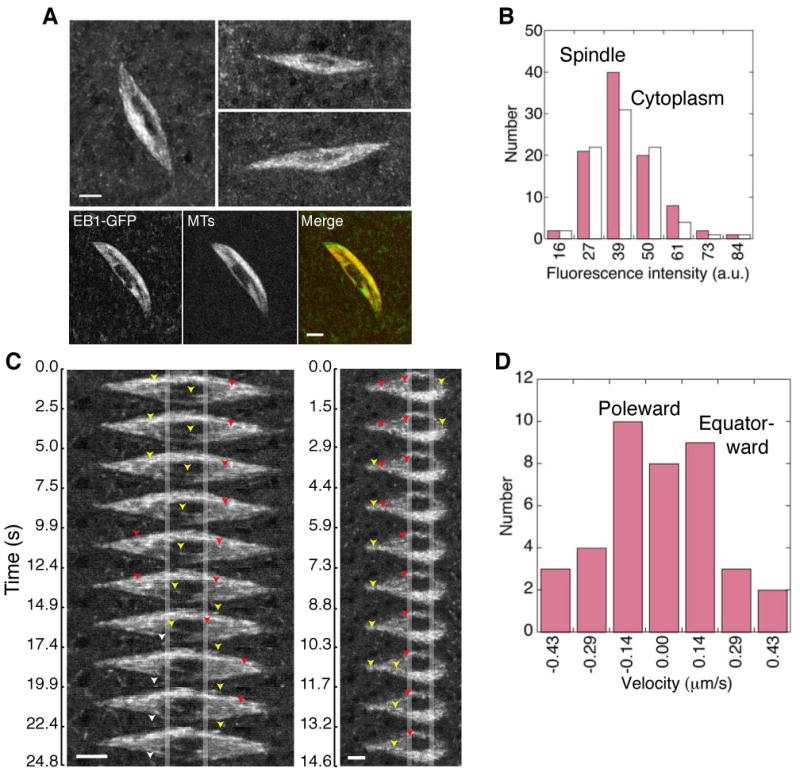
(A) Anastral oocyte MI spindles from flies expressing EB1-GFP, visible as small fluorescent particles in the spindle and cytoplasm. Bottom, MI spindle from flies co-expressing EB1-GFP (left) and Ncd-mRFP, a kinesin-14 motor that specifically labels MI spindle microtubules (MTs) [22] (middle). Merge (right), EB1-GFP (green) and Ncd-mRFP (red). The dark region at the spindle center corresponds to the meiotic chromosomes, which exclude EB1. Projections from z-series images. Bars, 3 µm.
(B) Fluorescence intensity of EB1-GFP particles (≤5 × 5 pixels) in the MI spindle (pink) and cytoplasm (white). a.u., arbitrary units.
(C) MI spindle images showing poleward (yellow or white arrowheads) and equator-ward (red arrowheads) EB1 particle movement over time. Vertical lines indicate the alignment. Bars, 3 µm (left) and 2 µm (right).
(D) Particle velocity from manual tracking of particles in spindle images. Poleward (-), equator-ward (+).
EB1 has been reported to bind to growing but not shrinking microtubule ends [6], thus the particle movement in oocyte MI spindles, unexpectedly, may correspond to microtubule growth from both the chromosomes and poles. EB1 particle velocity in MI spindles was faster by ∼3-fold than reported growth rates (0.063 µm/s) in interphase Drosophila S2 cells and approximately the same as shrinkage rates (0.145 µm/s) [8]. EB1 particle velocity in cycle 10 mitotic spindles of syncytial blastoderm embryos was 0.30±0.02 µm/s (particles, n=55; spindles, n=7; embryos, n=4), faster by ∼1.8-fold than MI spindles. EB1-GFP appeared as fluorescent particles and streaks in MI spindles, but usually did not appear as comets, as reported for polymerizing microtubule ends in other cells [6, 7], although comets were observed in mitotic spindles (Movie S1).
EB1 thus tracks microtubule ends in anastral oocyte MI spindles, appearing as fluorescent puncta or streaks that, unexpectedly, move towards either the pole or equator. The velocities of poleward and equator-ward EB1 particle movement were the same, but slower than EB1 particle motion away from the poles in mitotic spindles.
Fluorescence Flow Analysis of EB1-GFP in the MI Spindle
Given that oocyte MI spindle assembly involves chromatin-mediated microtubule nucleation [9, 10] and the unexpected finding of microtubule growth both poleward and equator-ward, inferred from EB1 particle movement, we assayed the MI spindles for net microtubule movement by fluorescence flow analysis to determine the dynamic state of the spindles. Net movement of EB1-GFP in the spindle was analyzed by calculating the fluorescence median position for each MI spindle half – the position on the spindle axis with equal amounts of fluorescence towards the equator and pole. The calculation was performed over time (∼230 s) to determine the velocity of the median position, as a measure of net microtubule movement. The mean net velocity for the MI half-spindles (n=16) was 0.0007±0.0016 µm/s (mean±SD) towards the equator (Figure 2A). The near zero velocity and large standard deviation indicate that the distribution of EB1 and thus microtubule plus ends does not change significantly over time. The data demonstrate that there is little net poleward or equator-ward EB1 motion in the MI spindle. Five spindles showed slow net poleward movement in one half and slow net equator-ward movement in the other, and the remaining three spindles showed slow net equator-ward motion in both halves, a distribution that is not significantly different from random (χ2=2.75, 1 d.f., p=0.10). Thus, fluorescence flow analysis shows essentially no net change over time in EB1-GFP distribution in the MI spindle, consistent with a steady-state spindle.
Figure 2. Fluorescence Flow Analysis of EB1 in the MI and Mitotic Spindle.
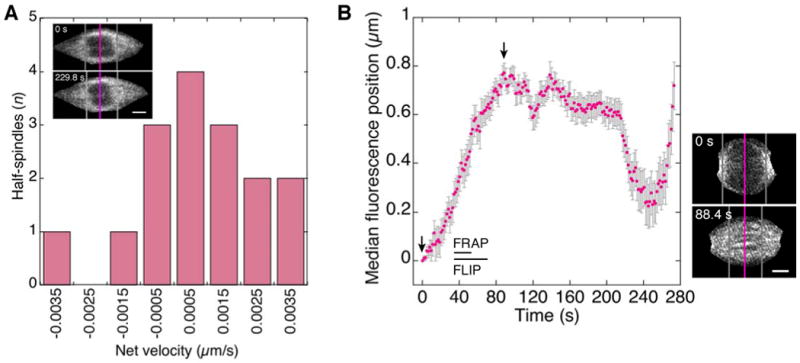
(A) Velocity of EB1-GFP fluorescence median in MI half-spindles measured from a fixed point outside the spindle pole. Poleward (-), equator-ward (+). Inset, MI spindle at beginning (top) and end (bottom) of analysis; pink line, equator; grey lines, fluorescence median position in half-spindles. Bar, 1.5 μm.
(B) Normalized fluorescence median position over time in mitotic half-spindles; error bars, SEM. Velocity between the arrows is 0.016±0.002 µm/s (mean±SEM; n=16). Mitotic spindle (right) at times corresponding to the arrows. Bar, 3 µm. FRAP and FLIP assays (Figures S2 and S4) were performed at the indicated times.
By contrast, assembling cycle 10 mitotic spindles showed progressive movement of the fluorescence median from a position near the pole towards the equator with a velocity of 0.016±0.001 µm/s (mean±SEM, n=16) (Figure 2B). The movement of the fluorescence median indicates that plus ends are initially concentrated at the poles and become distributed across the spindle as assembly proceeds. The peak of movement towards the equator is approximately mid-metaphase; the fluorescence median then moved back towards the pole as the spindle elongated in anaphase. The velocity of movement of the fluorescence median towards the equator is ∼20 times slower than the velocity of microtubule growth in the mitotic spindle of 0.30±0.02 µm/s, estimated from EB1 particle tracking. The slow movement of the fluorescence median is consistent with slow structural changes in the spindle caused by changes in microtubule stability, slow poleward flux, and microtubule translocation or sliding, resulting in net microtubule flow from the poles towards the equator during spindle assembly in early metaphase.
Fluorescence flow analysis is thus consistent with the conclusion that the MI spindle is at steady state. The EB1-GFP particle tracking shows movement in the MI spindle towards both the poles and the equator, indicating that microtubules in the steady-state MI spindle grow both poleward and equator-ward at the same velocity. This differs from early mitotic spindles where EB1 particles move away from the poles towards the equator and fluorescence flow is equator-ward, demonstrating that net microtubule movement occurs from the poles towards the chromosomes during spindle assembly in mitosis.
FRAP Assays of Microtubule Growth and Dynamics in MI Spindles
The finding of both poleward and equator-ward microtubule growth in MI spindles implies that MI spindles differ in microtubule dynamics from mitotic spindles. To further test this possibility, we measured EB1 turnover at the MI spindle poles and equator by fluorescence recovery after photobleaching (FRAP). Analysis of large and small regions of interest (ROIs) at the bleach spot center gave overlapping recovery curves, indicating that recovery was dominated by binding interactions, rather than diffusion. The absence of significantly slower recovery for the large ROI at the pole and equator suggested that recovery was dominated by EB1 binding and microtubule nucleation and dynamics in the bleach spot, rather than transport into the spot of EB1 bound to microtubule plus ends [11]. The data did not fit well to a single-state binding-dominant model, but showed a good fit to a two-state binding-dominant model that accounts for recovery by an initial rapid binding phase, followed by a slower binding phase [12]. The fast phase was attributed to rapid recovery by binding of unbleached protein to microtubules in the bleach spot, together with rapid microtubule nucleation and dynamics, and the slow phase to slower binding interactions and formation of new plus ends, and slower microtubule growth and dynamics.
Mean recovery data for the large and small ROI were fit to the model concurrently [13] to obtain kinetic constants for fluorescence recovery. The overlapping recovery curves for the pole and equator gave dissociation constants (koff) and pseudo-first order binding constants (k*on) that did not differ significantly for the two recovery phases at the pole and equator (Figure 3, Tables 1 and S1, and Movie S3), indicating similar rates of EB1 binding and microtubule nucleation and dynamics at the pole and equator for both phases.
Figure 3. EB1 and α-tubulin FRAP Assays in the MI Spindle.
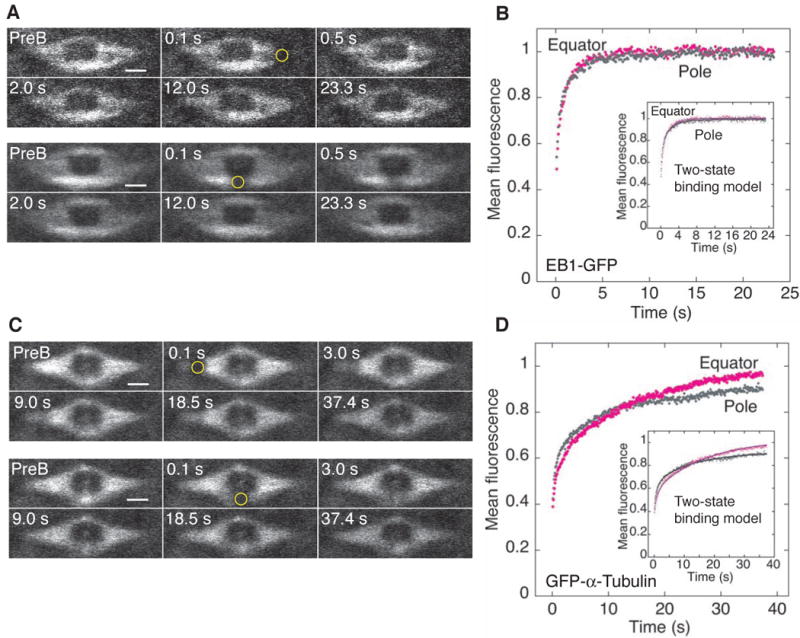
(A) FRAP assay of EB1-GFP at an MI spindle pole (top) or equator (bottom). ROI radius, w=0.55 µm (yellow circle). PreB, prebleach. Bars, 2 µm.
(B) Mean recovery data (w=0.5 µm) at the pole (grey, n=10) and equator (magenta, n=11) vs time. Inset, fits to a two-state binding model.
(C) FRAP assay of GFP-α-tubulin at an MI spindle pole (top) or equator (bottom). Bars, 2 µm.
(D) Mean recovery data (w=0.5 µm) at the pole (grey, n=12) and equator (magenta, n=12) vs time. Inset, fits to a two-state binding model.
Table 1.
FRAP Binding and Dissociation Constants
| EB1-GFP | |
| MI Spindle | k*on, koff at poles ≈ k*on, koff at equator |
| Mitotic Spindle | k*on, koff at poles >> k*on, koff at equator |
| GFP-α-tubulin | |
| MI Spindle | k*on, koff at poles ≈ k*on, koff at equator |
| Mitotic Spindle | k*on, koff at poles >> k*on, koff at equator |
Values from curve fits to FRAP data are shown in Tables S1 and S2. k*on, pseudo-first order binding rate constant; koff, dissociation constant.
Treatment with the microtubule stabilizing drug, taxol, to suppress microtubule dynamics [14] showed that EB1 turnover was dependent on microtubule dynamics, as we also inferred from analysis of large and small bleach spots: taxol-treated spindles recovered fluorescence at both the pole and equator 2-3 times more slowly than untreated spindles (Figure S1 and Tables S1 and S2).
Assays of cycle 10 mitotic spindles were performed for comparison with MI spindles to estimate EB1 turnover in spindles where microtubule nucleation and growth occurs predominantly from the poles. Analysis of large and small bleach spots in the spindle showed overlapping recovery curves, again indicating binding-dominant recovery, as we found for the MI spindle. The data did not fit well to a single-state binding-dominant model, but fit well to the two-state binding-dominant model described above. Fits of the data gave t1/2=∼0.1-0.2 s for the rapid early phase at the pole or equator (Figure S2 and Table S2), the same as the closely related EB3 in cultured cells [15], indicating a rapid dissociation and binding phase. The off- and on-rate constants for both the fast and slow binding-dominant phases were faster at the pole than equator, in striking contrast to the overlapping rate constants for the two phases at the MI spindle pole and equator (Tables 1 and S1).
The faster k*on at the mitotic spindle poles than equator for both recovery phases can be attributed to faster growth of microtubules at the poles and faster binding to microtubule ends at the poles because of a higher concentration of microtubule plus ends at the poles than equator. The MI spindle did not show differences in EB1 FRAP recovery kinetics at the poles and equator, indicating that the rate of microtubule growth and concentration of microtubule plus ends is the same at the pole and equator. The data are consistent with microtubule growth from the poles towards the equator during early metaphase in mitotic spindles of early embryos, but growth from both the chromosomes at the equator and poles in the MI spindle of oocytes.
Given that the EB1 FRAP kinetics reflects both EB1 binding and microtubule dynamics, FRAP assays were also performed on MI spindles of oocytes expressing GFP-α-tubulin [16], which is incorporated into, rather than bound to spindle microtubules like EB1. The data showed two-phase recovery with kinetics that was almost the same at the poles and equator (Figure 3 and Tables 1 and S1). The fast and slow k*on and koff rate constants indicate that net incorporation of GFP-α-tubulin occurs at the MI spindle pole and equator at comparable rates. Taxol resulted in overlapping curves for the pole and equator (Figure S1) with slower k*on, slow values at both (Table S1), consistent with the interpretation that slow k*on corresponds to microtubule growth that is stabilized by low concentrations of taxol [14]. Cycle 10 mitotic spindles yielded much faster k*on rate constants for both recovery phases at the pole than equator (Figure S2 and Table S1), reflecting rapid microtubule growth from the poles towards the equator during spindle assembly in early metaphase, consistent with the higher densities and formation rates of plus ends at the poles than equator indicated by EB1-GFP assays. These results differ from oocyte MI spindles, which showed similar kinetics of fluorescence recovery at the pole and equator for both GFP-α-tubulin and EB1-GFP.
FLIP Assays of Microtubule Growth and Transport in the Spindle
To determine whether the differences we observed between the MI and mitotic spindles by FRAP assays were evident by other methods, we used an alternative way of measuring microtubule dynamics, fluorescence loss in photobleaching (FLIP) [17], to estimate the rate of EB1-GFP movement at the spindle poles and equator. MI spindles were iteratively imaged and bleached at the equator or pole, and fluorescence loss was measured at the unbleached poles or equator. The assays showed fluorescence loss at the poles when the equator was bleached and at the equator when a pole was bleached, which was interpreted as due to movement of EB1-GFP from the unbleached region into the bleach ROI [17], with a higher rate of loss indicating a faster rate of movement. The assays thus showed movement of EB1-GFP from the MI spindle equator to the poles, and from the poles to the equator.
EB1-GFP fluorescence loss was ∼1.6-fold faster at the poles when the equator was bleached, than at the equator when a pole was bleached (Figure 4, Table S3, and Movie S4), indicating comparable poleward and equator-ward movement (Table 2). Bleaching both poles increased the rate of fluorescence loss at the equator by ∼1.7-fold, whereas bleaching a spindle half-equator reduced the rate of loss from the poles by ∼1.7-fold (Figure S3). Taxol reduced the rate of fluorescence loss at both the poles and equator (Table S3), indicating dependence of fluorescence loss in the unbleached region on microtubule dynamics.
Figure 4. EB1 and α-tubulin FLIP Assays in the MI Spindle.
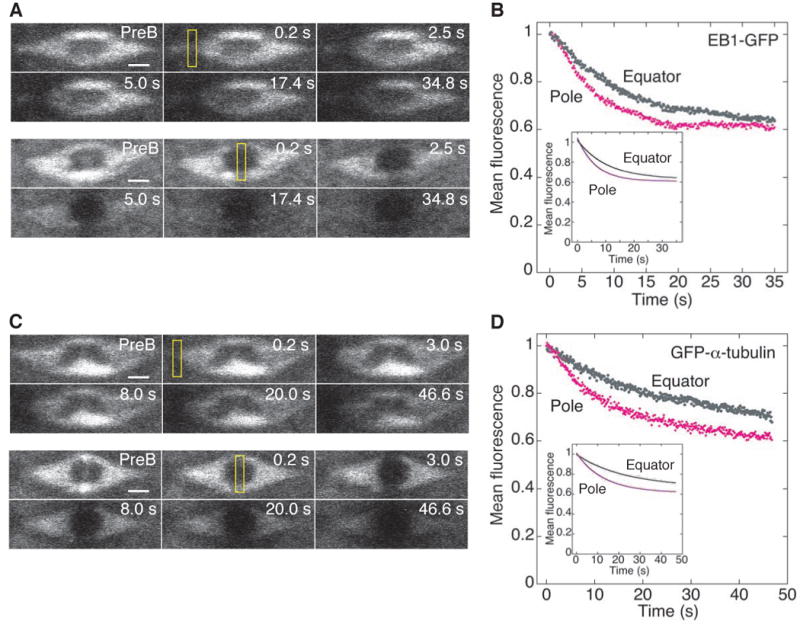
(A) FLIP assay of EB1-GFP at an MI spindle pole (top) or equator (bottom). ROI, 0.8 µm × 3.5 µm (yellow rectangle). PreB, prebleach. Bars, 2 µm.
(B) Mean fluorescence loss at the equator (grey, n=15) or pole (magenta, n=14) vs time upon bleaching a pole or the equator, respectively. Inset, fits to a first-order exponential decay equation; only every third data point is shown to show the curve fit.
(C) FLIP assay of GFP-α-tubulin at an MI spindle pole (top) or equator (bottom). Bars, 2 µm.
(D) Mean fluorescence loss at the equator (grey, n=8) or pole (magenta, n=8) vs time upon bleaching a pole or the equator, respectively. Inset, fits to a first-order exponential equation with only every third data point shown.
Table 2.
FLIP Fluorescence Loss Rate Constants
| EB1-GFP | |
| MI Spindle | kFLIP at poles ≈ kFLIP at equator |
| Mitotic Spindle | kFLIP at equator >> kFLIP at poles |
| GFP-α-tubulin | |
| MI Spindle | kFLIP at poles ≈ kFLIP at equator |
| Mitotic Spindle | kFLIP at equator >> kFLIP at poles |
Values from curve fits to FLIP data are shown in Table S3. kflip, fluorescence loss rate constant.
By contrast to MI spindles, cycle 10 mitotic spindles showed much faster loss at the equator when a pole was bleached, than at the poles when the equator was bleached (Figure S4 and Tables 2 and S3), consistent with rapid microtubule growth from the poles toward the equator during spindle assembly. The large difference between the MI and mitotic spindles provides evidence that microtubule growth and dynamics in the MI spindle differ significantly from embryo mitotic spindles. The rapid loss of fluorescence at both the unbleached MI spindle pole and equator, and its sensitivity to taxol, support the interpretation that EB1-GFP-bound microtubules grow both from the equator towards the poles and from the poles towards the equator in the MI spindle, differing from early embryo mitotic spindles where microtubule growth is predominantly from the poles towards the equator.
FLIP assays of GFP-α-tubulin in MI spindles showed ∼1.8-fold faster fluorescence loss at the poles when the equator was bleached, than at the equator when a pole was bleached (Figure 4 and Table S3), similar to EB1-GFP. Taxol did not change the rate of fluorescence loss at the equator when a pole was bleached, but slightly decreased the rate at the poles when the equator was bleached. The reason for the relatively small effect of taxol on GFP-α-tubulin in MI spindles compared to EB1-GFP is not certain; both gfp-α-tubulin and eb1-gfp taxol-treated females produced many fewer mature oocytes than untreated females and spindle fluorescence was greatly decreased, indicating that taxol was affecting the oocytes. Mitotic spindles showed ∼10-fold faster GFP-α-tubulin fluorescence loss at the equator when a pole was bleached, than at the poles when the equator was bleached (Figure S4), indicating much faster equator-ward than poleward microtubule growth and transport, in contrast to the MI spindle.
Thus, EB1 poleward movement due to microtubule growth and transport in the MI spindle, detected in FLIP assays, was ∼1.6-fold faster than equator-ward movement, in contrast to mitotic spindles where the equator-ward rate was ∼2.5 fold faster than the poleward rate. A similar difference was observed in α-tubulin assays where poleward movement in MI spindles was ∼1.8-fold faster than equator-ward movement, but equator-ward movement in mitotic spindles was ∼10-fold faster than poleward movement. These results provide strong evidence for the conclusion that microtubules grow both from the poles towards the equator and from the equator towards the poles in the oocyte MI spindle, in contrast to early embryo mitotic spindles in which microtubules grow predominantly from the poles towards the equator. The microtubule growth in MI spindles is probably needed for maintenance of the steady-state spindle, given that taxol causes the spindles to become smaller and to show greatly reduced EB1-GFP or GFP-α-tubulin fluorescence. Microtubule growth and dynamics in mature oocyte MI spindles thus differ from early embryo mitotic spindles, where both are much faster at the poles than equator.
Microtubule Growth and Dynamics in the MI Spindle
The finding of microtubule growth from both the equator and poles of a mature anastral oocyte spindle and similar microtubule dynamics at the equator and poles is unexpected. Microtubules in these spindles differ in dynamics from early embryo mitotic spindles, and growth from both the equator and poles implies that the microtubules are of mixed polarity, rather than oriented predominantly with minus ends at the poles. This differs from the accepted view of microtubule growth and organization in “classical” mitotic spindles. Although mitotic spindles can differ from one another in microtubule organization [18], anastral oocyte meiotic spindles may show more complex differences from mitotic spindles in the same organism, based on their dramatic differences in morphology [19] and the unusual pathway of assembly reported for some oocyte spindles [10, 20]. The finding of evidence for microtubules of mixed polarity in an anastral oocyte spindle indicates that microtubule organization in these spindles can differ from mitotic spindles. This compels modification of models that assume that microtubule minus end orientation in anastral oocyte meiotic spindles is biased towards the poles. For example, the finding of minus ends distributed throughout Xenopus extract spindles has led to the proposal that maintenance of the steady-state metaphase spindle depends on microtubule nucleation near chromatin, sorting and poleward transport of minus ends, and microtubule loss near the poles [3]. This model, which has recently been expanded into a slide-and-cluster model [21], does not account for the proposed mixed polarity of microtubules in the Drosophila oocyte MI spindle based on our observations, although the data we present do not rule out other features of such a model. An important implication of our findings is that anastral oocyte spindle mechanics, including chromosome distribution, could differ dramatically from “classical” mitotic spindles. In particular, the roles of microtubule motors and regulatory proteins involved in anastral oocyte spindle function, length regulation and dynamics may be very different, underlying further basic differences between anastral oocyte and “classical” mitotic spindles.
Supplementary Material
Acknowledgments
We thank CD Yankel for constructing the pCaSpeR/eb1-gfp plasmid, V Bennett for the use of a Zeiss LSM 510 confocal microscope and S Rogers for a gift of anti-EB1 serum. This study was supported by grants to SAE from the National Institutes of Health and March of Dimes Foundation. MAH is a 2008 Goldwater scholar.
Footnotes
Supplementary Data: Experimental Procedures, four figures, three tables, and four movies are available online.
Publisher's Disclaimer: This is a PDF file of an unedited manuscript that has been accepted for publication. As a service to our customers we are providing this early version of the manuscript. The manuscript will undergo copyediting, typesetting, and review of the resulting proof before it is published in its final citable form. Please note that during the production process errors may be discovered which could affect the content, and all legal disclaimers that apply to the journal pertain.
References
- 1.Heald R, Tournebize R, Blank T, Sandalzopoulos R, Becker P, Hyman A, Karsenti E. Self-organization of microtubules into bipolar spindles around artificial chromosomes in Xenopus egg extracts. Nature. 1996;382:420–425. doi: 10.1038/382420a0. [DOI] [PubMed] [Google Scholar]
- 2.Yang G, Houghtaling BR, Gaetz J, Liu JZ, Danuser G, Kapoor TM. Architectural dynamics of the meiotic spindle revealed by single-fluorophore imaging. Nature Cell Biol. 2007;9:1233–1242. doi: 10.1038/ncb1643. [DOI] [PubMed] [Google Scholar]
- 3.Burbank KS, Groen AC, Perlman ZE, Fisher DS, Mitchison TJ. A new method reveals microtubule minus ends throughout the meiotic spindle. J Cell Biol. 2006;175:369–375. doi: 10.1083/jcb.200511112. [DOI] [PMC free article] [PubMed] [Google Scholar]
- 4.Yang G, Cameron LA, Maddox PS, Salmon ED, Danuser G. Regional variation of microtubule flux reveals microtubule organization in the metaphase meiotic spindle. J Cell Biol. 2008;182:631–639. doi: 10.1083/jcb.200801105. [DOI] [PMC free article] [PubMed] [Google Scholar]
- 5.Srayko M, O'Toole ET, Hyman AA, Müller-Reichart T. Katanin disrupts the microtubule lattice and increases polymer number in C. elegans meiosis. Curr Biol. 2006;16:1944–1949. doi: 10.1016/j.cub.2006.08.029. [DOI] [PubMed] [Google Scholar]
- 6.Mimori-Kiyosue Y, Shiina N, Tsukita S. The dynamic behavior of the APC-binding protein EB1 on the distal ends of microtubules. Curr Biol. 2000;10:865–868. doi: 10.1016/s0960-9822(00)00600-x. [DOI] [PubMed] [Google Scholar]
- 7.Mahoney NM, Goshima G, Douglass AD, Vale RD. Making microtubules and mitotic spindles in cells without functional centrosomes. Curr Biol. 2006;16:564–569. doi: 10.1016/j.cub.2006.01.053. [DOI] [PubMed] [Google Scholar]
- 8.Rogers SL, Rogers GC, Sharp DJ, Vale RD. Drosophila EB1 is important for proper assembly, dynamics, and positioning of the mitotic spindle. J Cell Biol. 2002;158:873–884. doi: 10.1083/jcb.200202032. [DOI] [PMC free article] [PubMed] [Google Scholar]
- 9.Matthies HJG, McDonald HB, Goldstein LSB, Theurkauf WE. Anastral meiotic spindle morphogenesis: role of the Non-Claret Disjunctional kinesin-like protein. J Cell Biol. 1996;134:455–464. doi: 10.1083/jcb.134.2.455. [DOI] [PMC free article] [PubMed] [Google Scholar]
- 10.Sköld HN, Komma DJ, Endow SA. Assembly pathway of the anastral Drosophila meiosis I oocyte spindle. J Cell Sci. 2005;118:1745–1755. doi: 10.1242/jcs.02304. [DOI] [PMC free article] [PubMed] [Google Scholar]
- 11.Hallen MA, Liang ZY, Endow SA. Ncd motor spindle binding and transport in the mitotic spindle. J Cell Sci. 2008;121:3834–3841. doi: 10.1242/jcs.038497. [DOI] [PMC free article] [PubMed] [Google Scholar]
- 12.Sprague BL, Pego RL, Stavreva DA, McNally JG. Analysis of binding reactions by fluorescence recovery after photobleaching. Biophys J. 2004;86:3473–3495. doi: 10.1529/biophysj.103.026765. [DOI] [PMC free article] [PubMed] [Google Scholar]
- 13.Hallen MA, Ho J, Yankel CD, Endow SA. Fluorescence recovery kinetic analysis of γ-tubulin binding to the mitotic spindle. Biophys J. 2008;95:3048–3058. doi: 10.1529/biophysj.108.134593. [DOI] [PMC free article] [PubMed] [Google Scholar]
- 14.Derry WB, Wilson L, Jordan MA. Substoichiometric binding of taxol suppresses microtubule dynamics. Biochem. 1995;34:2203–2211. doi: 10.1021/bi00007a014. [DOI] [PubMed] [Google Scholar]
- 15.Dragestein KA, van Cappellen WA, van Haren J, Tsibidis GD, Akhmanova A, Knoch TA, Grosveld F, Galjart N. Dynamic behavior of GFP-CLIP-170 reveals fast protein turnover on microtubule plus ends. J Cell Biol. 2008;180:729–737. doi: 10.1083/jcb.200707203. [DOI] [PMC free article] [PubMed] [Google Scholar]
- 16.Grieder NC, de Cuevas M, Spradling AC. The fusome organizes the microtubule network during oocyte differentiation in Drosophila. Dev. 2000;127:4253–4264. doi: 10.1242/dev.127.19.4253. [DOI] [PubMed] [Google Scholar]
- 17.Cole NB, Smith CL, Sciaky N, Terasaki M, Edidin M, Lippincott-Schwartz J. Diffusional mobility of Golgi proteins in membranes of living cells. Science. 1996;273:797–801. doi: 10.1126/science.273.5276.797. [DOI] [PubMed] [Google Scholar]
- 18.Mastronarde DN, McDonald KL, Ding R, McIntosh JR. Interpolar spindle microtubules in PTK cells. J Cell Biol. 1993;123:1475–1489. doi: 10.1083/jcb.123.6.1475. [DOI] [PMC free article] [PubMed] [Google Scholar]
- 19.Wilson EB. The Cell in Development and Heredity. 3rd. NY: Macmillan; 1934. [Google Scholar]
- 20.Schuh M, Ellenberg J. Self-organization of MTOCs replaces centrosome function during acentrosomal spindle assembly in live mouse oocytes. Cell. 2007;130:484–498. doi: 10.1016/j.cell.2007.06.025. [DOI] [PubMed] [Google Scholar]
- 21.Burbank KS, Mitchison TJ, Fisher DS. Slide-and-cluster models for spindle assembly. Curr Biol. 2007;17:1373–1383. doi: 10.1016/j.cub.2007.07.058. [DOI] [PubMed] [Google Scholar]
- 22.Endow SA, Komma DJ. Spindle dynamics during meiosis in Drosophila oocytes. J Cell Biol. 1997;137:1321–1336. doi: 10.1083/jcb.137.6.1321. [DOI] [PMC free article] [PubMed] [Google Scholar]
Associated Data
This section collects any data citations, data availability statements, or supplementary materials included in this article.