Abstract
Objective
To examine the correlation between CT-based and radionuclide renogram-based measures of split renal function within a normal population of potential live kidney donors by use of 3D models generated from CT angiography.
Materials and Methods
173 renal donor candidates were retrospectively evaluated with CT and radionuclide renogram between March 1, 2005 and February 28, 2006, of whom 152 met study inclusion criteria. A blinded investigator using 3-D models created semi-automatically from the precontrast, arterial and excretory phases made measurements of CT renal volumes and attenuations. Mean renal attenuation and volume were used to calculate the net accumulation of contrast, and split renal function for comparison with radionuclide renography. Split function from CT was calculated in the arterial and excretory phases as well as based on split renal volume and the Patlak method.
Results
All four CT-based methods for the calculation of split renal function showed correlation with no significant difference from radionuclide renography (p>0.05, t test). Pearson correlations varied from 0.36 to 0.63 (p<0.001 for each). Difference scores revealed that the excretory and renal volume splits had the narrowest range, and demonstrate a linear, non-zero relationship to the renogram splits. Bland-Altman analysis confirms that the majority of difference scores between each CT method and the radionuclide renogram fall within the 95% CI of the differences.
Conclusion
Split renal function based on 3D CT models can provide “one-stop” evaluation of both the anatomic and functional characteristics of the kidneys of potential live kidney donors. The excretory phase data and the split renal volume data show the best correlation and the smallest difference scores.
Keywords: Split renal function, 3D kidney modeling, renogram, renal artery, transplantation
Introduction
The evaluation of split renal function in live renal donors is important since significant disparity in renal function will often prevent donation; the process commonly utilizes a gamma camera renogram with technetium-99m MAG3 to measure individual kidney function [1]. For the renogram, injection of a radioactive tracer is followed at 2 minutes by transdermal measurement of the amount of decay from each kidney. The MAG3 bound technetium used in this technique is freely filterable at the glomerulus, but neither secreted nor resorbed by the kidney tubule. As a consequence, the accumulation of technetium within each kidney is a function of the agent's concentration in the arterial blood and the renal perfusion to each kidney. The delay between tracer injection and radioisotope measurement is short enough that there is essentially no excretion, so the radioactivity measured over each kidney is directly proportional to the glomerular filtration rate (GFR) for that kidney [2]. Split renal function is then calculated by comparing the radioactive tracer accumulation from each side in the first 2 minutes, divided by the total accumulation in both kidneys over the same period. The renogram has been demonstrated to have a relatively wide variance in normal values due to anatomical variation in the location and depth of the kidneys, patient body habitus, inconsistencies between examiners in the selection of the region of interest and the time to peak, as well as a variety of algorithms for calculating renal clearance. The average variance between repeat scans by the same operator on consecutive days is +/- 2% but up to 8% variation has been reported in standardization trials [3, 4]. Other patient factors such as state of diuresis can compound this variation, further reducing the reproducibility of this method. Yet, radionuclide assessment remains the reference standard due to the lack of a suitable alternative.
Iohexol is a radiopaque, intravenously administered, contrast agent that is freely filtered in the glomerulus, neither secreted nor reabsorbed in the renal tubules, physiologically similar to technetium-99m MAG3 [5-7]. Consequently, it represents an ideal radiopaque contrast agent for the assessment of renal function. Since iodinated contrast agents are already used for CT evaluation of potential renal donors for surgical candidacy, the data acquired has the potential to be used to additionally evaluate split renal function [8]. In 1991, Miles reported a method of evaluating renal tissue perfusion by CT. The method utilizes dynamic CT to quantify the accumulation of radiopaque contrast media in renal tissue and determines functional information about the kidney using the attenuation/time curve [9]. Based on this method, the accumulation of contrast medium in each kidney can be estimated and the split function determined. CT Angiography (CTA) has been examined by several groups as a possible method for evaluating split renal function. These studies [10-14] were small, but each showed that various 2D CT methods for the calculation of split renal function produce results only slightly different from those obtained by the current radionuclide renogram standard in populations with suspected or known renal disease including renal artery stenosis, hydronephrosis, stones, renal artery embolization, renal TB, and hematuria. However, slow CT scan speeds with older equipment as well as anatomic differences in the location of the renal artery origin, renal parenchymal size and pathologic conditions of the kidneys make estimation of total renal volume and attentuation from individual 2D slices problematic.
With the advent of faster spiral CT machines and 3D reconstruction techniques, faster and potentially more accurate measurements of the accumulation of contrast material in the kidneys are possible. However, the calculation of split function by 3D reconstruction has not been evaluated in a large-scale study with a normal population. The objective of this study is to examine the correlation between CT-based and radionuclide renogram-based measures of split renal function within a normal population of potential live kidney donors by use of 3D models generated from CT angiography.
Materials and Methods
Study Background
Patient Selection
We retrospectively collected renal CT angiography datasets and radionuclide renogram results in living renal donors from the imaging archives maintained by the (Blinded for Review) in accordance with Institutional Review Board protocols. Informed consent was waived for this review of existing patient data in this Health Insurance Portability and Accountability Act – compliant study. All potential donors screened for live renal donor evaluation between March 1, 2005 and February 28, 2006 were included for analysis as long as both their CTA images and radionuclide renogram results were available for review. The tri-phasic abdominal CTA images included unenhanced, arterial phase, and excretory phase data sets for examination of renal function by contrast clearance. Standardized settings were used as a starting point and adjusted by CT technicians as necessary to produce images for interpretation. The general settings were 120 KVp, Pitch 0.891 and rotation speed of 0.75 seconds. A routine maximum 300 mAs was used for each series. The arterial phase scan was triggered when a tracker region of interest in the left ventricle reached 150 HU. The excretory phase scan occurred 240 seconds after the same trigger. Images were constructed at the following slice thicknesses and increments respectively: precontrast 3mm at 3mm, arterial 2mm at 2mm, and excretory 3mm at 3mm. Iohexol 350 mgI/ml (GE Healthcare, Princeton, N.J.) was the contrast agent injected intravenously according to a standardized protocol with injection rates between 3-5 mL/sec according to individual patient features such as the gauge and location of the peripheral intravenous access. Patients with partial studies due to unsuccessful administration of contrast due to extravasation were not included. If the CT exam did not include the entire renal volumes or there were any focal lesions in the renal parenchyma, the patient was excluded from the study. Patients with renal lesions were excluded primarily because the presence of indeterminate renal lesions are criteria at our institution for temporary or permanent exclusion from donation regardless of the determination of split renal function by radionuclide renogram.
Creating the 3D kidney model
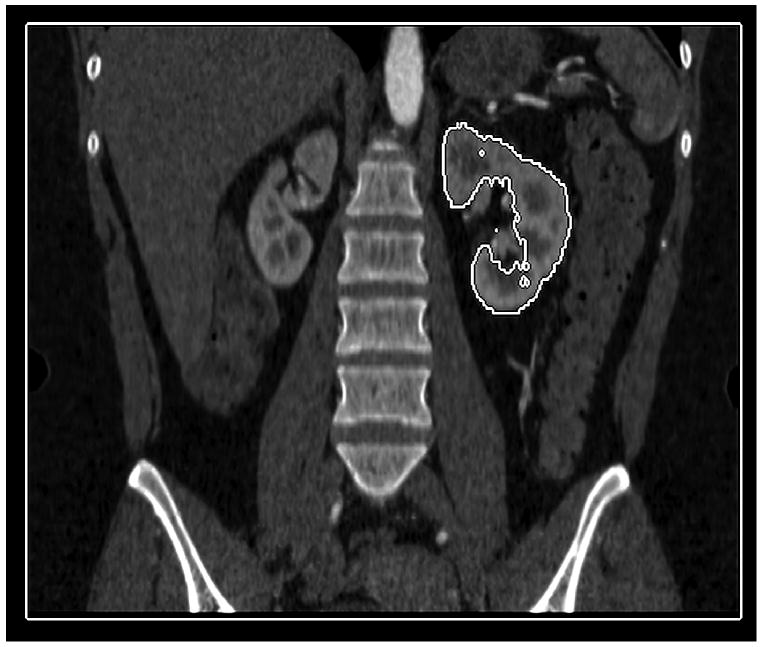
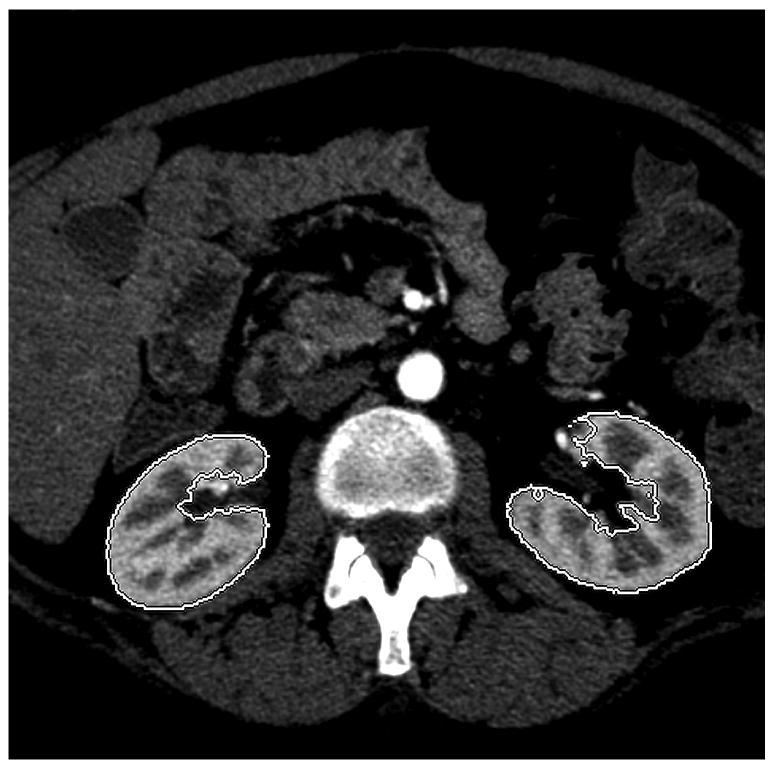
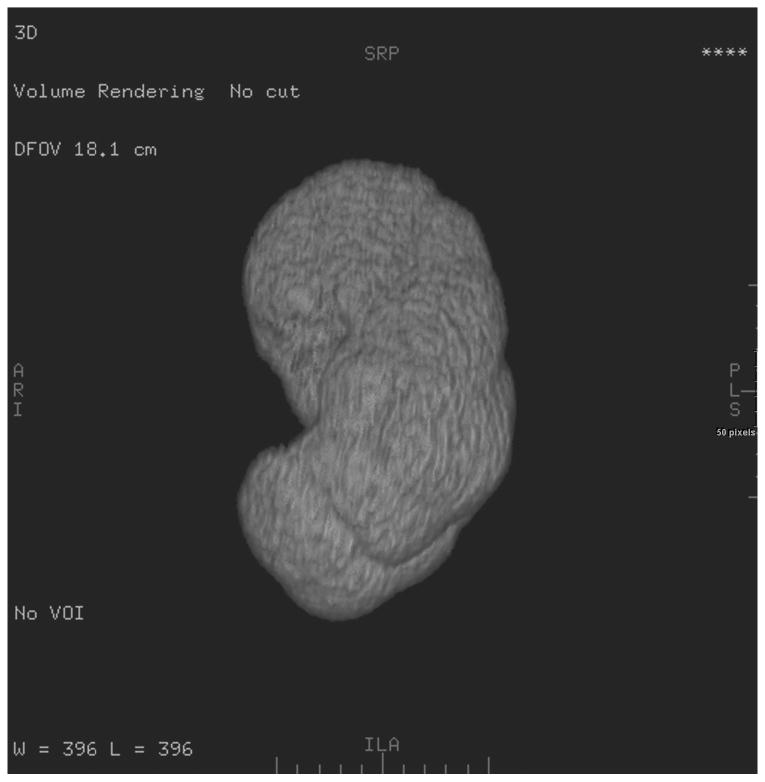
A GE Advantage Workstation Ver. 4.1 (GE Medical Systems, Milwaukee, Wis,) was used by one author to generate 3D CT models of the patients' kidneys. This investigator was blinded to the radionuclide renogram findings. 3D tools in the commercial software package have an “Add Object” function that was used to build a virtual representation of the kidneys, left and right separately, for each scan series. This tool functions by automatically filling a space that contains similar voxel values. Selecting a piece of the renal parenchyma allows the software to identify the remainder of surrounding renal parenchyma, but not adjacent fat, or fluid in the renal pelvis. It was sometimes necessary to utilize the opacity filters, color settings, and the cutting tool to free the margins of the 3D kidney from adjacent structures of similar attenuation (e.g. liver, spleen, psoas, intestine). Structures in the 3D model with attenuation values different from that of the renal parenchyma (such as the contrast-filled renal pelvis) could be subtracted from the model with the “Remove Object” tool. The final 3D model of each kidney was visually compared to the cross-sectional images to ensure that only the renal parenchyma was included in the virtual representation (Figure 1).
Figure 1.
Coronal (a), and axial (b) images highlight the ability of the 3D tools to isolate renal parenchyma from adjacent structures including the renal pelvis. The 3D model generated from these images is shown (c), but can be manipulated in space using 3D software to ensure accurate generation and delimitation of the parenchymal borders.
Analyzing the 3D Structure
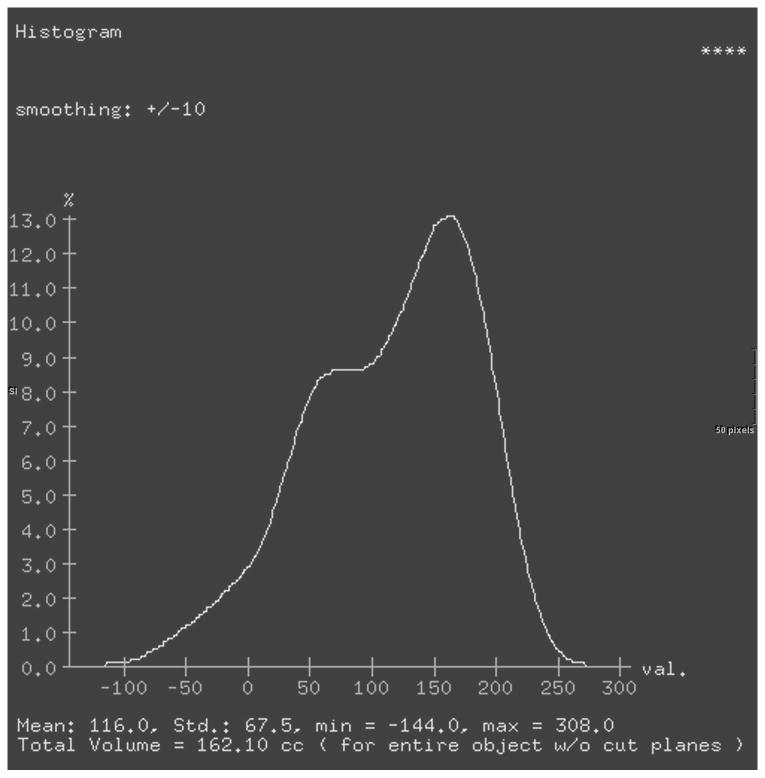
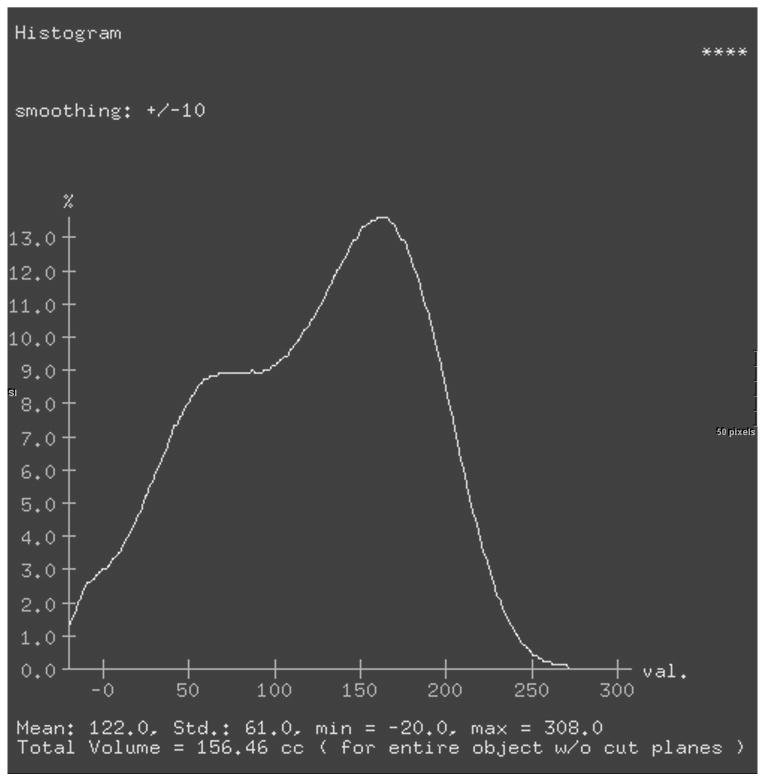
For the final 3D model, selecting the “view type” menu shows a histogram representing the percent voxels in the three dimensional structure of any given attenuation. This statistical tool provides the total volume and the mean attenuation for the entire 3D model in one step (Figure 2). A lower threshold of -20 HU was added to exclude gross fat surrounding the kidney and in the renal pelvis. Upper thresholds were not set due to differences in bolus administration rate, timing of the study, and the patient's diuretic state, which may cause considerable variation between patients. Parenchymal mean attenuation and volume were obtained for each kidney in all three phases with and without the use of the lower threshold.
Figure 2.
Histograms of renal volume attenuations without a lower threshold (a) or with a lower threshold (b). Both sets of data were analyzed even though the differences are relatively small.
Calculating Split function
Algebraic determination of split renal function followed the form put forward by Frennby, Almen, and Lilja, et al in 1995, modified only to account for volume instead of cross-sectional area [10]. For each side the difference between the mean attenuation in the arterial series (Art Att) and the pre-contrast series (Pre Att) was multiplied by the mean of the respective parenchymal volumes (Art Vol and Pre Vol) to measure the accumulation (Art Acc) of contrast in each individual kidney during the arterial phase.
Once this procedure was completed for both the left and right kidneys in the arterial phase, the Total Arterial Contrast Accumulation (Art Acc) on the right was divided by the sum of the Total Arterial Contrast Accumulation in both kidneys to determine the relative clearance of the contrast media from the right kidney in the arterial phase (Rt Art Split).
The above calculations were repeated using data from the excretory phase series to determine the right excretory split function. These data sets were generated from both the threshold-corrected data (to remove fat) and the uncorrected data. For the enhanced renal volume split function calculation, the volume (evaluated both with and without a threshold) of the right kidney in the excretory phase was divided by the total volume of the two kidneys (also in the excretory phase). The algebraic method of calculating split function yielded six data sets.
The Two-Point Patlak integral method has been studied in the determination of split function as well, and we also performed this calculation from our data [13]. Contrast clearance for each kidney is calculated using data from both the arterial and excretory phases. When calculating split function, as the clearance of the right kidney divided by the sum of the left and right clearances, the integrals in the numerator and denominator cancel out. The Patlak analysis yields two more data sets (one with and one without thresholding for fat attenuation) for a total of eight distinct measures of split renal function generated from the same 3D models of the kidneys.
Data Analysis
The relationships between each method and the radionuclide renogram were evaluated for systematic differences and also correlation. Paired two tailed t-tests were performed between each of the eight right split function measures compared to the right split function reported by the renogram method. Pearson correlation coefficients were also examined for each data set relative to the renogram and for all data sets relative to the creatinine clearance. For the t-test, a p value >0.05 indicated no significant systematic difference between the CT measured and the radionuclide determined split renal function. For Pearson's correlations, a p value <0.05 was considered statistically significant indicating a linear relationship between CT and radionuclide measures of split renal function, or between the split function measure and the creatinine clearance. Linear regression model equations were generated. Difference scores were computed for each patient to compare each of the right split function obtained from CTA with the right split function by renogram. The difference score is equal to the renogram-measured split renal function minus the CT-measured split renal function [13]. A Bland-Altman analysis was generated for comparison of CT-based and radionuclide renogram based method for assessing split renal function.
Results
Of 173 donors that were examined, seven did not have a renogram, nine donor exams demonstrated renal parenchyma pathology, and another five did not include the entire volume of the kidneys in the pre-contrast scan. The remaining 152 subjects were included in the analysis; however, due to motion artifact four patients did not have complete arterial data, so all arterial phase data sets include 148 subjects. The mean age of the subjects was 39.6 years with a range of 21-64 years. Females comprised 53.9% of the subjects. Racial representation consisted of white (73.1%), African American (25.8%), Hispanic (1.3%), and Asian subjects (0.7%). Mean creatinine clearance was 124 +/- 34 ml/min. The renogram right split function for our population was 49.2% +/- 4.3 and ranged from 29-63%. Of note, only 6 patients had split renal function of greater than or equal to 60/40, which would be generally considered a relative contraindication to donation at our institution.
Paired-sample t-tests (Table 1) showed that there was no significant systematic difference between any of our CT-based measures of split renal function and the standard radionuclide generated split renal function (p>0.05). The threshold-corrected arterial split renal function measurement, with a p value of 0.06, approached significance and tended to be higher. The mean difference score was approximately zero for all methods except the threshold-corrected arterial, which had a mean difference score of -0.7.
Table 1. Calculated split functions compared to renogram by t-test and correlation.
| Split Data Set | N | Mean+/- S.D. | t-test | P value | Correlation | P Value |
|---|---|---|---|---|---|---|
| Radionuclide Renogram | 152 | 49.2±4.3 | ||||
| Uncorrected Arterial | 148 | 49.7±3.7 | 1.13 | 0.26 | 0.36 | <0.001 |
| Uncorrected Excretory | 152 | 49.3±3.0 | 0.28 | 0.78 | 0.55 | <0.001 |
| Uncorrected Volume | 152 | 49.3±2.8 | 0.22 | 0.83 | 0.61 | <0.001 |
| Uncorrected Patlak | 152 | 49.2±3.6 | 0.17 | 0.87 | 0.49 | <0.001 |
| Threshold-Corrected Arterial | 148 | 50.0±4.0 | 1.92 | 0.06 | 0.38 | <0.001 |
| Threshold-Corrected Excretory | 152 | 49.5±3.1 | 0.95 | 0.34 | 0.58 | <0.001 |
| Threshold-Corrected Volume | 152 | 49.4±2.8 | 0.71 | 0.48 | 0.63 | <0.001 |
| Threshold-Corrected Patlak | 152 | 49.3±3.5 | 0.33 | 0.74 | 0.54 | <0.001 |
All eight CTA-acquired data sets were evaluated by t-test and Pearson Correlation to assess their relationship to the renogram results.
All data sets correlated with the renogram as indicated by Pearson correlation coefficients that were significantly different from zero (all p<0.001). However, the correlation coefficients for arterial split function were significantly less than those for excretory and split renal volume split functions both with (p=0.006) and without threshold correction (p=0.018).
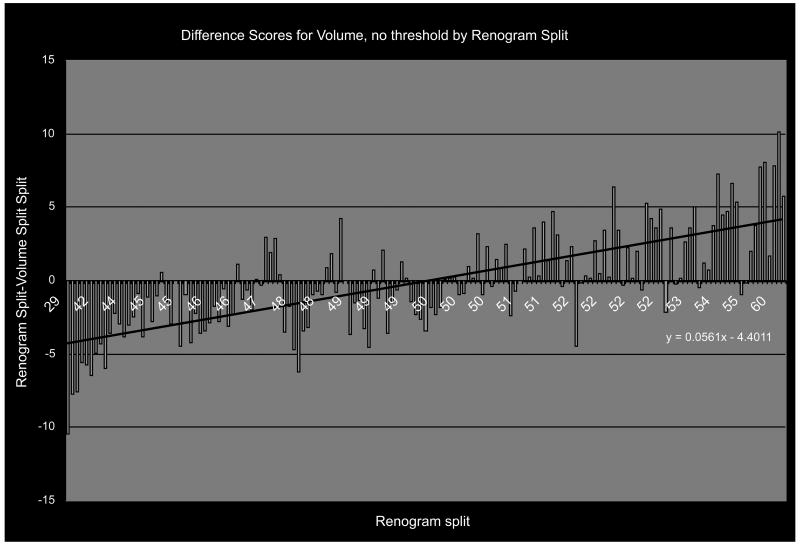
More descriptive of the relationship between our CT-calculated measures of split renal function and the radionuclide renogram is a diagram showing the range of difference scores in relation to the radionuclide renogram split. Figure 3 shows a representative diagram of the difference score plotted against the radionuclide standard split function – in this case for the CT-calculated split function based on enhanced renal volume without threshold correction (N=152) demonstrating a linear, non-zero relationship. The CT-calculated split function was generally in the same direction, but lesser in degree, than the reference standard; i.e. radionuclide renogram values tended to be lower than the CT-calculated splits when the right side had less than 50% of the function and higher than the CT-calculated splits when the right side had more than 50% of the function, but the differences were small.
Figure 3.
The 3D measures of split function vary in the same direction as the renogram, but to a lesser degree, thereby generating a difference score of each subject (blue bars) that correlate with renogram split roughly along the linear regression line shown (black line).
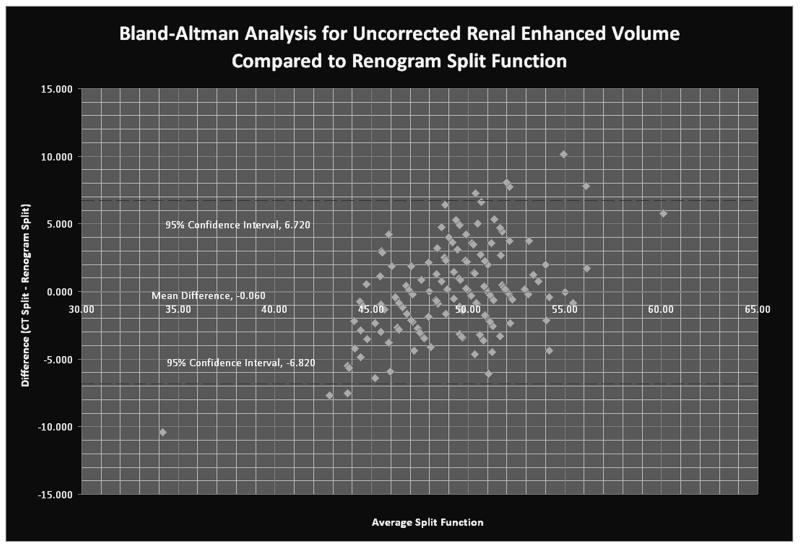
The Bland-Altman plot is used to assess the accuracy of two separate clinical measures; in this case CT-based versus radionuclide renogram-based determinations of split renal function. Because the Bland Altman analysis assumes that neither test is perfect, the two scores for each data point are averaged, and this average becomes the basis for the x-axis. The y-axis is the difference between the two independently-measured values. Every individual point represents the discrepancy between the CT and radionuclide renogram measures of split function for a given subject compared to the average of the two measures. The solid line identifies the mean difference between the scores across the entire data set, The dotted lines show the 95% confidence interval for the difference (95% of the differences should fall between these two lines). They are calculated as the mean±1.96*standard deviation of the differences. A perfect relationship would show no trend in the difference across a range of spit function values, but the difference shown here shows a clear trend, consistent with the CT-based methods' underestimation of the degree of the split compared to radionuclide renogram seen with the difference scores and in the flat slope of the correlation coefficient (Figure 4).
Figure 4.
Bland-Altman analysis demonstrates the difference between the CT and radionuclide renogram-based determinations of split function in relation to the mean difference (y=-0.06), and the 95% CI for the difference score data set (the dashed lines, y=+/- 1.96 S.D.).
Correction equations based on regression models were generated for each data set to determine if there was systematic variation that could be eliminated statistically, but the R2 values were not high enough to show that correction improved the data's inherent predictive power (Table 2).
Table 2. Correction Equations.
| Split Data Set | Correction Equation | R2 |
|---|---|---|
| Uncorrected Arterial (UA) | RS = 28.892+ 0.411 * UA | 0.13 |
| Uncorrected Excretory (UE) | RS = 11.181+ 0.772 * UE | 0.30 |
| Uncorrected Volume (UV) | RS = 3.505+ 0.928 * UV | 0.37 |
| Uncorrected Patlak (UP) | RS = 20.390 + 0.586 * UP | 0.24 |
| Threshold-Corr. Arterial (CA) | RS = 29.016+ 0.406 * CA | 0.14 |
| Threshold-Corr. Excretory (CE) | RS = 9.2541+ 0.808 * CE | 0.34 |
| Threshold-Corr. Volume (CV) | RS = 1.656+ 0.963 * CV | 0.40 |
| Corrected Patlak (CP) | RS = 16.271 + 0.668 * CP | 0.30 |
RS=Reference Standard
R2 Pearson Correlation Coefficient
With R2 values from the correction equations less than 0.5 for all the data sets, correction cannot improve the raw correspondence between our measured split function and the reference standard.
There was no correlation between any of the split function data sets (including the renogram) and the creatinine clearance (p>0.05). (Table 3)
Table 3. Split Function Correlations with Creatinine Clearance.
| Split Data Set | N | Correlation | P Value |
|---|---|---|---|
| Radionuclide Renogram | 152 | -0.08 | 0.362 |
| Uncorrected Arterial | 148 | -0.12 | 0.143 |
| Uncorrected Excretory | 152 | -0.07 | 0.422 |
| Uncorrected Volume | 152 | 0.01 | 0.978 |
| Uncorrected Patlak | 152 | -0.05 | 0.547 |
| Threshold-Corrected Arterial | 148 | -0.12 | 0.155 |
| Threshold-Corrected Excretory | 152 | -0.07 | 0.414 |
| Threshold-Corrected Volume | 152 | -0.03 | 0.691 |
| Threshold-Corrected Patlak | 152 | -0.06 | 0.496 |
All nine measures of split function were evaluated for correlation to creatinine clearance and found not to be significant.
Discussion
Current preoperative evaluation of potential renal donors requires multiple imaging exams; however, the potential for “one-stop” evaluation of these patients exists based on the physiologic properties of intravenous CT contrast agents such as iohexol. Most previous CT split renal function studies utilized slower CT scan speeds that required measuring the signal attenuation in multiple separate slices and to correct for the effect of perfusion time by taking these slices sequentially in two directions to average out perfusion effects. Creating regions of interest (ROI's) on multiple slices in multiple phases is tedious and time-consuming. Also, measuring the renal volume in each slice and adding multiple slices together multiplies the potential error in the final volume measurement.
Improved software and faster CT scans have made it possible to produce 3D representations of the kidneys from CT angiograms that measure both the attenuation and the volume semi-automatically. Faster scanners reduce the impact of perfusion on the continued accumulation of contrast during the scan because the entire kidney can be scanned in less than three seconds. Another advantage of this method is less extrapolation than 2D approaches because the software allows the 3D model to be sampled simultaneously over the entire volume one time, instead of adding multiple independent ROI's. A 3D reconstruction method has been examined in one small study and it demonstrated results within the standard error of the nuclear medicine split determination [14]. Despite the limitations of that study, the authors still concluded that 3D determination of split renal function was as accurate as renography, and was also much faster.
Our study shows that 3D modeling of CT angiography data to determine split renal function yields results that are not different from renal functional assessment by radionuclide renography among a population of potential live renal donors. Furthermore, the renal volume split, calculated solely by measuring the volume of the renal parenchyma in renal donors, without adjusting for contrast accumulation, is the most accurate measure of split renal function, regardless of threshold correcting. The enhanced renal volumes utilized for this split were recorded from the excretory phase; data from this series is generally the most reproducible and easiest to create automatically in our experience. Since chronic glomerular damage that reduces renal filtration is typically associated with parenchymal scarring and volume loss, volume may prove to be the best and easiest measure of split renal function, but the approach lacks the direct physiologic measure that is the goal of this study. Using a mathematical method for calculating contrast accumulation from the excretory phase images to determine the split function is slightly less accurate than renal volume split function, but still is not statistically different from the renogram and so allows for a physiologically more satisfying method of assessment.
Using 3-D modeling of the kidneys for the calculation of split renal function has multiple advantages over the current protocol for renal donor assessment. The use of one modality substantially reduces the cost of the evaluation. Conducting only one study also speeds up the evaluation process and reduces radiation exposure. The potential for automating the software to measure the renal volumes and determine splits is very real; this would greatly reduce the time and effort required to determine split renal function. CT-measured split renal function is also potentially more accurate than radionuclide renogram-measured split function because the latter varies significantly with patient habitus, kidney position, and the operator. Modifying the current CT protocol for renal donor evaluation would produce all the information necessary for the selection of the best kidney for donation at reduced cost, reduced time and with equal or improved accuracy compared to the commonly used radionuclide renogram method.
The Bland-Altman Analysis attempts to compare the accuracy of two clinical measures; in this case, CT-based versus renogram-based measures of split function and shows a significant degree of concordance for patients with normal split renal function. However, it is difficult to directly compare the CT-based and renogram-based measures of split function in the determination of donors with a wide split function for a number of reasons. There is no universal cutoff value for split function in the evaluation of live renal donors. At our institution we generally employ 60/40 split as a relative contraindication to donation. Of six donor evaluations with split function greater than or equal to 60/40 by renogram, five were excluded - three for hypertension, malignancy, and multiple renal arteries and two of the 152 patients solely on the basis of uneven split function. One patient with a 60/40 split was a successful donor. If we apply the same 60/40 limits from the renogram to the CT data set for uncorrected, contrast-enhanced volume split function, we identify only one of the six abnormal split functions identified by renogram.
There are limitations of this study that deserve to be addressed in future work. The correlations are not as high as those reported previously by other groups (ranging from 0.43 – 0.98) that were generated from 2D CT methods of data collection and analysis applied to a markedly abnormal patient population with known renal artery stenosis, hydronephrosis, hematuria, and other renal disease [8, 10]. Our novel method for the determination of split renal function from enhanced renal volume compares slightly more favorably. Our apparent low correlations with renogram may be due to our homogeneous population of potential live kidney donors and inherent limitations of the retrospective nature of this study.
First, our population was found to have a mean and standard deviation for the radionuclide split function more similar to those reported in radionuclide standardization studies, than to other studies that focus on renal artery stenosis. The screening of renal donors is a multi-step process and the application of split renal function is the last step of this process, consequently, the renal donors evaluated for split renal function are a relatively homogeneous group without significant past medical history, metabolic, or anatomic features that would make them poor donor candidates. Within our sample, most patients excluded due to lesions detected by CT were not further evaluated by nuclear renogram, so CT data collected on these patients was unable to be used in the data analysis. The nine patients in this study with a renogram-determined split function and abnormal CT scans had their nuclear renograms performed prior to their CT. Of note, recent guidelines published within the transplant community now make isolated simple renal cysts only a relative contraindication to donation [15]. It is possible that a broader population including those with known renal pathology could improve the correlation between CT-based and renogram-based methods of determination of split function that we detected in the present study.
Second, we were restricted to standard data sets acquired for live renal donor evaluation at our institution, which include precontrast, arterial and excretory phases. Precontrast images are considered essential by our surgeons for the detection of nephrolithiasis. Arterial images are used for evaluation of the highly variable renal vasculature. Excretory phase data are acquired several minutes after contrast administration so that the contrast has left the renal tubules and passed into the renal pelvis, ureters and bladder for the purpose of visualizing the urinary collecting system. In previous prospective studies, nephrographic phase scans allowed for the precise determination of single-pass contrast accumulation within the renal parenchyma, by acquiring images prior to excretion of contrast from the renal tubules. Nephrographic phase images might have made our correlations compare more favorably to other published studies. Adding a nephrographic phase scan to the CTA protocol for live renal donor evaluation would not extend the length of the exam and might yield more accurate data, but at the cost of increased radiation exposure. Because each scan series is uniquely important in the evaluation of the renal donor, no series was considered expendable; however, based on our results, the determination of split function based on renal enhancement volume would not require a pre-contrast scan and so could theoretically be employed in other contexts for the determination of split renal function when anatomic considerations are not so critical as they are in live renal donor evaluations.
Furthermore, this 3D method may be lacking in its ability to identify subjects with wider split renal function, as demonstrated by the linear trend of the difference scores, the flat slope of the correlation coefficient for all data sets, and the trend seen with the Bland-Altman analysis. The wider the split renal function was on radionuclide renography, the more the 3D CTA methods underestimated that magnitude. This may be due to autoregulation of GFR related to nephrotoxicity of iodinated intravenous contrast agents or again due to the use of excretory phase data instead of nephrographic phase data.
In spite of the limitations of this study, determination of renal function split by semi-automated 3D volumetric analysis of CT angiographic and nephrographic data sets remains a promising alternative to nuclear renography. In patients with normal renal function determined by serum chemistries and no apparent renal anomalies or anatomic defects on CT, 3D CTA is a suitable screening test for split renal function.
Acknowledgments
Special thanks to Ms. Trish Thurman for assistance in manuscript preparation.
References
- 1.Shokeir AA, Gad HM, el-Diasty T. Role of radioisotope renal scans in the choice of nephrectomy side in live kidney donors. J Urol. 2003;170:373–376. doi: 10.1097/01.ju.0000074897.48830.58. [DOI] [PubMed] [Google Scholar]
- 2.Clausen TD, Kanstrup IL, Iversen J. Reference values for 99mTc-MAG3 renography determined in healthy, potential renal donors. Clin Physiol Funct Imaging. 2002;22:356–360. doi: 10.1046/j.1475-097x.2002.00443.x. [DOI] [PubMed] [Google Scholar]
- 3.Houston AS, Whalley DR, Skrypniuk JV, Jarritt PH, Fleming JS, Cosgriff PS. UK audit and analysis of quantitative parameters obtained from gamma camera renography. Nucl Med Commun. 2001;22:559–566. doi: 10.1097/00006231-200105000-00015. [DOI] [PubMed] [Google Scholar]
- 4.Lin WY, Changlai SP, Kao CH. Normal ranges of renal physiological parameters for technetium-99m mercaptoacetyltriglycine and the influence of age and sex using a camera-based method. Urol Int. 1998;60:11–16. doi: 10.1159/000030196. [DOI] [PubMed] [Google Scholar]
- 5.O'Reilly PH, Brooman PJ, Martin PJ, Pollard AJ, Farah NB, Mason GC. Accuracy and reproducibility of a new contrast clearance method for the determination of glomerular filtration rate. Br Med J. 1986;293:234–236. doi: 10.1136/bmj.293.6541.234. [DOI] [PMC free article] [PubMed] [Google Scholar]
- 6.Brown SC, O'Reilly PH. Iohexol clearance for the determination of glomerular filtration rate in clinical practice: evidence for a new gold standard. J Urol. 1991;146:675–679. doi: 10.1016/s0022-5347(17)37891-6. [DOI] [PubMed] [Google Scholar]
- 7.Thomsen HS, Morcos SK. Contrast media and the kidney: European Society of Urogenital Radiology (ESUR) guidelines. Br J Radiol. 2003;76:513–518. doi: 10.1259/bjr/26964464. [DOI] [PubMed] [Google Scholar]
- 8.Nilsson H, Wadstrom J, Andersson LG, Raland H, Magnusson A. Measuring split renal function in renal donors: can computed tomography replace renography? Acta Radiol. 2004;45:474–480. doi: 10.1080/02841850410005282. [DOI] [PubMed] [Google Scholar]
- 9.Miles KA. Measurement of tissue perfusion by dynamic computed tomography. Br J Radiol. 1991;64:409–412. doi: 10.1259/0007-1285-64-761-409. [DOI] [PubMed] [Google Scholar]
- 10.Frennby B, Almen T, Lilja B, et al. Determination of the relative glomerular filtration rate of each kidney in man. Comparison between iohexol CT and 99mTc-DTPA scintigraphy. Acta Radiol. 1995;36:410–417. [PubMed] [Google Scholar]
- 11.Frennby B, Almen T. Use of spiral CT and the contrast medium iohexol to determine in one session aortorenal morphology and the relative glomerular filtration rate of each kidney. Eur Radiol. 2001;11:2270–2277. doi: 10.1007/s003300100831. [DOI] [PubMed] [Google Scholar]
- 12.el-Diasty TA, Shokeir AA, el-Ghar ME, Gad HM, Refaie AF, el-Din AB. Contrast enhanced spiral computerized tomography in live kidney donors: a single session for anatomical and functional assessment. J Urol. 2004;171:31–34. doi: 10.1097/01.ju.0000099784.52825.8e. [DOI] [PubMed] [Google Scholar]
- 13.Bjorkman H, Eklof H, Wadstrom J, Andersson LG, Nyman R, Magnusson A. Split renal function in patients with suspected renal artery stenosis: a comparison between gamma camera renography and two methods of measurement with computed tomography. Acta Radiol. 2006;47:107–113. doi: 10.1080/02841850500406787. [DOI] [PubMed] [Google Scholar]
- 14.Hackstein N, Buch T, Rau WS, Weimer R, Klett R. Split renal function measured by triphasic helical CT. Eur J Radiol. 2007;61:303–309. doi: 10.1016/j.ejrad.2006.09.001. [DOI] [PubMed] [Google Scholar]
- 15.Pham PC, Wilkinson AH, Pham PT. Evaluation of the potential living kidney donor. Am J Kidney Dis. 2007;50:1043–1051. doi: 10.1053/j.ajkd.2007.08.022. [DOI] [PubMed] [Google Scholar]


